
Field Notes
<--2018-07-12 11:25:00 | 2018-07-26 11:00:00-->Other sites visited today: Sherman Barn | East Pond | East End
Phenocam link: Searching...
West Pond: 2018-07-17 10:00:00 (DOY 198)
Author: Katrina Cone
Others: Elke, Daphne
Summary: VPD measurements with LI6400.
| We arrived around 10am, it was a sunny, warm, and clear day. We took VPD response curves with the LI6400 for cattail and tule at West Pond wetland. Elke and I took VPD response measurements on tule near the base of the tower with the Silver lab 6400 and the conifer chamber head. Measurements were taken on tule two leaves. Leaf temperature was controlled with measurements taken at three different temperatures, each set containing VPD measurements from maximum relative humidity to full scrub. Incoming CO2 was also controlled. Daphne took VPD response measurements on cattail growing beyond the boardwalk with the Baldocchi 6400 and the opaque 2x3 broadleaf chamber with the LED light source. Measurements were taken on two leaves. Leaf temperature was controlled with measurements taken at three different temperatures, each set containing VPD measurements from maximum relative humidity to full scrub. Incoming CO2 and light level were also controlled. |
1 photos found
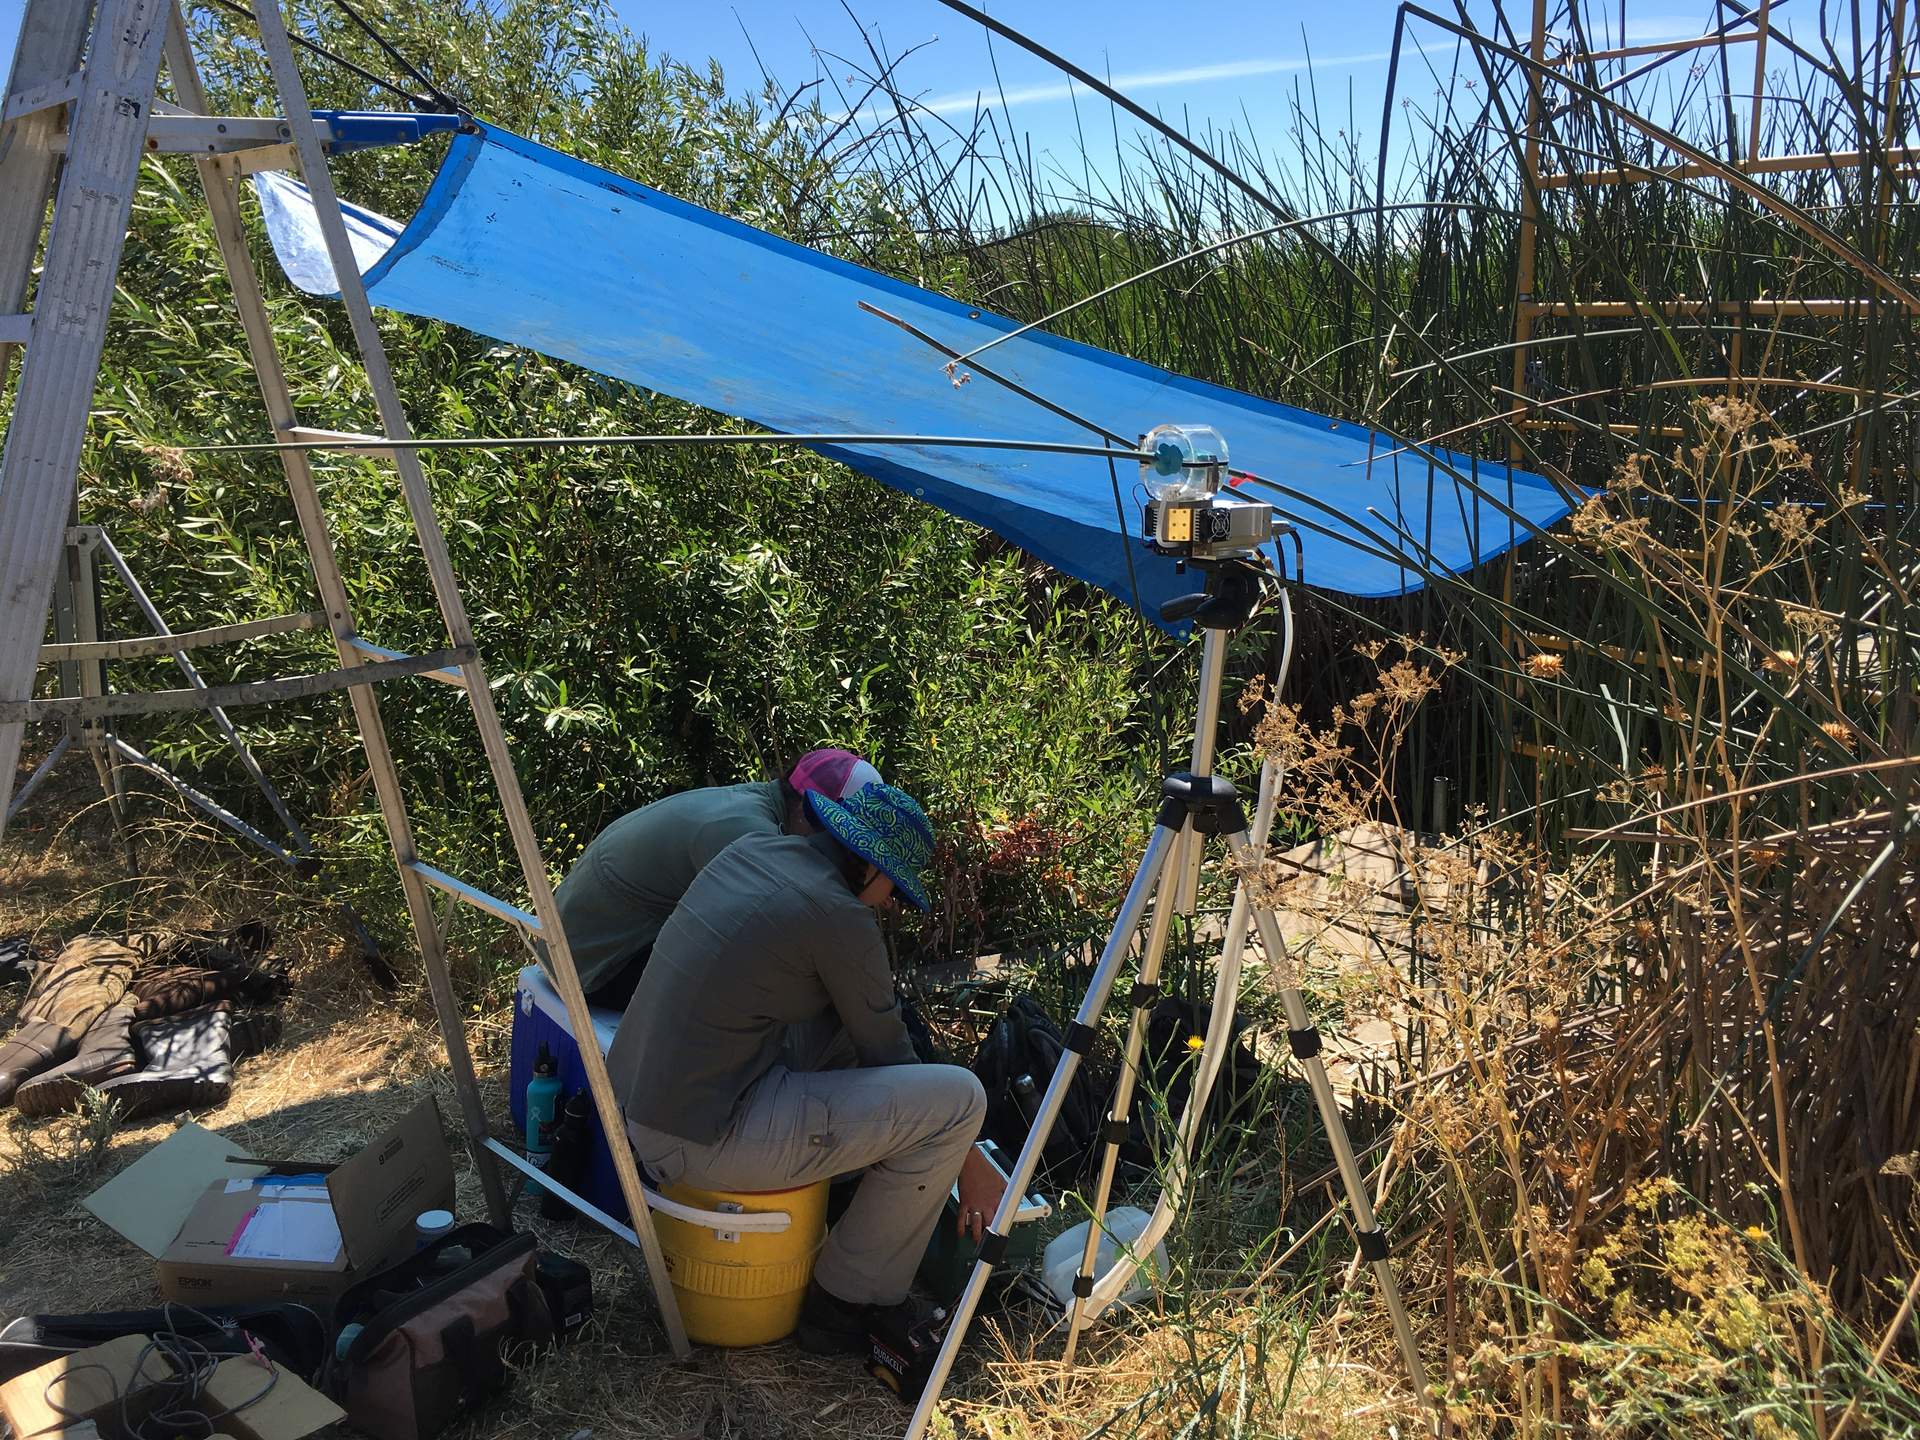
20180717WP_KatElkeLeafChamber.jpg ( 2018-07-17 15:24:14 ) Full size: 1920x1440
Katrina and Elke do leaf chamber work
8 sets found
Can't check WP_DO
1 WP_DO graphs found
14 WP_met graphs found
5 WP_flux graphs found
Can't check MBWPEESWGT_mixed
Can't check MBEEWPSWEPGT_cam
Can't check MBSWEEWPBCBA
1 WP_processed graphs found
No data found for WP_arable.