
Field Notes
<--2018-03-06 09:00:00 | 2018-03-27 10:30:00-->Other sites visited today: Vaira | Tonzi
Phenocam link: Searching...
Tonzi: 2018-03-06 10:30:00 (DOY 65)
Author: Joe Verfaillie
Others: Siyan
Summary: Downgraded LI-7550 boxes, swapped 7500 heads, still trying to get of Tower co2 profile to run, still trying to get tower computer to run, still trying to get well and zcam 3 to run.
| Tonzi 2018-03-06 I arrived about 10:30 with Siyan. It was super clear, sunny and warm with little to no wind. The Sierras were visible all the way out from the Delta and I could see Mt Diablo clearly from the Tower. Puddles on the road and the ground is damp. We saw a pickup with trailer and four wheeler head west on the road. Looked like the road has seen quite a bit of traffic recently. One mutant oak tree near Mr Tonzi’s old house is starting to put on leaves. I downgraded the firmware of the Tower 7550 sn AIU-1866 and Floor 7550 sn AIU-1869 from v8.7.5 to v8.5.0. This was to standardize our systems. All the Delta systems went back to v8.5.0 because of problems with extra junk columns showing up when a 7700 was connected in v8.7.5. Then swapped heads for calibration. Tower: sn 75H-2668 coming off and sn 0041 going up. Floor: sn 1594 coming off and sn 0042 going up. Tower: V8.7.5 2668: 410ppm CO2, 331mmol/m3 H2O, 14.4C, 99.8kPa, 101.3SS V8.5.0 2668: 410ppm CO2, 347mmol/m3 H2O, 14.5C, 99.7kPa, 101.3SS V8.5.0 0041: 412ppm CO2, 290mmol/m3 H2O, 13.8C, 99.7kPa, 100.7SS Floor: V8.7.5 1594: 408ppm CO2, 330mmol/m3 H2O, 17.9C, 99.8kPa, 103.2SS V8.5.0 1594: 408ppm CO2, 308mmol/m3 H2O, 17.6C, 99.8kPa, 103.3SS V8.5.0 0042: 409ppm CO2, 306mmol/m3 H2O, 17.9C, 99.8kPa, 99.5SS I check clocks and columns and all seemed well. There seems to be a drop of about 30mmol/m3 in H2O related to the change from v8.7.5 to v8.5.0. I have seen something similar in the Delta sites. Hard to tell if it is real and should be countered by calibrations. I tried to fix the old Tower co2 profile by swapping out the CR10X silver box: sn 47253 went in and sn 20138 came off. After reloading the program it seemed to be function although I did not check the final storage data. The LI-820 was give bad readings. I cleaned the path and was able to calibrate it, but the values still seem to bounce around +-20ppm which is more than normal I think. I added a modem to the LattePanda but there was no power. The plugable terminal where the power converter was plugged in had no voltage as did the two empty connectors downstream. Maybe a wire broke but that seems odd. I connected the power converter to the black screw terminal and it seemed to power up with only the positive lead connected. There must be a ground somewhere upstream. Unplugging the serial line to the co2 profile system seemed to remove the ground. Still, the power converter was getting really hot and browned out. It’s supposed to be to handle 3A and the solar charge controller was only showing about 0.5A at 24V with the screen and LattePanda on. I’m not sure what’s happening here but I unplugged things until I do some testing in the lab. Z-cam 3 connected to the CR200 still didn’t take any photos. I might be toggling a control port instead of the SW12V port. But might be good to have a CR10X ready to swap in next time. |
Field Data
No tank data
Well Depth
| Date | Location | Depth (feet) |
|---|---|---|
| 2018-03-06 | TZ_floor | 27 |
| 2018-03-06 | TZ_road | 36.3 |
| 2018-03-06 | TZ_tower | 31.4 |
| 2018-03-06 | VR_pond | 19.44 |
mode = both
Moisture Point Probes TZ
Array
(
[0] => Tower_1
[1] => Floor_South_1
[2] => Floor_East_1
[3] => Floor_West_1
[4] => Soil_Transect_4_1
[5] => Soil_Transect_3_1
[6] => Soil_Transect_2_1
[7] => Soil_Transect_1_1
[8] => SoilCO2_West_A_1
[9] => SoilCO2_West_B_1
[10] => SoilCO2_West_C_1
[11] => Tower_2
[12] => Floor_South_2
[13] => Floor_East_2
[14] => Floor_West_2
[15] => Soil_Transect_4_2
[16] => Soil_Transect_3_2
[17] => Soil_Transect_2_2
[18] => Soil_Transect_1_2
[19] => SoilCO2_West_A_2
[20] => SoilCO2_West_B_2
[21] => SoilCO2_West_C_2
[22] => Tower_3
[23] => Floor_South_3
[24] => Floor_East_3
[25] => Floor_West_3
[26] => Soil_Transect_4_3
[27] => Soil_Transect_3_3
[28] => Soil_Transect_2_3
[29] => Soil_Transect_1_3
[30] => SoilCO2_West_A_3
[31] => SoilCO2_West_B_3
[32] => SoilCO2_West_C_3
[33] => Tower_4
[34] => Floor_South_4
[35] => Floor_East_4
[36] => Floor_West_4
[37] => Soil_Transect_4_4
[38] => Soil_Transect_3_4
[39] => Soil_Transect_2_4
[40] => Soil_Transect_1_4
[41] => SoilCO2_West_A_4
[42] => SoilCO2_West_B_4
[43] => SoilCO2_West_C_4
)
| Date | DOY | Rep | Depth | Tower_1 |
Floor_South_1 |
Floor_East_1 |
Floor_West_1 |
Soil_Transect_4_1 |
Soil_Transect_3_1 |
Soil_Transect_2_1 |
Soil_Transect_1_1 |
SoilCO2_West_A_1 |
SoilCO2_West_B_1 |
SoilCO2_West_C_1 |
Tower_2 |
Floor_South_2 |
Floor_East_2 |
Floor_West_2 |
Soil_Transect_4_2 |
Soil_Transect_3_2 |
Soil_Transect_2_2 |
Soil_Transect_1_2 |
SoilCO2_West_A_2 |
SoilCO2_West_B_2 |
SoilCO2_West_C_2 |
Tower_3 |
Floor_South_3 |
Floor_East_3 |
Floor_West_3 |
Soil_Transect_4_3 |
Soil_Transect_3_3 |
Soil_Transect_2_3 |
Soil_Transect_1_3 |
SoilCO2_West_A_3 |
SoilCO2_West_B_3 |
SoilCO2_West_C_3 |
Tower_4 |
Floor_South_4 |
Floor_East_4 |
Floor_West_4 |
Soil_Transect_4_4 |
Soil_Transect_3_4 |
Soil_Transect_2_4 |
Soil_Transect_1_4 |
SoilCO2_West_A_4 |
SoilCO2_West_B_4 |
SoilCO2_West_C_4 |
Avg | Spacial Count |
Measurement Count |
|---|---|---|---|---|---|---|---|---|---|---|---|---|---|---|---|---|---|---|---|---|---|---|---|---|---|---|---|---|---|---|---|---|---|---|---|---|---|---|---|---|---|---|---|---|---|---|---|---|---|---|
| 2018-03-06 | 65 | 0 | nan | 44.9 | 30.8 | 43.7 | 42.8 | 29.4 | 28.8 | 24.7 | 21.2 | 32.6 | 29.4 | 28.3 | 41.1 | 43.6 | 36.8 | 38.7 | 37.8 | 33.2 | 33.2 | 26.5 | 31.9 | 35.9 | 34.7 | 36.6 | 41.3 | 40.5 | 39.6 | 34.9 | 33.5 | 32.9 | 35.2 | 36.3 | 38.8 | 38.8 | 41.4 | 52.9 | 52.8 | 44.3 | 34.8 | 44.3 | 46.6 | 39.4 | 44.5 | 59.3 | 46.8 | |||
| 2018-03-06 | 65 | 1 | nan | 44 | 24.1 | 44.6 | 43.7 | 29.7 | 25 | 25.8 | 21.4 | 34.3 | 30.2 | 28.5 | 41.7 | 44.2 | 35.9 | 33.2 | 38.4 | 335 | 33.5 | 26.1 | 31.9 | 35.9 | 34.1 | 37.1 | 39.9 | 39.4 | 39.9 | 35.7 | 32.4 | 34.1 | 36.6 | 37.1 | 37.1 | 37.1 | 40 | 54.6 | 54.6 | 45.7 | 35.1 | 45.1 | 46.3 | 38.5 | 44.5 | 50 | 50.6 | |||
| 2018-03-06 | 65 | Avg | 0-15cm | 0 | 0 | |||||||||||||||||||||||||||||||||||||||||||||
| 2018-03-06 | 65 | Avg | 15-30cm | 0 | 0 | |||||||||||||||||||||||||||||||||||||||||||||
| 2018-03-06 | 65 | Avg | 30-45cm | 0 | 0 | |||||||||||||||||||||||||||||||||||||||||||||
| 2018-03-06 | 65 | Avg | 45-60cm | 0 | 0 |
mode = both
Moisture Point Probes VR
Array
(
[0] => Solar_Panels_1
[1] => Flux_Tower_1
[2] => Gate_1
[3] => Biomass_Cage_1
[4] => Solar_Panels_2
[5] => Flux_Tower_2
[6] => Gate_2
[7] => Biomass_Cage_2
[8] => Solar_Panels_3
[9] => Flux_Tower_3
[10] => Gate_3
[11] => Biomass_Cage_3
[12] => Solar_Panels_4
[13] => Flux_Tower_4
[14] => Gate_4
[15] => Biomass_Cage_4
)
| Date | DOY | Rep | Depth | Solar_Panels_1 |
Flux_Tower_1 |
Gate_1 |
Biomass_Cage_1 |
Solar_Panels_2 |
Flux_Tower_2 |
Gate_2 |
Biomass_Cage_2 |
Solar_Panels_3 |
Flux_Tower_3 |
Gate_3 |
Biomass_Cage_3 |
Solar_Panels_4 |
Flux_Tower_4 |
Gate_4 |
Biomass_Cage_4 |
Avg | Spacial Count |
Measurement Count |
|---|---|---|---|---|---|---|---|---|---|---|---|---|---|---|---|---|---|---|---|---|---|---|
| 2018-03-06 | 65 | 0 | nan | 26.4 | 2.4 | 27.6 | 14.7 | 28.9 | 30.4 | 24.6 | 24 | 31.5 | 16.2 | 23.2 | 31.5 | 41.7 | 29.7 | 23.9 | 33.1 | |||
| 2018-03-06 | 65 | 1 | nan | 28.5 | 21.4 | 27.6 | 15.9 | 29.2 | 30.7 | 24.6 | 23.4 | 31.3 | 16.2 | 23.7 | 31 | 42 | 29.4 | 24.8 | 32.8 | |||
| 2018-03-06 | 65 | Avg | 0-15cm | 0 | 0 | |||||||||||||||||
| 2018-03-06 | 65 | Avg | 15-30cm | 0 | 0 | |||||||||||||||||
| 2018-03-06 | 65 | Avg | 30-45cm | 0 | 0 | |||||||||||||||||
| 2018-03-06 | 65 | Avg | 45-60cm | 0 | 0 |
No TZ grass heigth found
No VR grass heigth found
Tree DBH
| Date | Tag# | Reading (mm) |
|---|---|---|
| 2018-03-06 | 1 | 15.1 |
| 2018-03-06 | 102 | 9.6 |
| 2018-03-06 | 2 | 21.6 |
| 2018-03-06 | 245 | 9.0 |
| 2018-03-06 | 3 | 15.1 |
| 2018-03-06 | 4 | 7.8 |
| 2018-03-06 | 5 | 6.6 |
| 2018-03-06 | 7 | 20.4 |
| 2018-03-06 | 72 | 11.9 |
| 2018-03-06 | 79 | 11.0 |
| 2018-03-06 | 8 | 23.5 |
No water potential data found
No TZ Grass Biomass data found
No TZ OakLeaves Biomass data found
No TZ PineNeedles Biomass data found
2 photos found
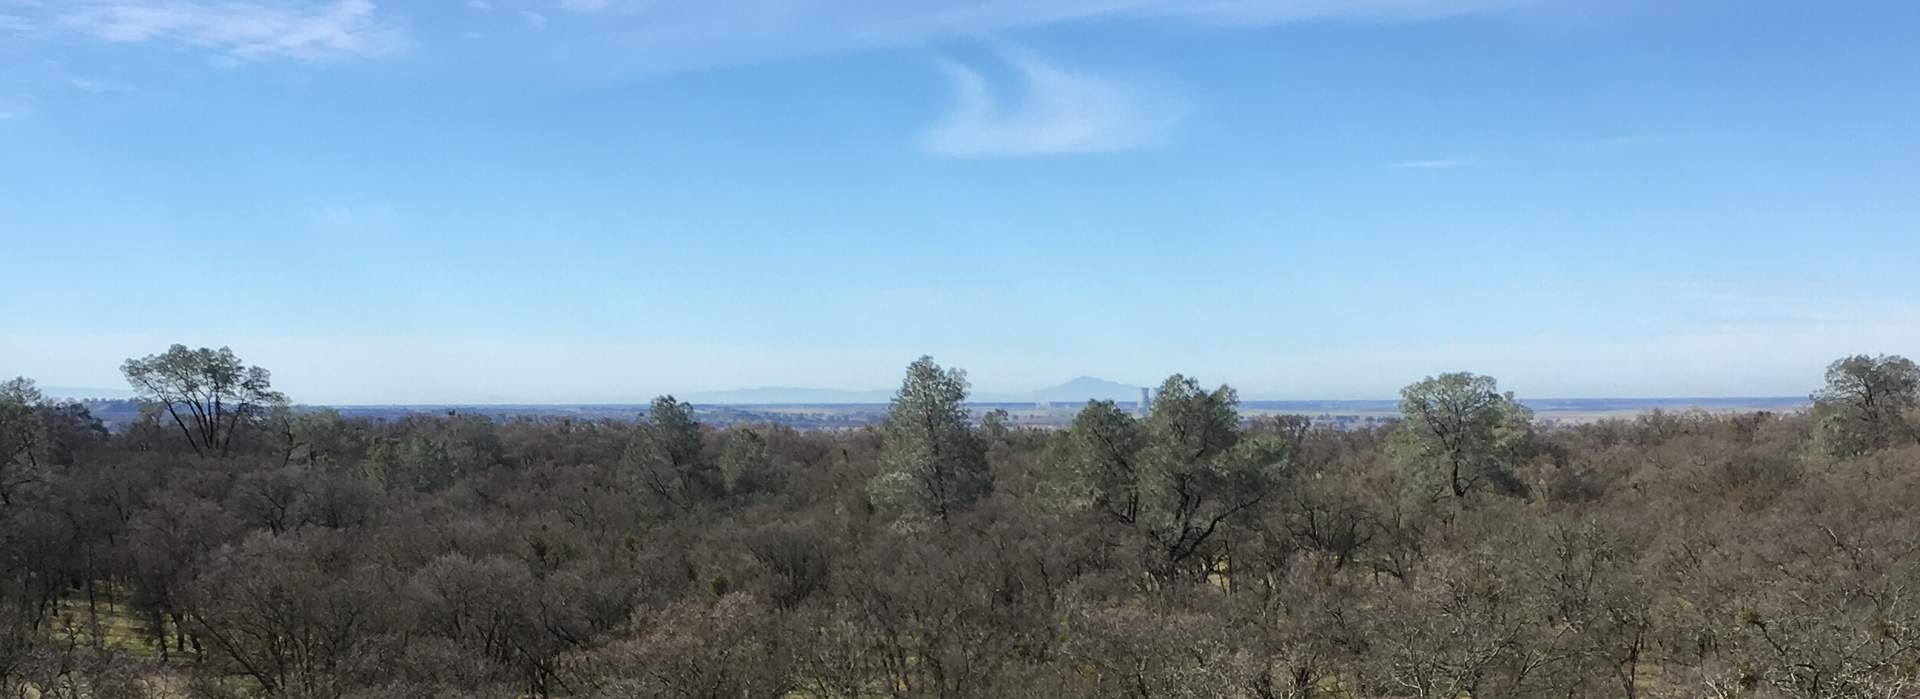
20180306TZ_SecoDiablo.jpg ( 2018-03-06 10:43:17 ) Full size: 1920x699
Rancho Seco and Mt. Diablo visible from the Tonzi tower
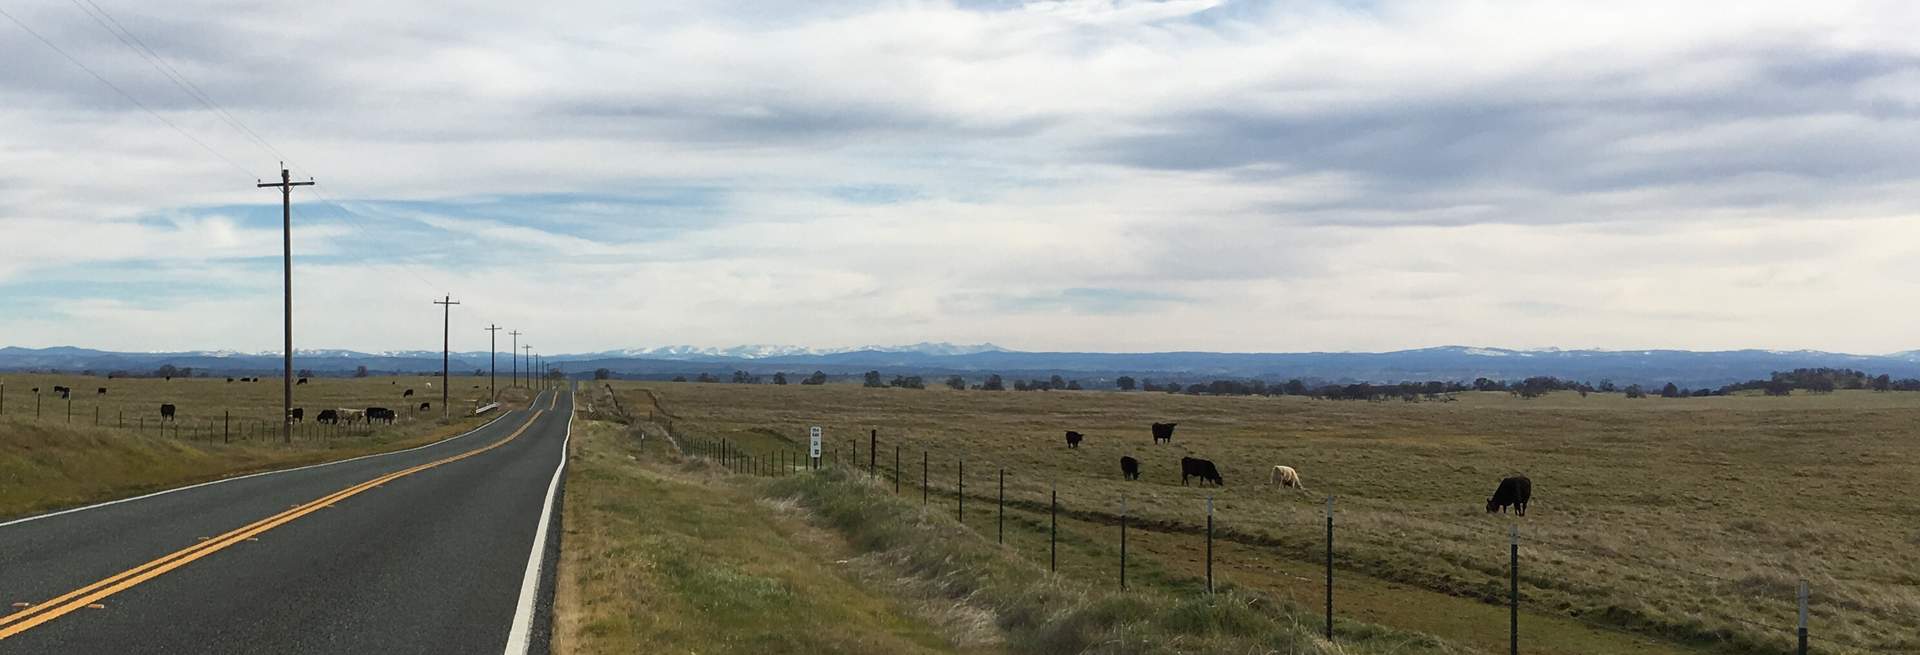
20180306TZ_Sierras.jpg ( 2018-03-06 08:52:41 ) Full size: 1920x655
The Sierras were visible all the way out from the Delta
16 sets found
No data found for TZ_Fenergy.
11 TZ_tmet graphs found
11 TZ_soilco2 graphs found
Can't check TZ_mixed
3 TZ_mixed graphs found
1 TZ_fflux graphs found
8 TZ_fmet graphs found
No data found for TZ_tram.
3 TZ_co2prof graphs found
1 TZ_irt graphs found
No data found for TZ_windprof.
1 TZ_tflux graphs found
2 TZ_sm graphs found
Can't check TZ_met
1 TZ_met graphs found
Can't check TZVR_mixed
8 TZ_osu graphs found
No data found for TZ_fd.
Tonzi Z-cam data