
Field Notes
<--2018-02-28 11:00:00 | 2018-03-06 10:30:00-->Other sites visited today: Vaira | Tonzi
Phenocam link: Searching...
Tonzi: 2018-03-06 09:00:00 (DOY 65)
Author: Siyan Ma
Others: Joe
Summary: Standard fieldwork, clip plots, swapped 7500 heads
|
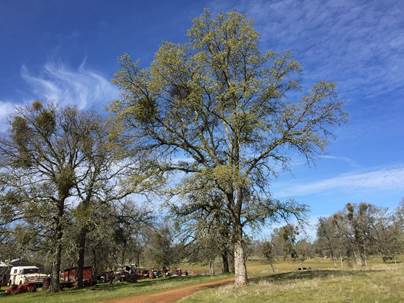
When: Date: 3/6/2018 , Day: 65 , Watch Time: 9:00 am . Where: Tonzi/Vaira Ranch Who: Siyan, Joe Weather: clear, sunny Phenology: The oak tree in front of Mr.Tonzi's house just puts on leaves. At Vaira, the small pond by the side of the road is full. Grasses at Vaira looks greener and bigger than those at Tonzi.
Summary
Vaira_Grass Site
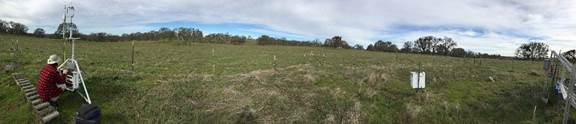
Tonzi_Tower Site
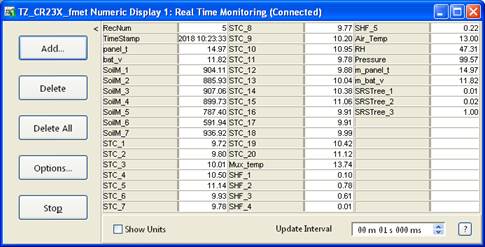
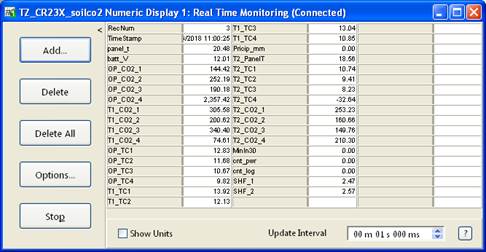
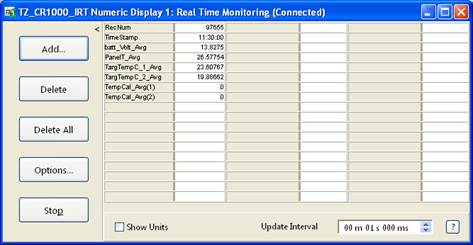
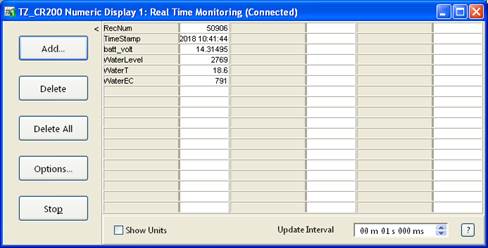
6. Screens of met dataloggers: CR23X3 floor-Met & soil moisture CR1000 tower-Met Soil CO2 profile: CR23X5 soil CO2 profile
8. closed gate and set up fence. YES! Toniz_Floor Site
|
Field Data
No tank data
Well Depth
| Date | Location | Depth (feet) |
|---|---|---|
| 2018-03-06 | TZ_floor | 27 |
| 2018-03-06 | TZ_road | 36.3 |
| 2018-03-06 | TZ_tower | 31.4 |
| 2018-03-06 | VR_pond | 19.44 |
mode = both
Moisture Point Probes TZ
Array
(
[0] => Tower_1
[1] => Floor_South_1
[2] => Floor_East_1
[3] => Floor_West_1
[4] => Soil_Transect_4_1
[5] => Soil_Transect_3_1
[6] => Soil_Transect_2_1
[7] => Soil_Transect_1_1
[8] => SoilCO2_West_A_1
[9] => SoilCO2_West_B_1
[10] => SoilCO2_West_C_1
[11] => Tower_2
[12] => Floor_South_2
[13] => Floor_East_2
[14] => Floor_West_2
[15] => Soil_Transect_4_2
[16] => Soil_Transect_3_2
[17] => Soil_Transect_2_2
[18] => Soil_Transect_1_2
[19] => SoilCO2_West_A_2
[20] => SoilCO2_West_B_2
[21] => SoilCO2_West_C_2
[22] => Tower_3
[23] => Floor_South_3
[24] => Floor_East_3
[25] => Floor_West_3
[26] => Soil_Transect_4_3
[27] => Soil_Transect_3_3
[28] => Soil_Transect_2_3
[29] => Soil_Transect_1_3
[30] => SoilCO2_West_A_3
[31] => SoilCO2_West_B_3
[32] => SoilCO2_West_C_3
[33] => Tower_4
[34] => Floor_South_4
[35] => Floor_East_4
[36] => Floor_West_4
[37] => Soil_Transect_4_4
[38] => Soil_Transect_3_4
[39] => Soil_Transect_2_4
[40] => Soil_Transect_1_4
[41] => SoilCO2_West_A_4
[42] => SoilCO2_West_B_4
[43] => SoilCO2_West_C_4
)
| Date | DOY | Rep | Depth | Tower_1 |
Floor_South_1 |
Floor_East_1 |
Floor_West_1 |
Soil_Transect_4_1 |
Soil_Transect_3_1 |
Soil_Transect_2_1 |
Soil_Transect_1_1 |
SoilCO2_West_A_1 |
SoilCO2_West_B_1 |
SoilCO2_West_C_1 |
Tower_2 |
Floor_South_2 |
Floor_East_2 |
Floor_West_2 |
Soil_Transect_4_2 |
Soil_Transect_3_2 |
Soil_Transect_2_2 |
Soil_Transect_1_2 |
SoilCO2_West_A_2 |
SoilCO2_West_B_2 |
SoilCO2_West_C_2 |
Tower_3 |
Floor_South_3 |
Floor_East_3 |
Floor_West_3 |
Soil_Transect_4_3 |
Soil_Transect_3_3 |
Soil_Transect_2_3 |
Soil_Transect_1_3 |
SoilCO2_West_A_3 |
SoilCO2_West_B_3 |
SoilCO2_West_C_3 |
Tower_4 |
Floor_South_4 |
Floor_East_4 |
Floor_West_4 |
Soil_Transect_4_4 |
Soil_Transect_3_4 |
Soil_Transect_2_4 |
Soil_Transect_1_4 |
SoilCO2_West_A_4 |
SoilCO2_West_B_4 |
SoilCO2_West_C_4 |
Avg | Spacial Count |
Measurement Count |
|---|---|---|---|---|---|---|---|---|---|---|---|---|---|---|---|---|---|---|---|---|---|---|---|---|---|---|---|---|---|---|---|---|---|---|---|---|---|---|---|---|---|---|---|---|---|---|---|---|---|---|
| 2018-03-06 | 65 | 0 | nan | 44.9 | 30.8 | 43.7 | 42.8 | 29.4 | 28.8 | 24.7 | 21.2 | 32.6 | 29.4 | 28.3 | 41.1 | 43.6 | 36.8 | 38.7 | 37.8 | 33.2 | 33.2 | 26.5 | 31.9 | 35.9 | 34.7 | 36.6 | 41.3 | 40.5 | 39.6 | 34.9 | 33.5 | 32.9 | 35.2 | 36.3 | 38.8 | 38.8 | 41.4 | 52.9 | 52.8 | 44.3 | 34.8 | 44.3 | 46.6 | 39.4 | 44.5 | 59.3 | 46.8 | |||
| 2018-03-06 | 65 | 1 | nan | 44 | 24.1 | 44.6 | 43.7 | 29.7 | 25 | 25.8 | 21.4 | 34.3 | 30.2 | 28.5 | 41.7 | 44.2 | 35.9 | 33.2 | 38.4 | 335 | 33.5 | 26.1 | 31.9 | 35.9 | 34.1 | 37.1 | 39.9 | 39.4 | 39.9 | 35.7 | 32.4 | 34.1 | 36.6 | 37.1 | 37.1 | 37.1 | 40 | 54.6 | 54.6 | 45.7 | 35.1 | 45.1 | 46.3 | 38.5 | 44.5 | 50 | 50.6 | |||
| 2018-03-06 | 65 | Avg | 0-15cm | 0 | 0 | |||||||||||||||||||||||||||||||||||||||||||||
| 2018-03-06 | 65 | Avg | 15-30cm | 0 | 0 | |||||||||||||||||||||||||||||||||||||||||||||
| 2018-03-06 | 65 | Avg | 30-45cm | 0 | 0 | |||||||||||||||||||||||||||||||||||||||||||||
| 2018-03-06 | 65 | Avg | 45-60cm | 0 | 0 |
mode = both
Moisture Point Probes VR
Array
(
[0] => Solar_Panels_1
[1] => Flux_Tower_1
[2] => Gate_1
[3] => Biomass_Cage_1
[4] => Solar_Panels_2
[5] => Flux_Tower_2
[6] => Gate_2
[7] => Biomass_Cage_2
[8] => Solar_Panels_3
[9] => Flux_Tower_3
[10] => Gate_3
[11] => Biomass_Cage_3
[12] => Solar_Panels_4
[13] => Flux_Tower_4
[14] => Gate_4
[15] => Biomass_Cage_4
)
| Date | DOY | Rep | Depth | Solar_Panels_1 |
Flux_Tower_1 |
Gate_1 |
Biomass_Cage_1 |
Solar_Panels_2 |
Flux_Tower_2 |
Gate_2 |
Biomass_Cage_2 |
Solar_Panels_3 |
Flux_Tower_3 |
Gate_3 |
Biomass_Cage_3 |
Solar_Panels_4 |
Flux_Tower_4 |
Gate_4 |
Biomass_Cage_4 |
Avg | Spacial Count |
Measurement Count |
|---|---|---|---|---|---|---|---|---|---|---|---|---|---|---|---|---|---|---|---|---|---|---|
| 2018-03-06 | 65 | 0 | nan | 26.4 | 2.4 | 27.6 | 14.7 | 28.9 | 30.4 | 24.6 | 24 | 31.5 | 16.2 | 23.2 | 31.5 | 41.7 | 29.7 | 23.9 | 33.1 | |||
| 2018-03-06 | 65 | 1 | nan | 28.5 | 21.4 | 27.6 | 15.9 | 29.2 | 30.7 | 24.6 | 23.4 | 31.3 | 16.2 | 23.7 | 31 | 42 | 29.4 | 24.8 | 32.8 | |||
| 2018-03-06 | 65 | Avg | 0-15cm | 0 | 0 | |||||||||||||||||
| 2018-03-06 | 65 | Avg | 15-30cm | 0 | 0 | |||||||||||||||||
| 2018-03-06 | 65 | Avg | 30-45cm | 0 | 0 | |||||||||||||||||
| 2018-03-06 | 65 | Avg | 45-60cm | 0 | 0 |
No TZ grass heigth found
No VR grass heigth found
Tree DBH
| Date | Tag# | Reading (mm) |
|---|---|---|
| 2018-03-06 | 1 | 15.1 |
| 2018-03-06 | 102 | 9.6 |
| 2018-03-06 | 2 | 21.6 |
| 2018-03-06 | 245 | 9.0 |
| 2018-03-06 | 3 | 15.1 |
| 2018-03-06 | 4 | 7.8 |
| 2018-03-06 | 5 | 6.6 |
| 2018-03-06 | 7 | 20.4 |
| 2018-03-06 | 72 | 11.9 |
| 2018-03-06 | 79 | 11.0 |
| 2018-03-06 | 8 | 23.5 |
No water potential data found
No TZ Grass Biomass data found
No TZ OakLeaves Biomass data found
No TZ PineNeedles Biomass data found
2 photos found
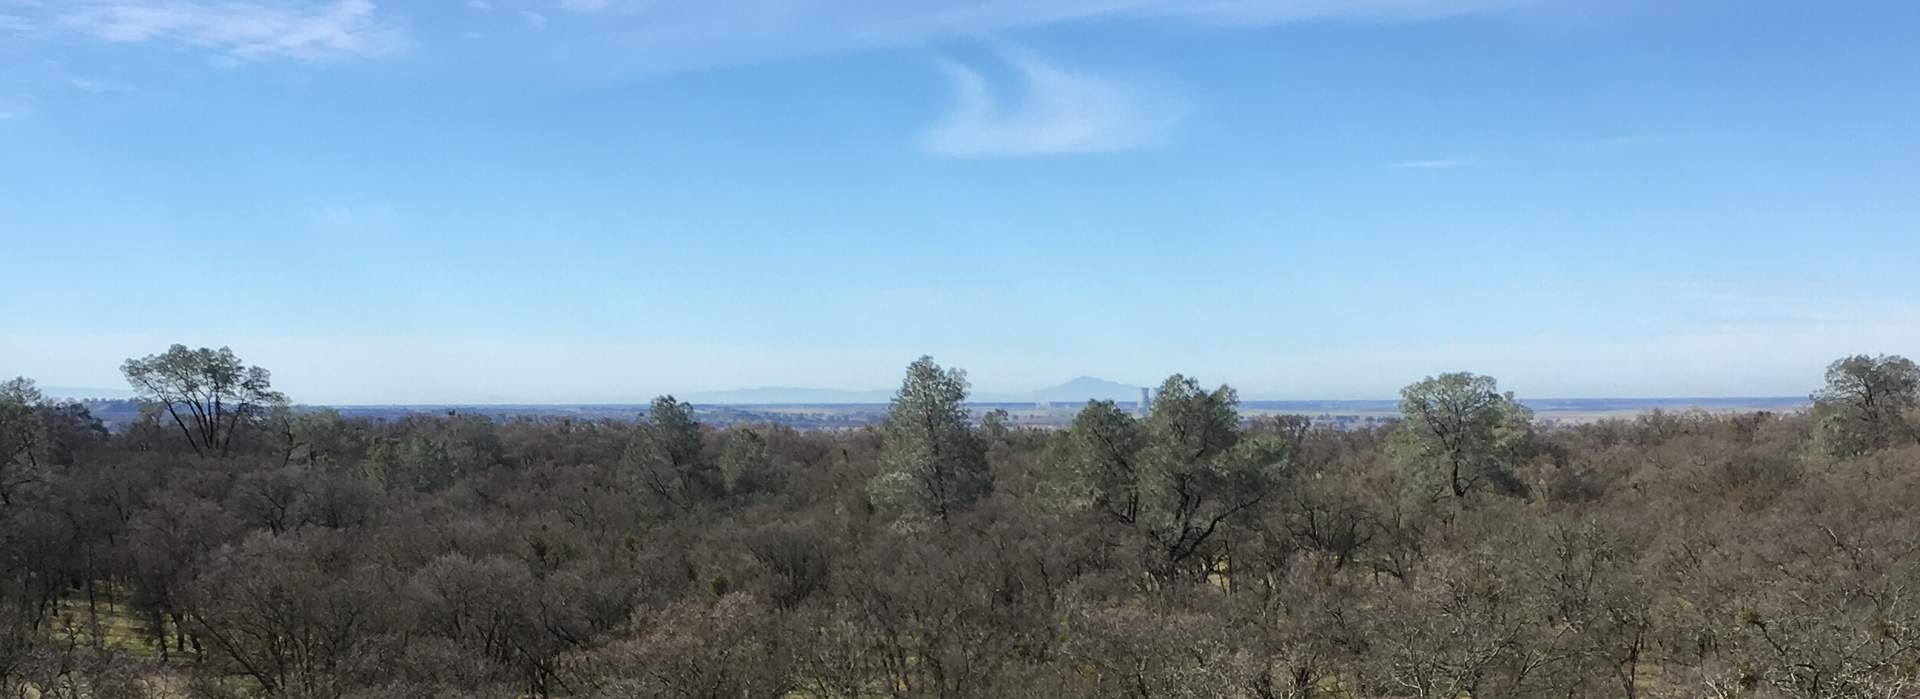
20180306TZ_SecoDiablo.jpg ( 2018-03-06 10:43:17 ) Full size: 1920x699
Rancho Seco and Mt. Diablo visible from the Tonzi tower
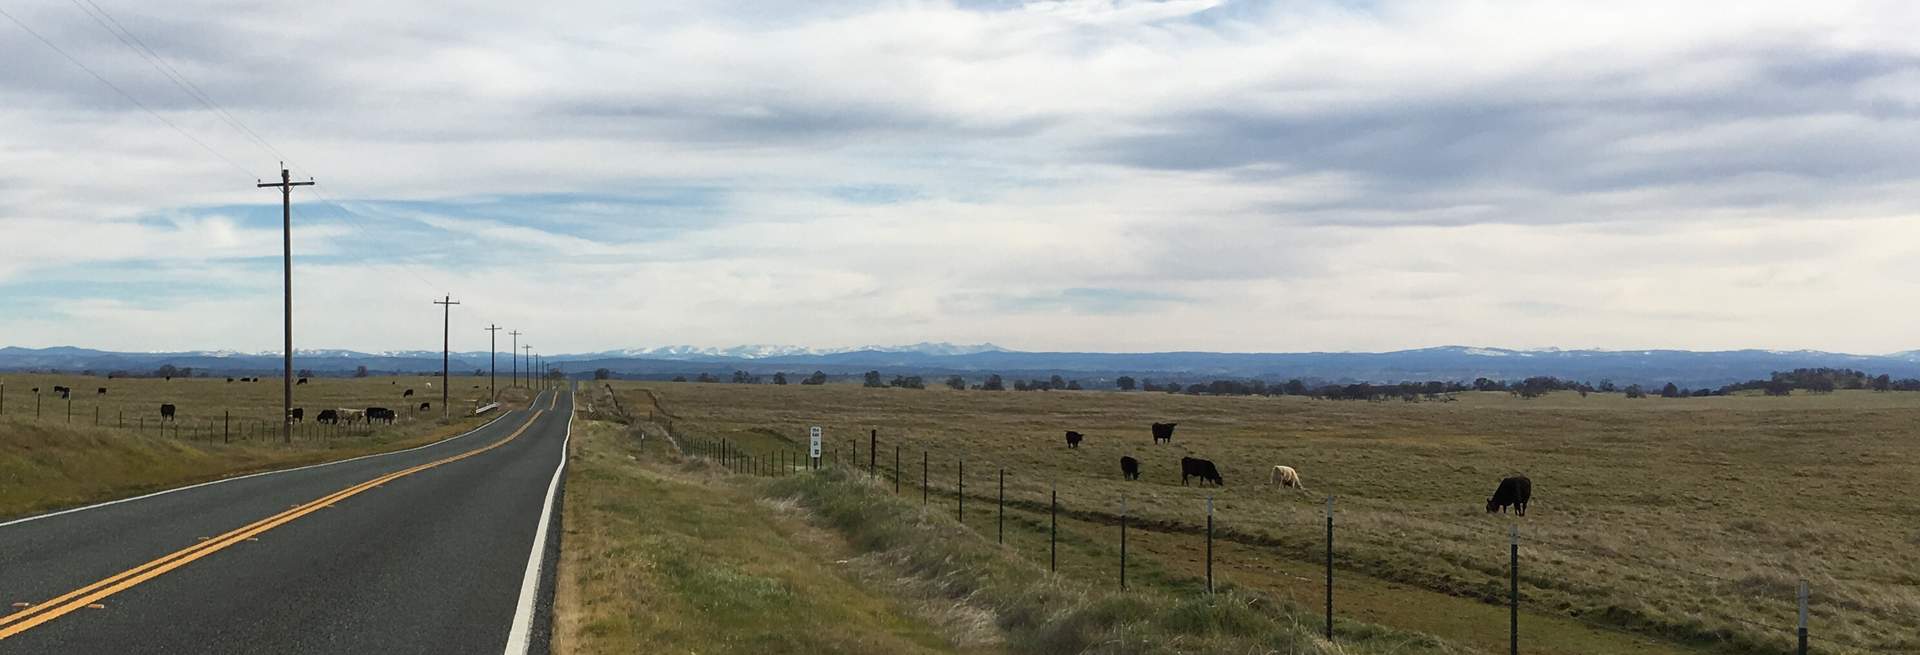
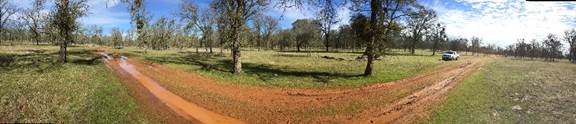
20180306TZ_Sierras.jpg ( 2018-03-06 08:52:41 ) Full size: 1920x655
The Sierras were visible all the way out from the Delta
16 sets found
No data found for TZ_Fenergy.
11 TZ_tmet graphs found
11 TZ_soilco2 graphs found
Can't check TZ_mixed
3 TZ_mixed graphs found
1 TZ_fflux graphs found
8 TZ_fmet graphs found
No data found for TZ_tram.
3 TZ_co2prof graphs found
1 TZ_irt graphs found
No data found for TZ_windprof.
1 TZ_tflux graphs found
2 TZ_sm graphs found
Can't check TZ_met
1 TZ_met graphs found
Can't check TZVR_mixed
8 TZ_osu graphs found
No data found for TZ_fd.
Tonzi Z-cam data