
Field Notes
<--2010-07-01 08:30:00 | 2010-07-14 09:30:00-->Phenocam link: Searching...
Sherman Island: 2010-07-08 12:30:00 (DOY 189)
Author: Joe Verfaillie
Others: Dennis, Beniamino
| Sherman
7/8/2010 Arrived with Dennis and Beniamino about 12:30pm. Warm, clear, sunny and windy. The pepper weed flowers continue to die, though still and few white ones here and there. All was running. Installed the LI7700, swapped the card on the CR1000 and uploaded the program to record the LI7700 channels. Calibrated the LGR: 1.976ppm CH4, 700psi, last cal May 28. Pre 11:43, 29.82C, 156.6Torr, 15.826usec, 1Hz, 1.971+-0.001ppm Post 1.976+-0.001 LGR reading before leaveing 11:59, 29.65C, 135.41Torr, 15.79usec, 10Hz, 1.847ppm Noticed that Soil CO2 #2 was not reporting. Check the LCD display it was reading 3.48% Went to the old levee site to pull guy anchors and rebar. |
12 photos found
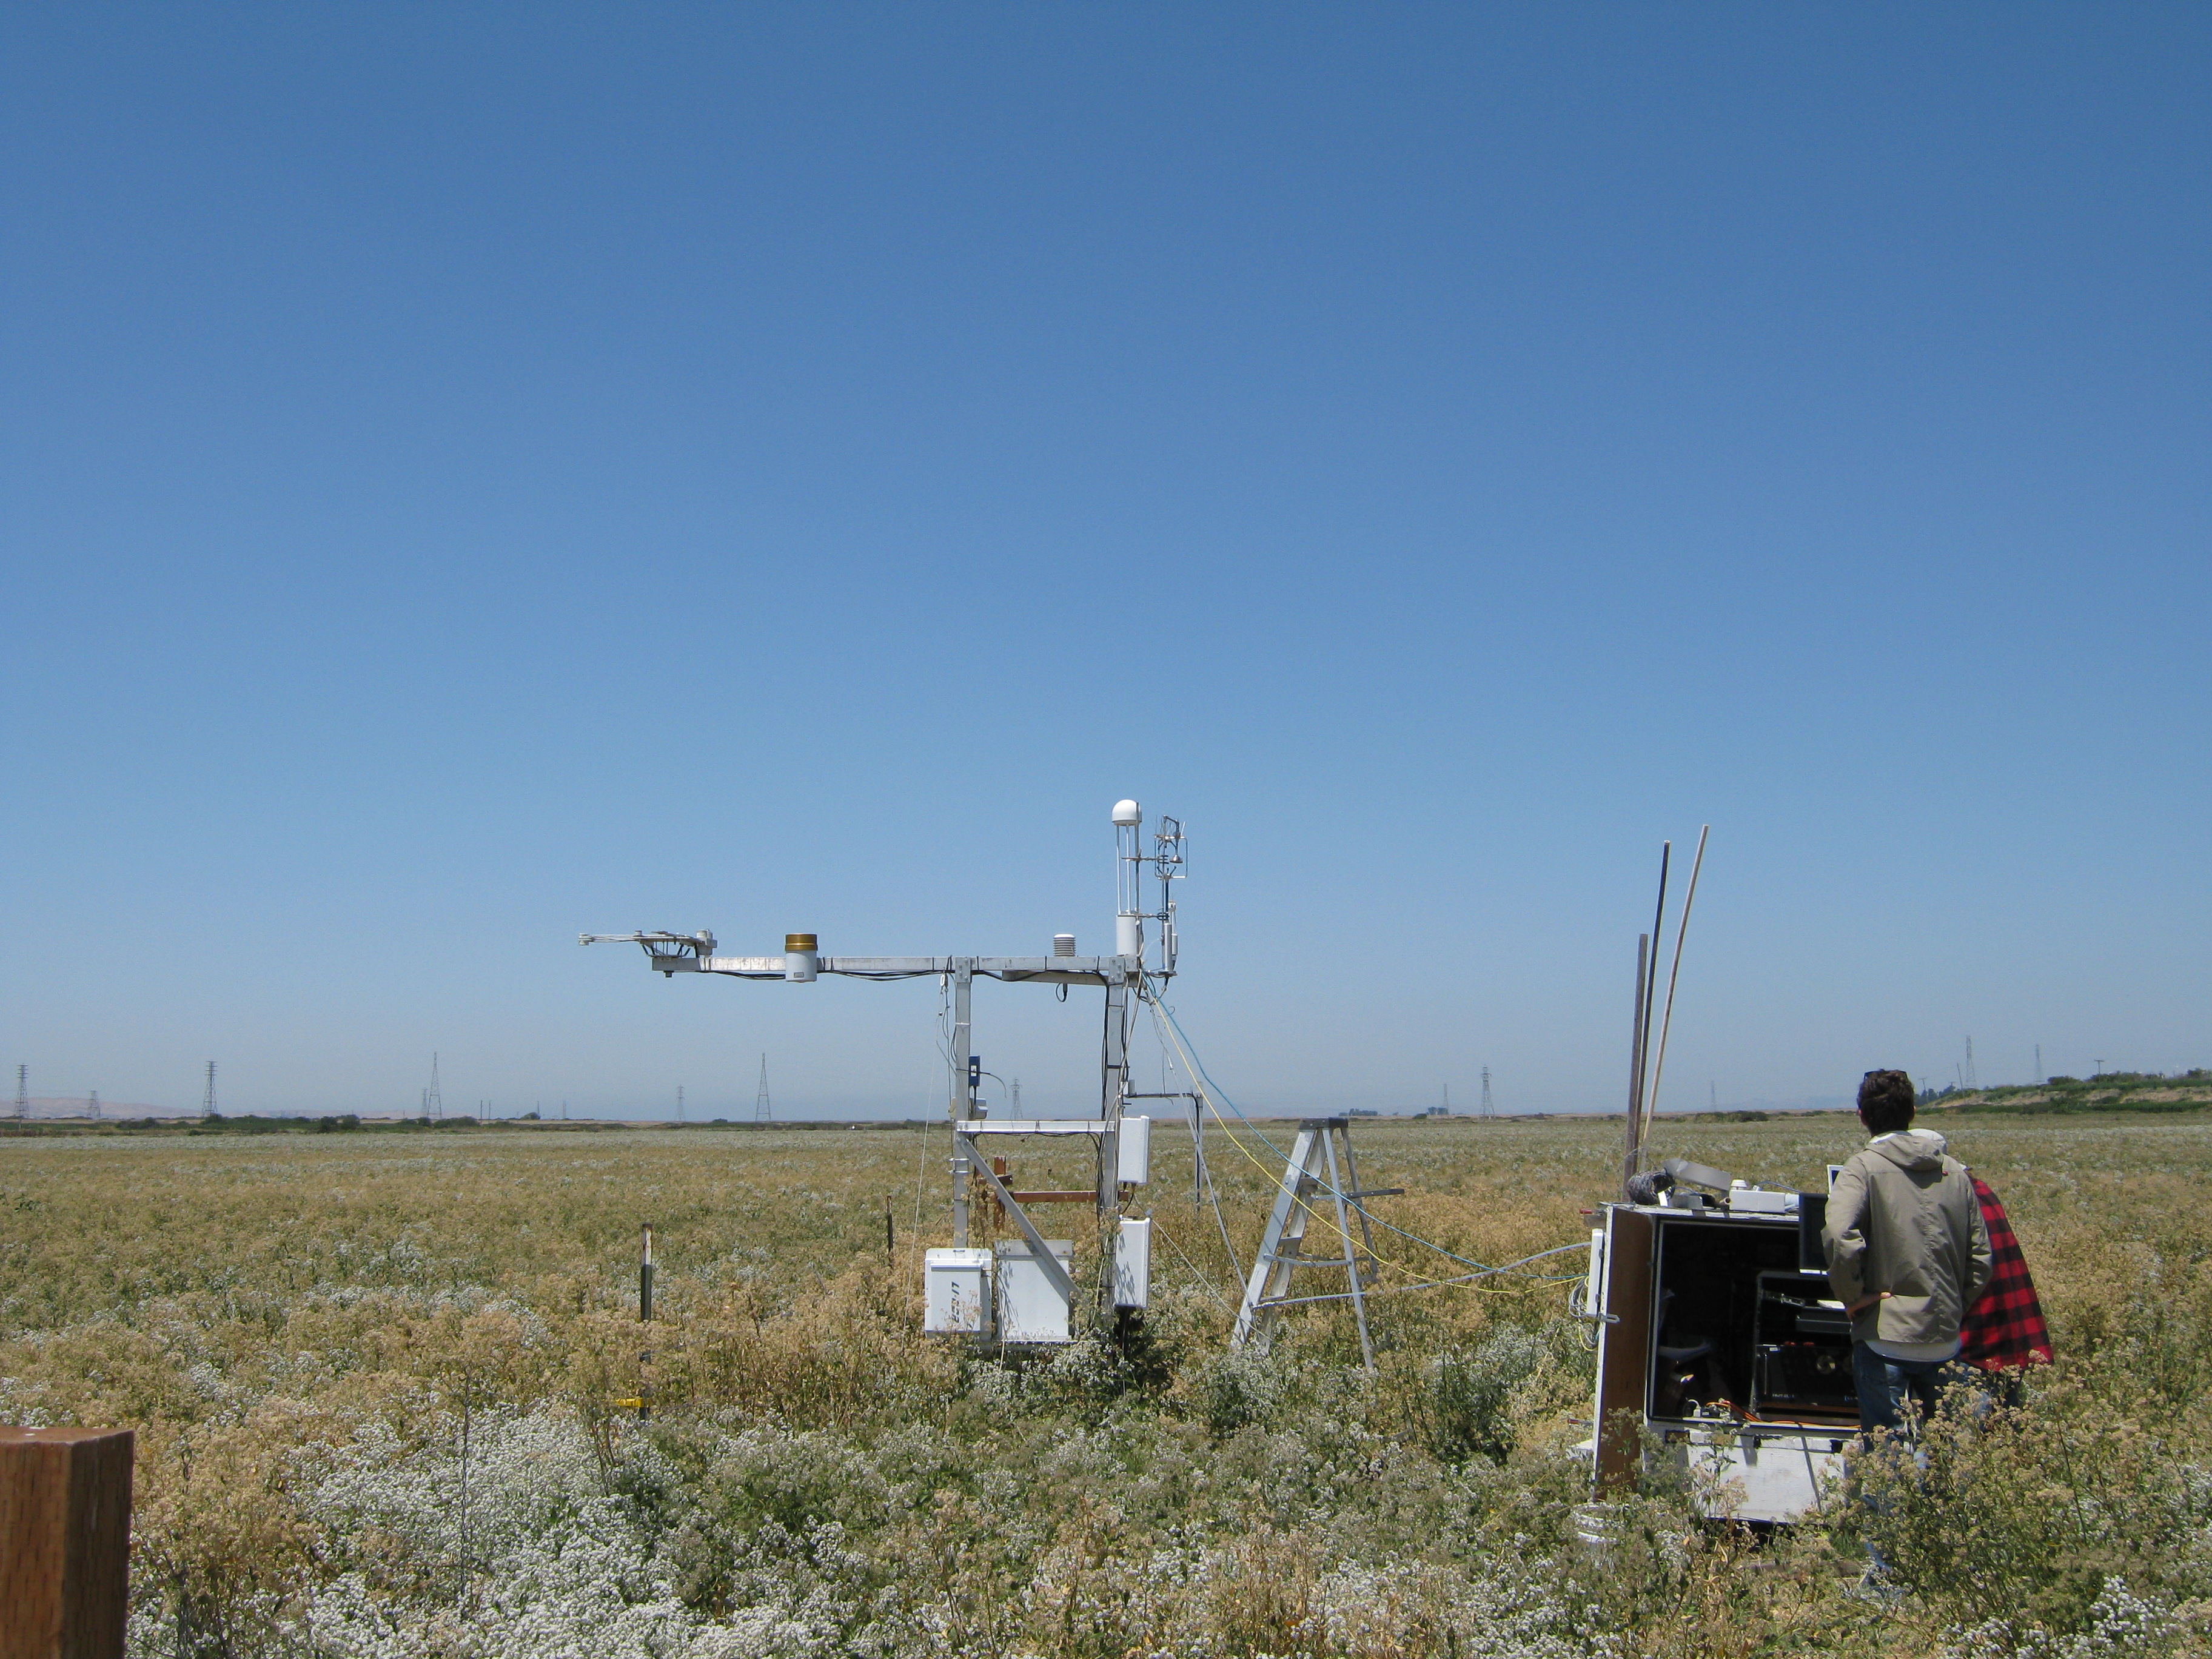
20100708SI_TowerBoxBJ.jpg ( 2010-07-08 12:23:46 ) Full size: 3648x2736
Beniamino and Joe at the tower.
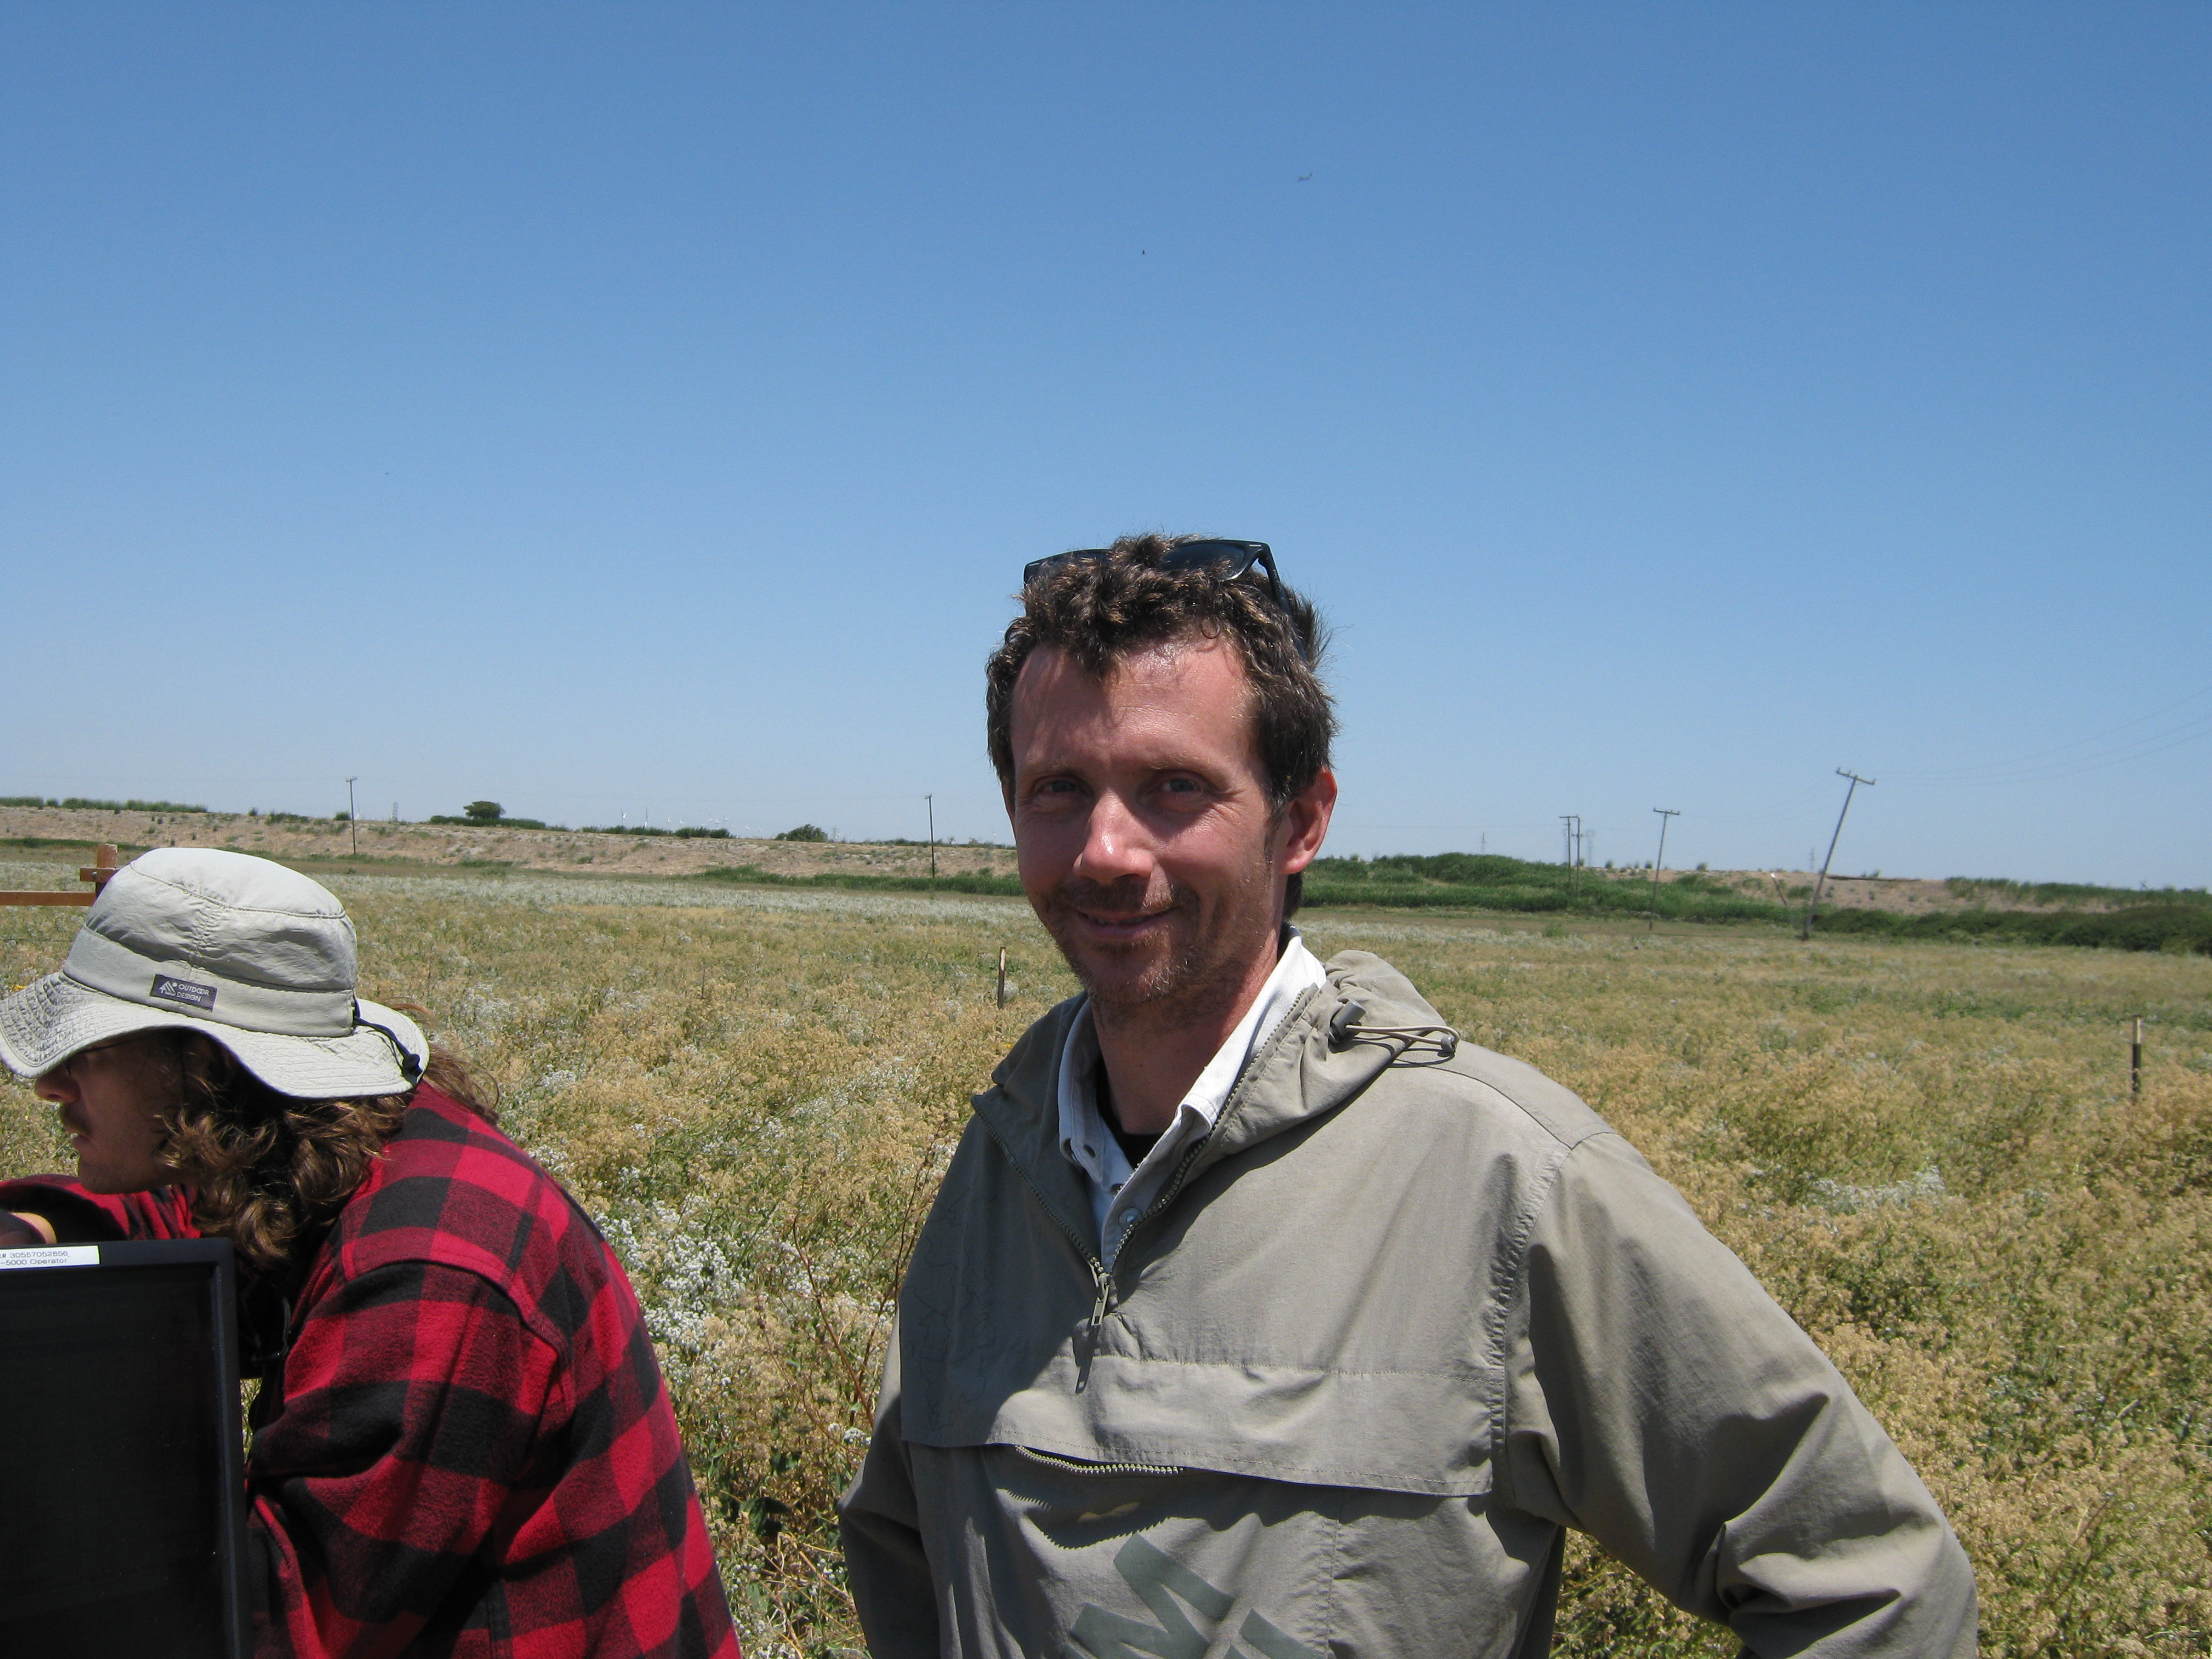
20100708SI_BeniaminoJoe1.jpg ( 2010-07-08 12:23:58 ) Full size: 3648x2736
Joe and Beniamino at Sherman Pasture field site

20100708SI_LI7700Tower1.jpg ( 2010-07-08 12:24:12 ) Full size: 3648x2736
Sherman Pasture eddy tower
20100708SI_LI7700Tower2.jpg ( 2010-07-08 12:24:24 ) Full size: 3648x2736
Sherman pasture eddy tower with Mt Diablo in background

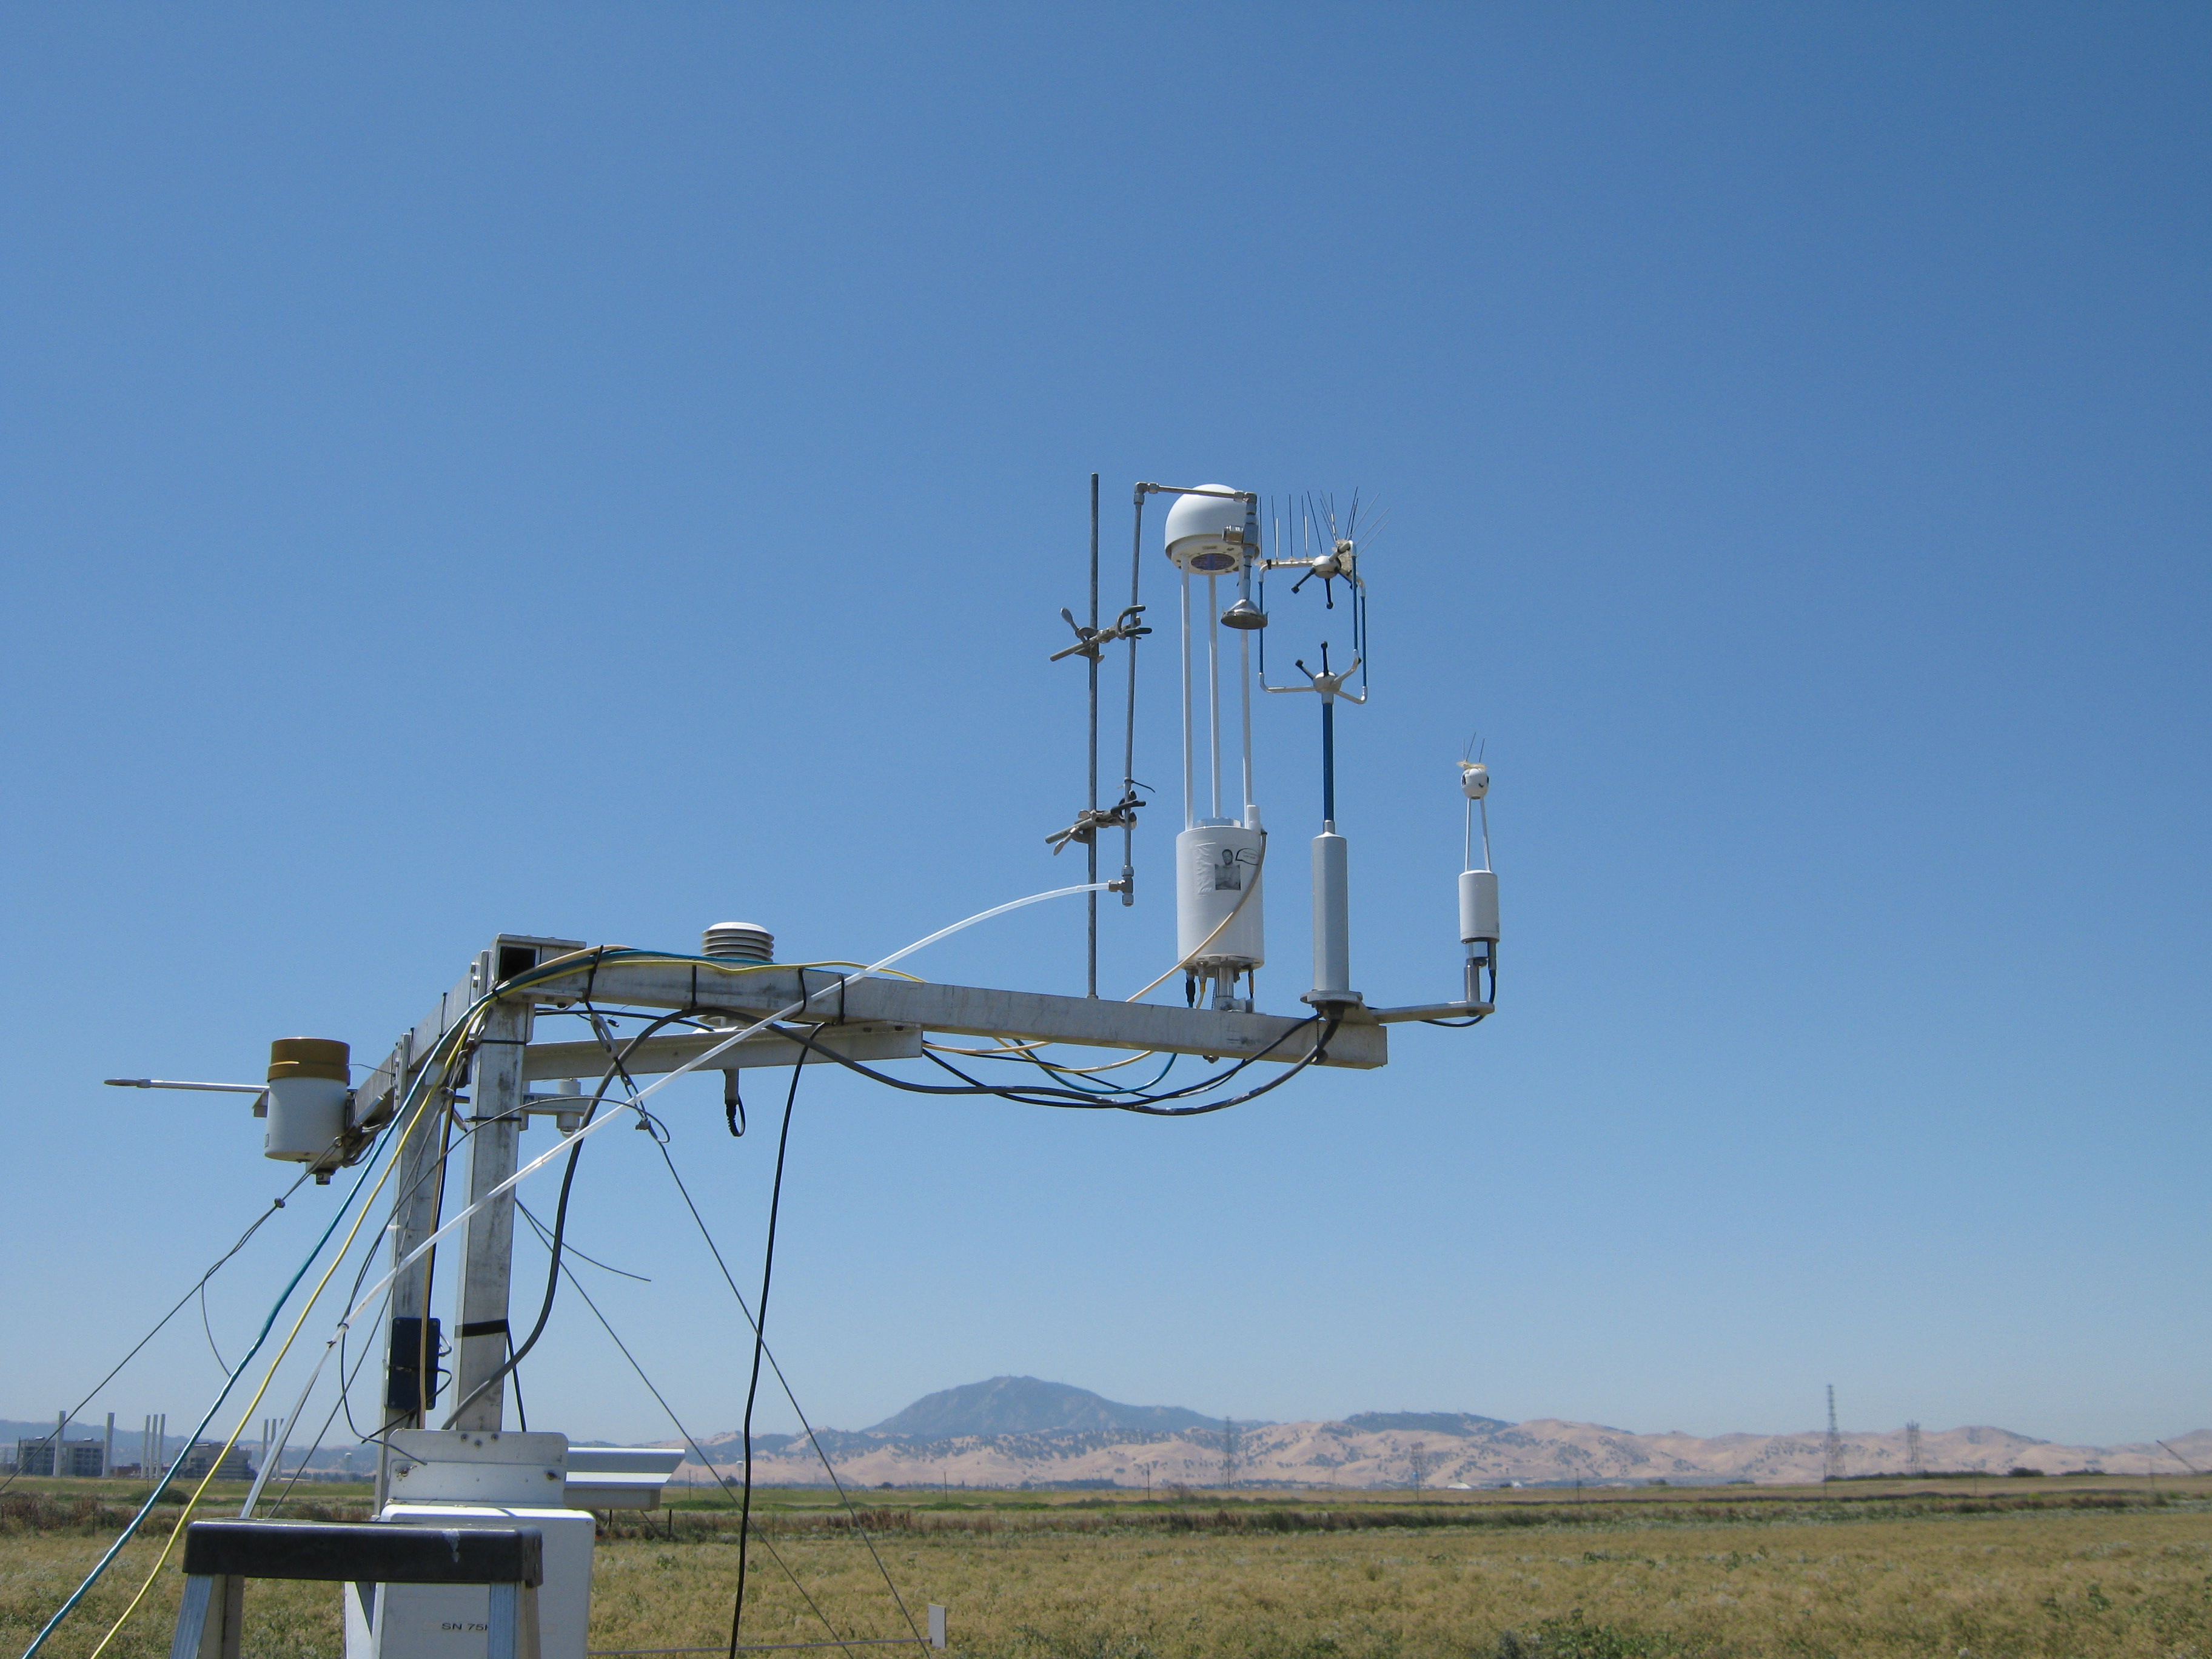
20100708SI_LI7700Tower3.jpg ( 2010-07-08 12:24:32 ) Full size: 3648x2736
Eddy sensors including LI-7700 at Sherman Pasture

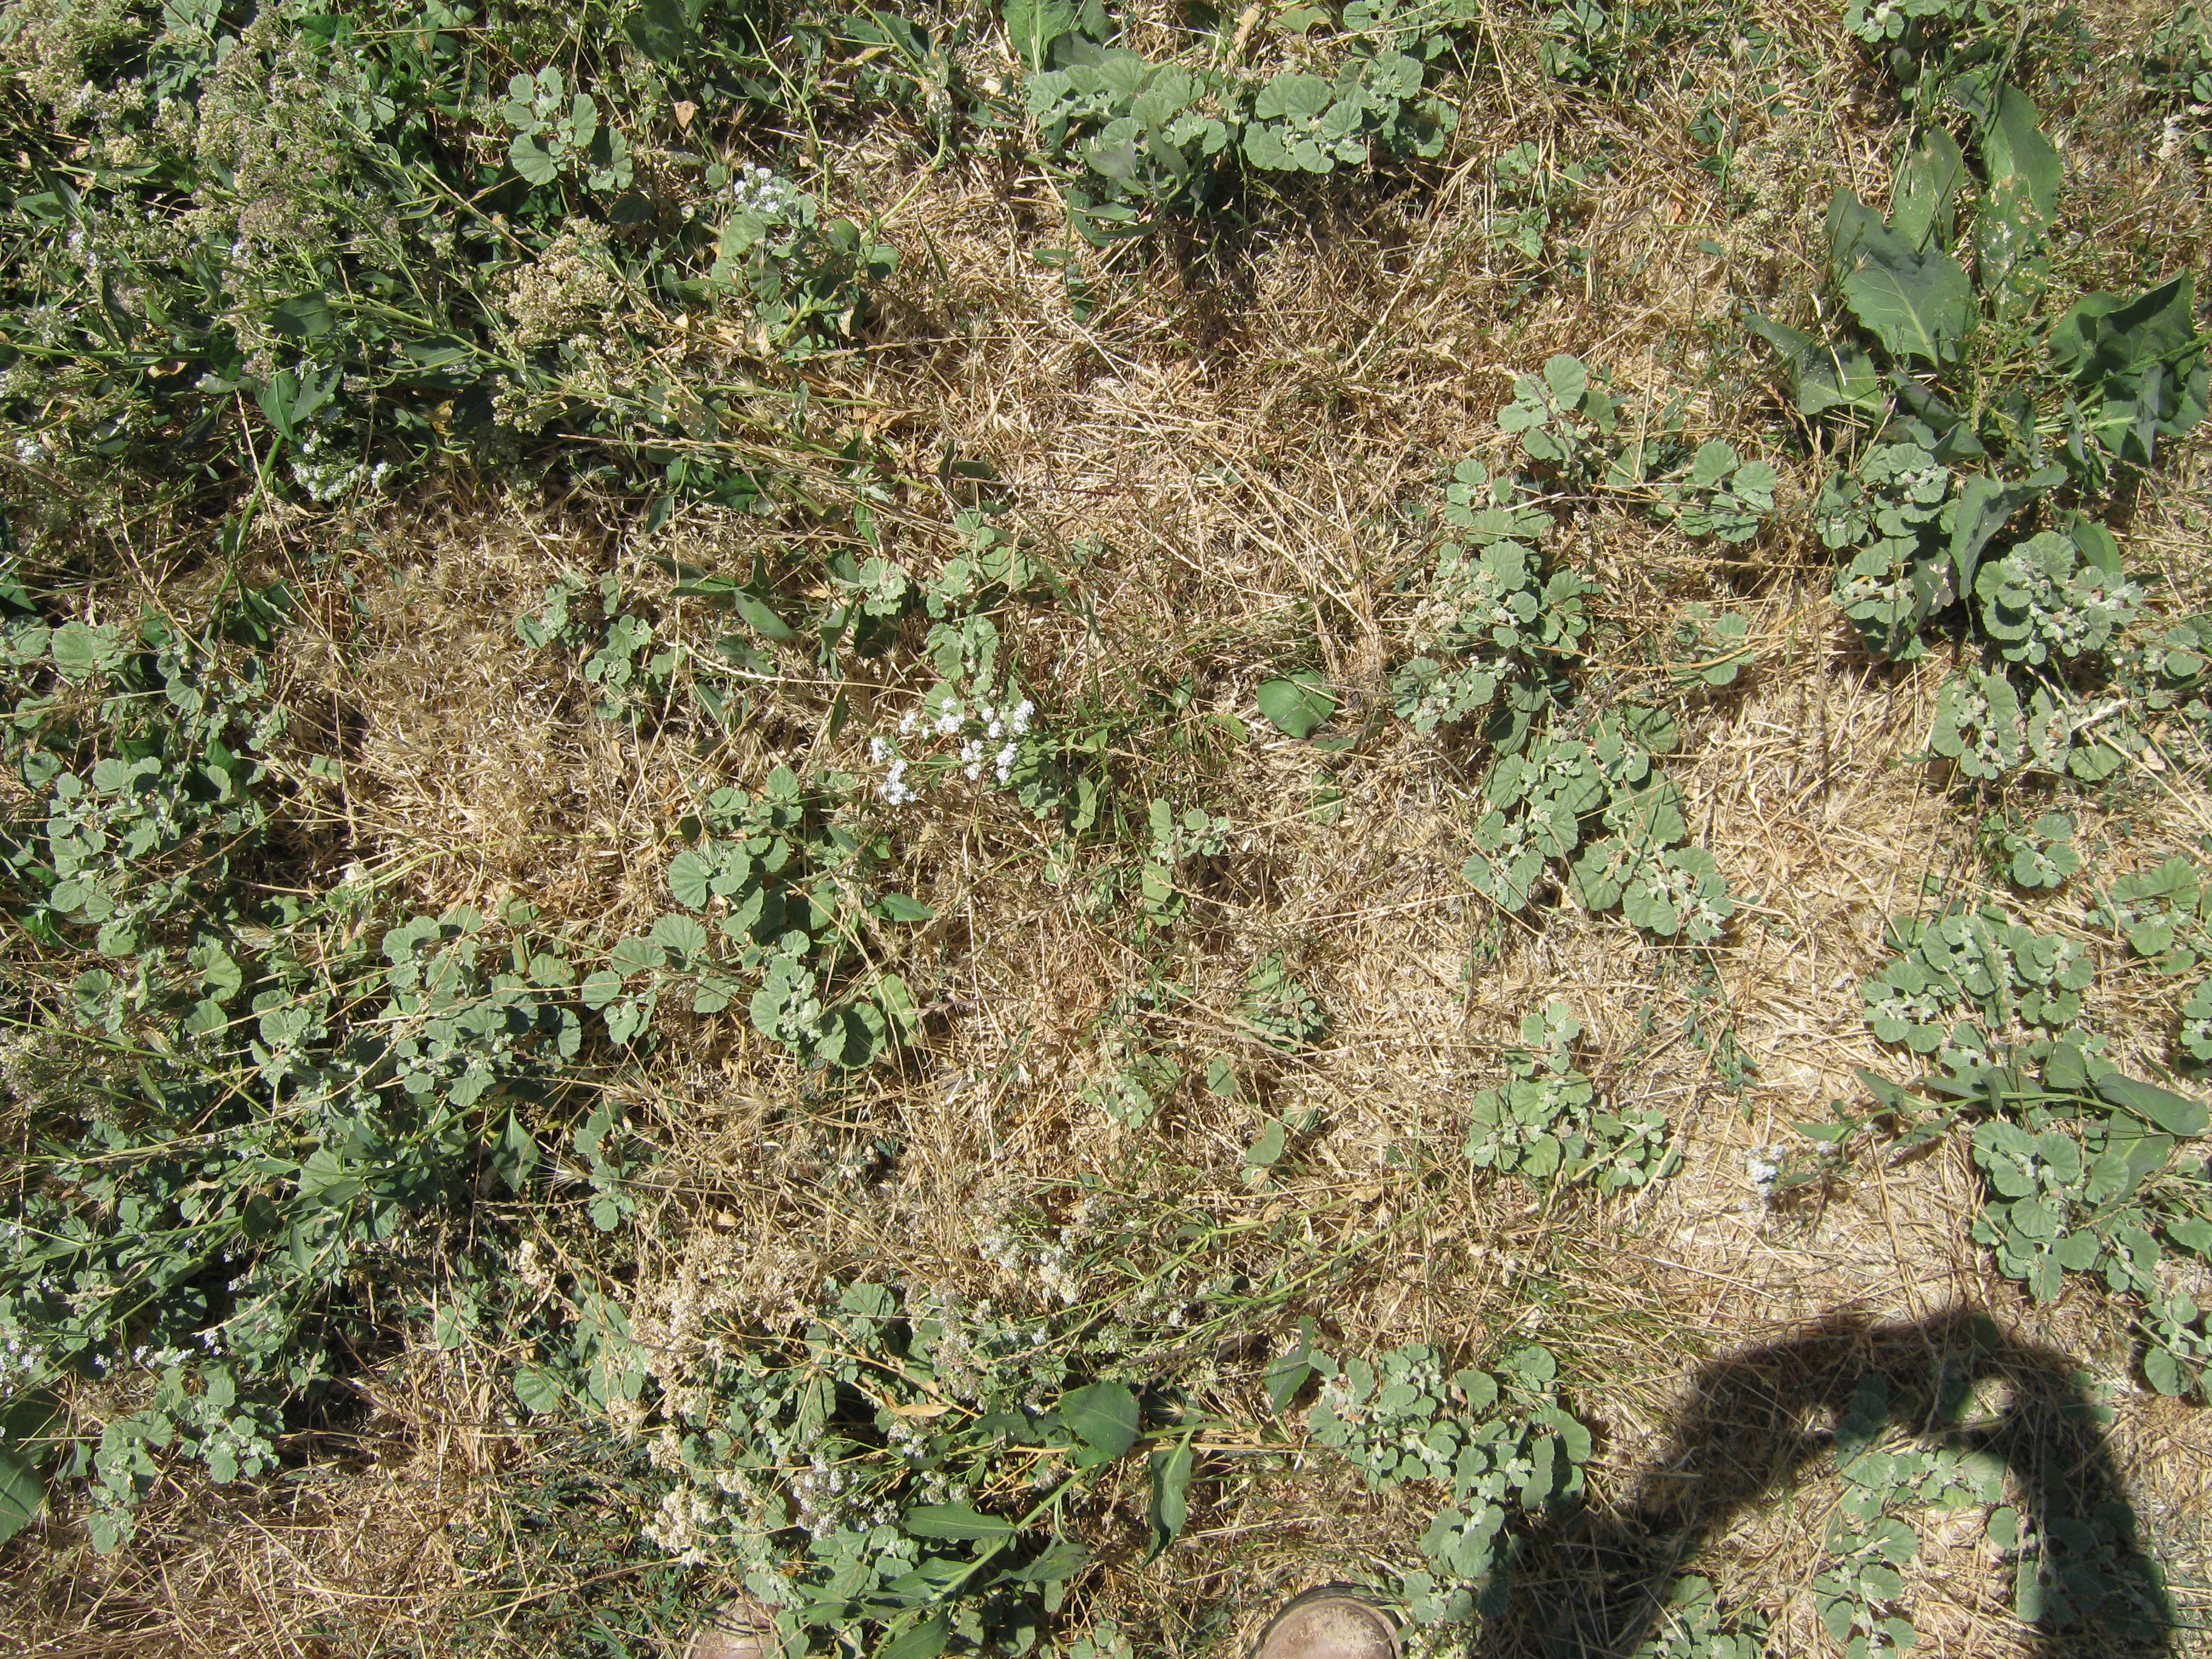
20100708SI_Ground1.jpg ( 2010-07-08 12:25:32 ) Full size: 3648x2736
Looking down at pepper weed and dead grass
20100708SI_Ground2.jpg ( 2010-07-08 12:25:38 ) Full size: 3648x2736
Looking down at pepper weed and dead grass
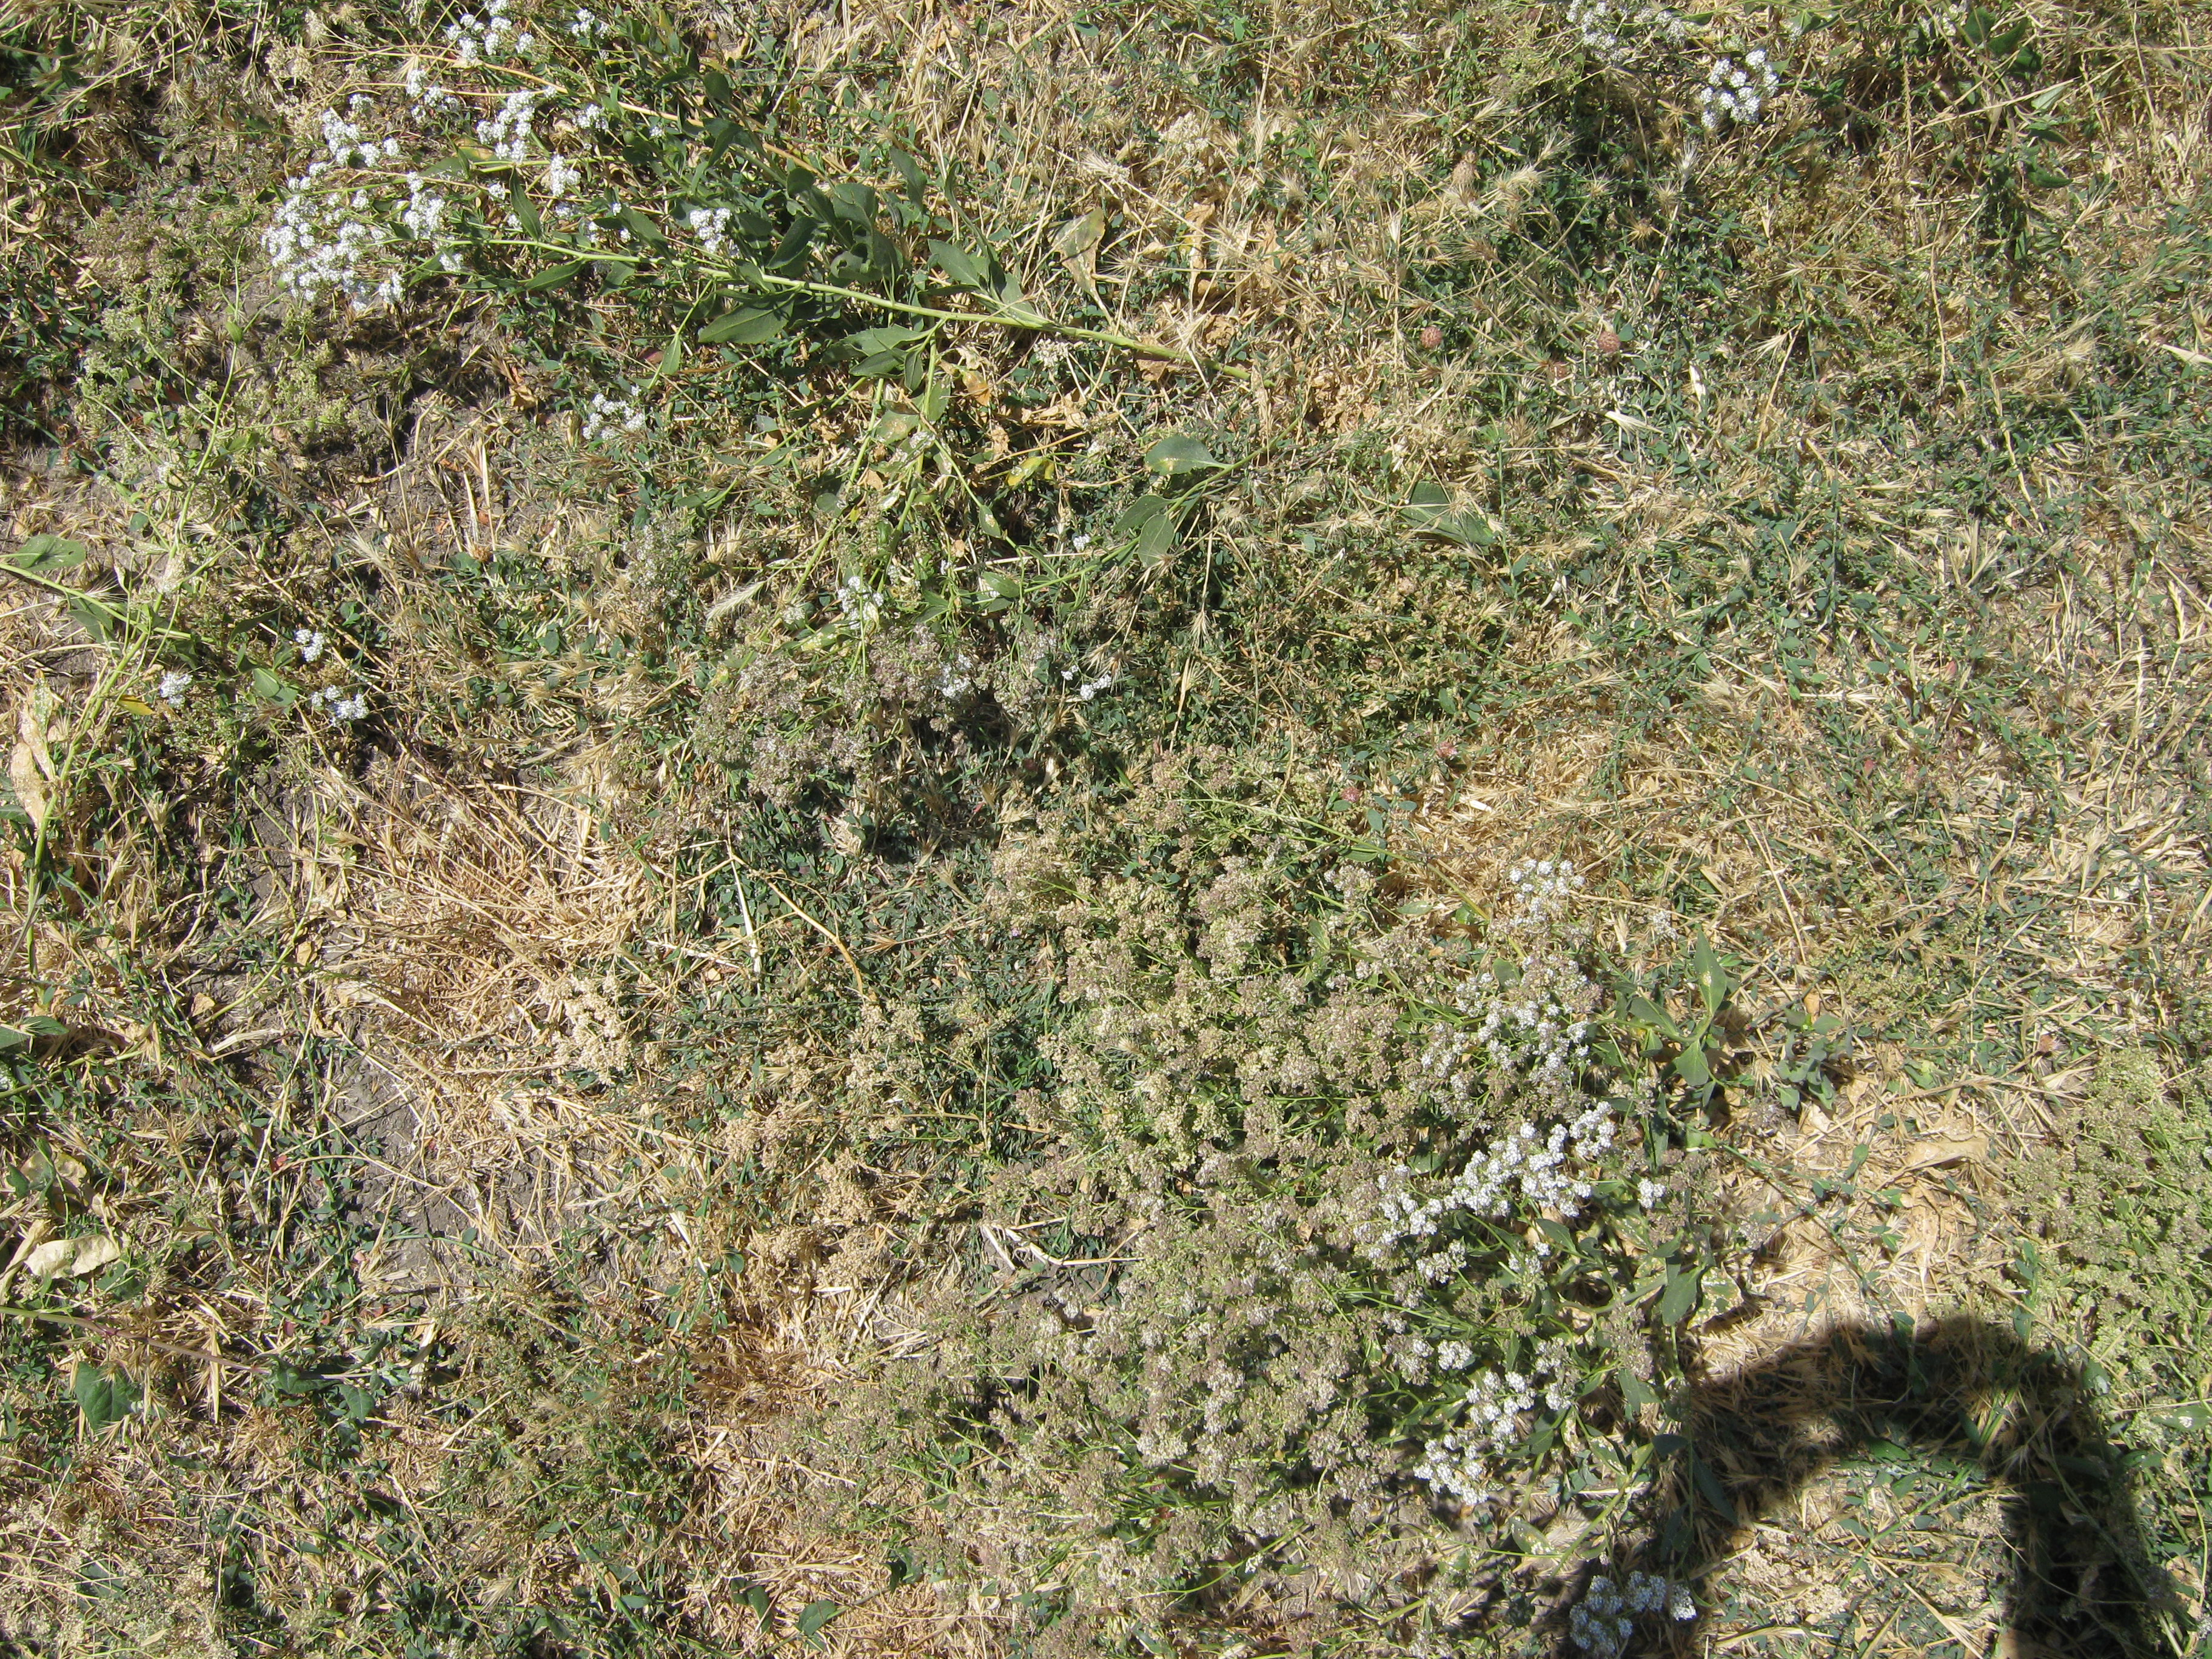
20100708SI_Ground3.jpg ( 2010-07-08 12:25:48 ) Full size: 3648x2736
Looking down a pepper weed and dead grass

20100708SI_MtDiablo.jpg ( 2010-07-08 12:26:16 ) Full size: 3648x2736
Mt Diablo from Sherman Pasture site
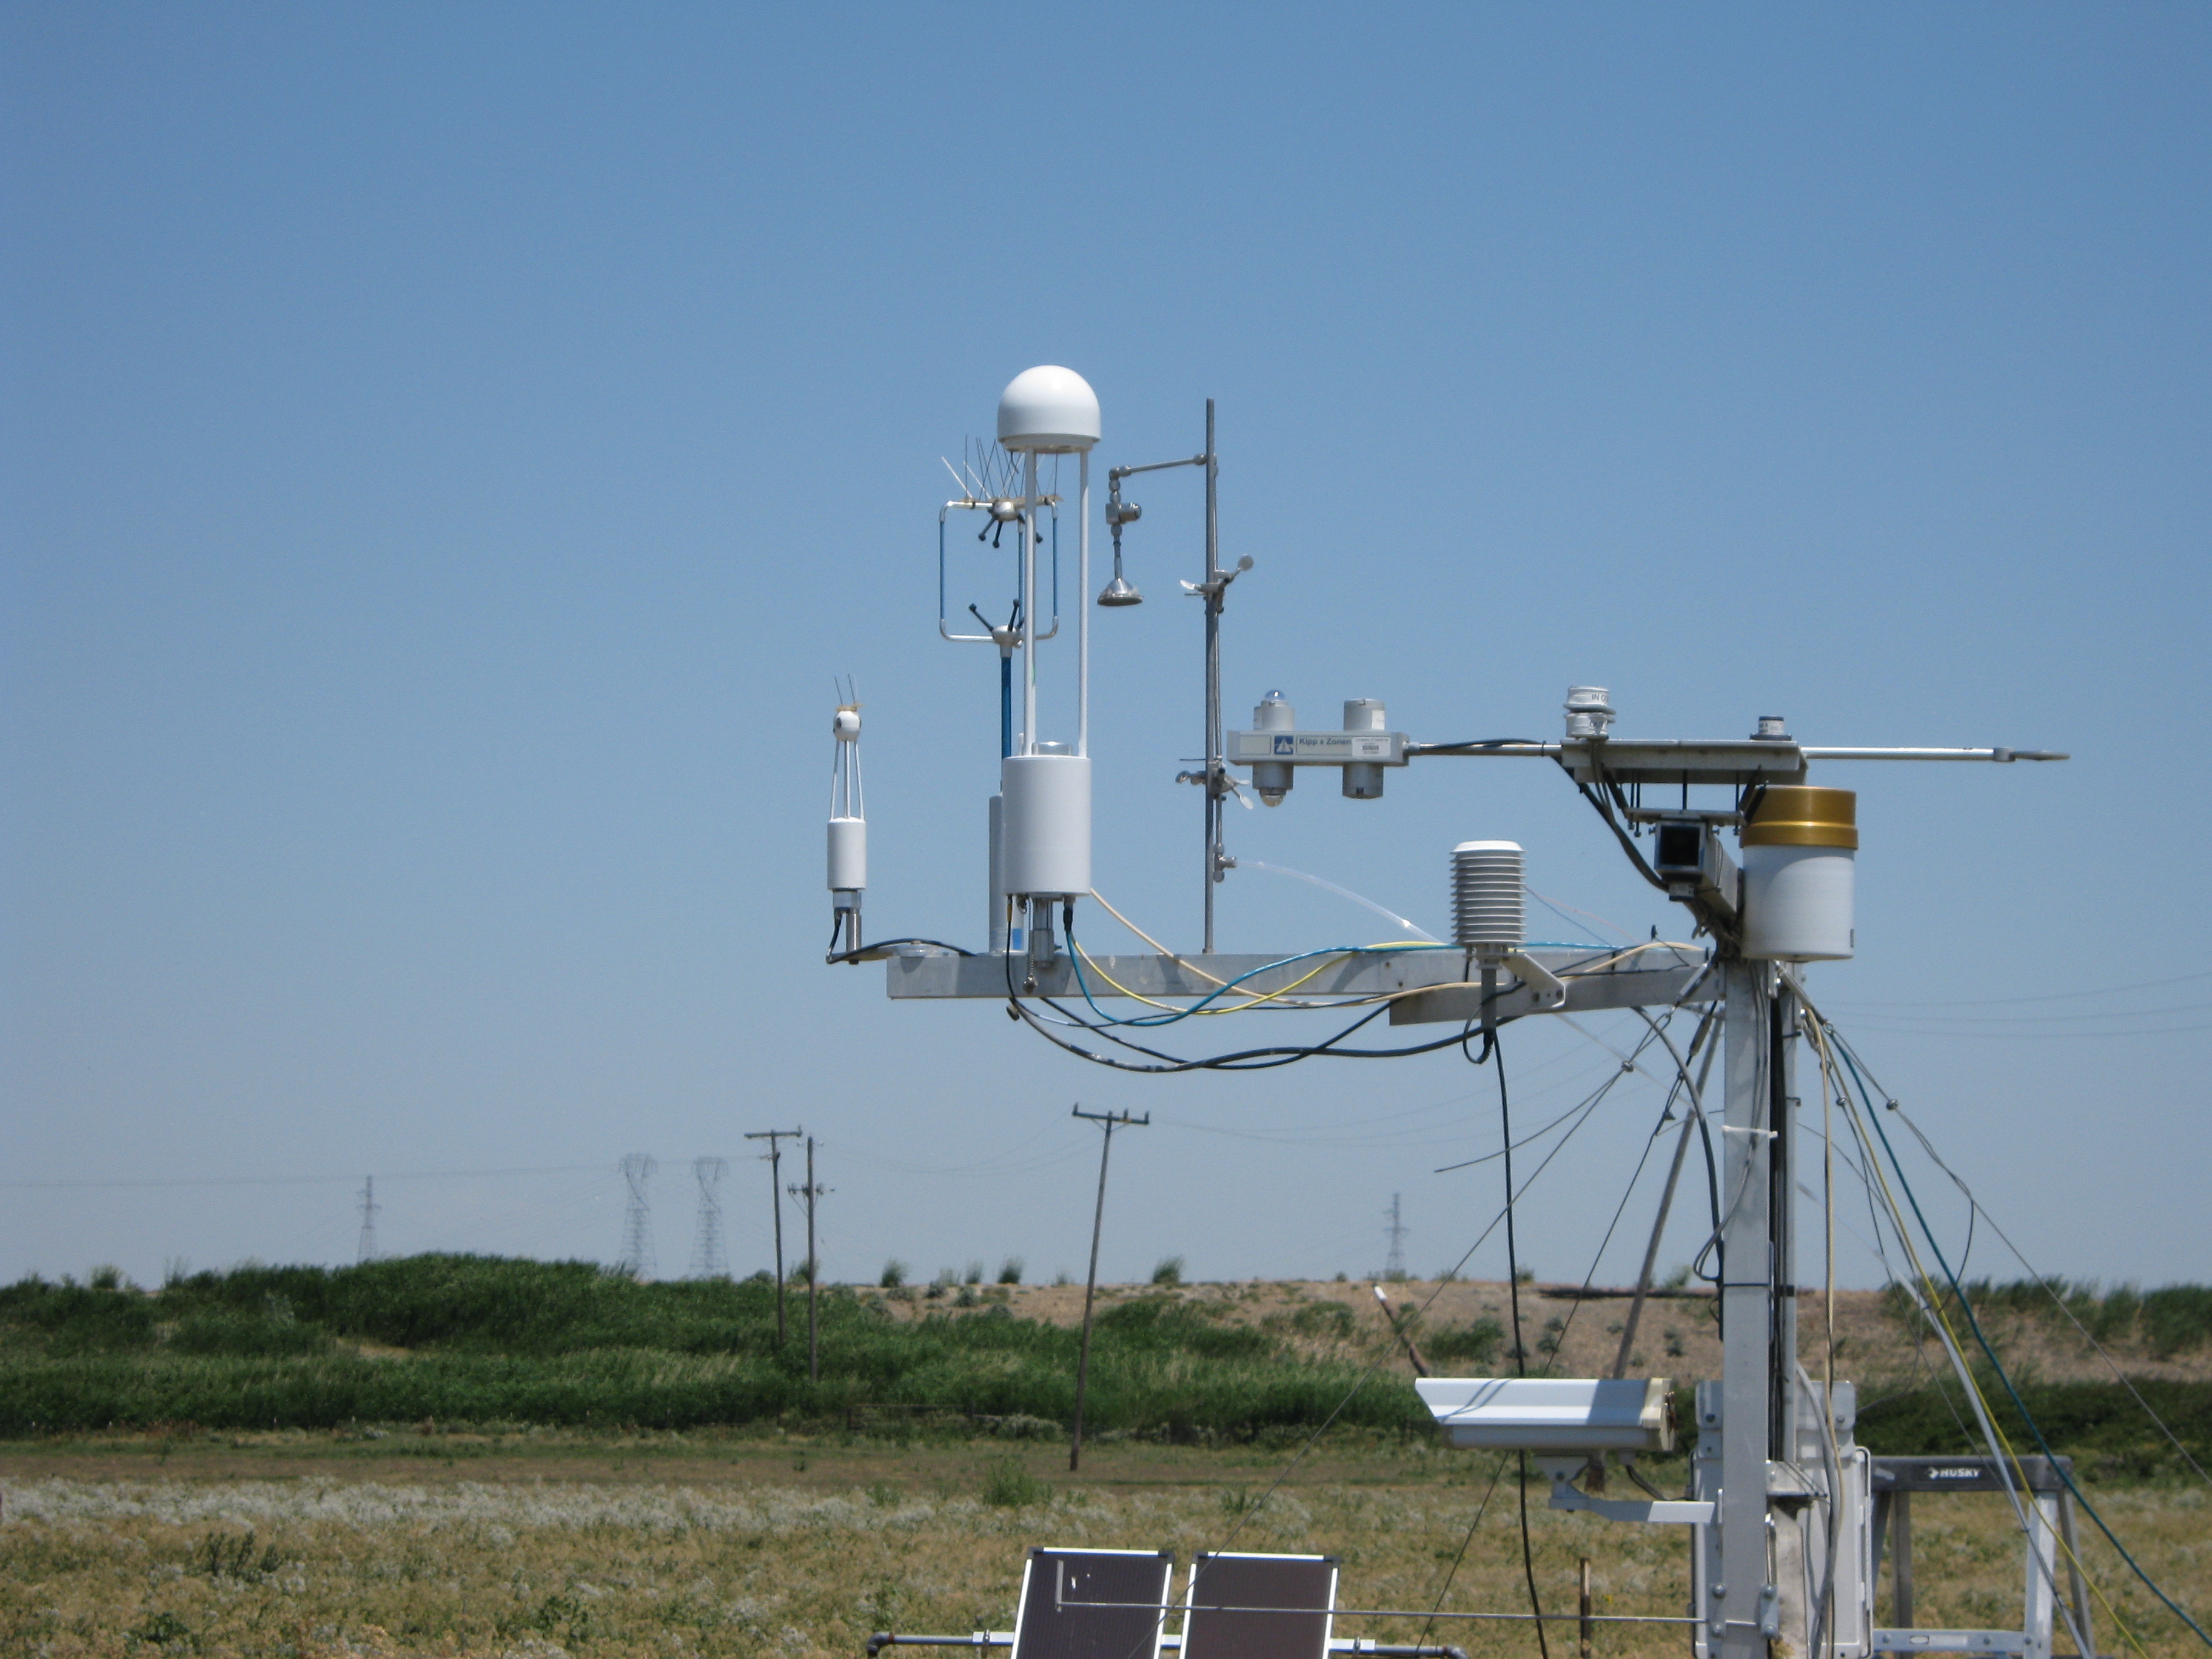
20100708SI_LI7700Tower4.jpg ( 2010-07-08 12:26:52 ) Full size: 3648x2736
Sherman Pasture eddy sensors and radiometers
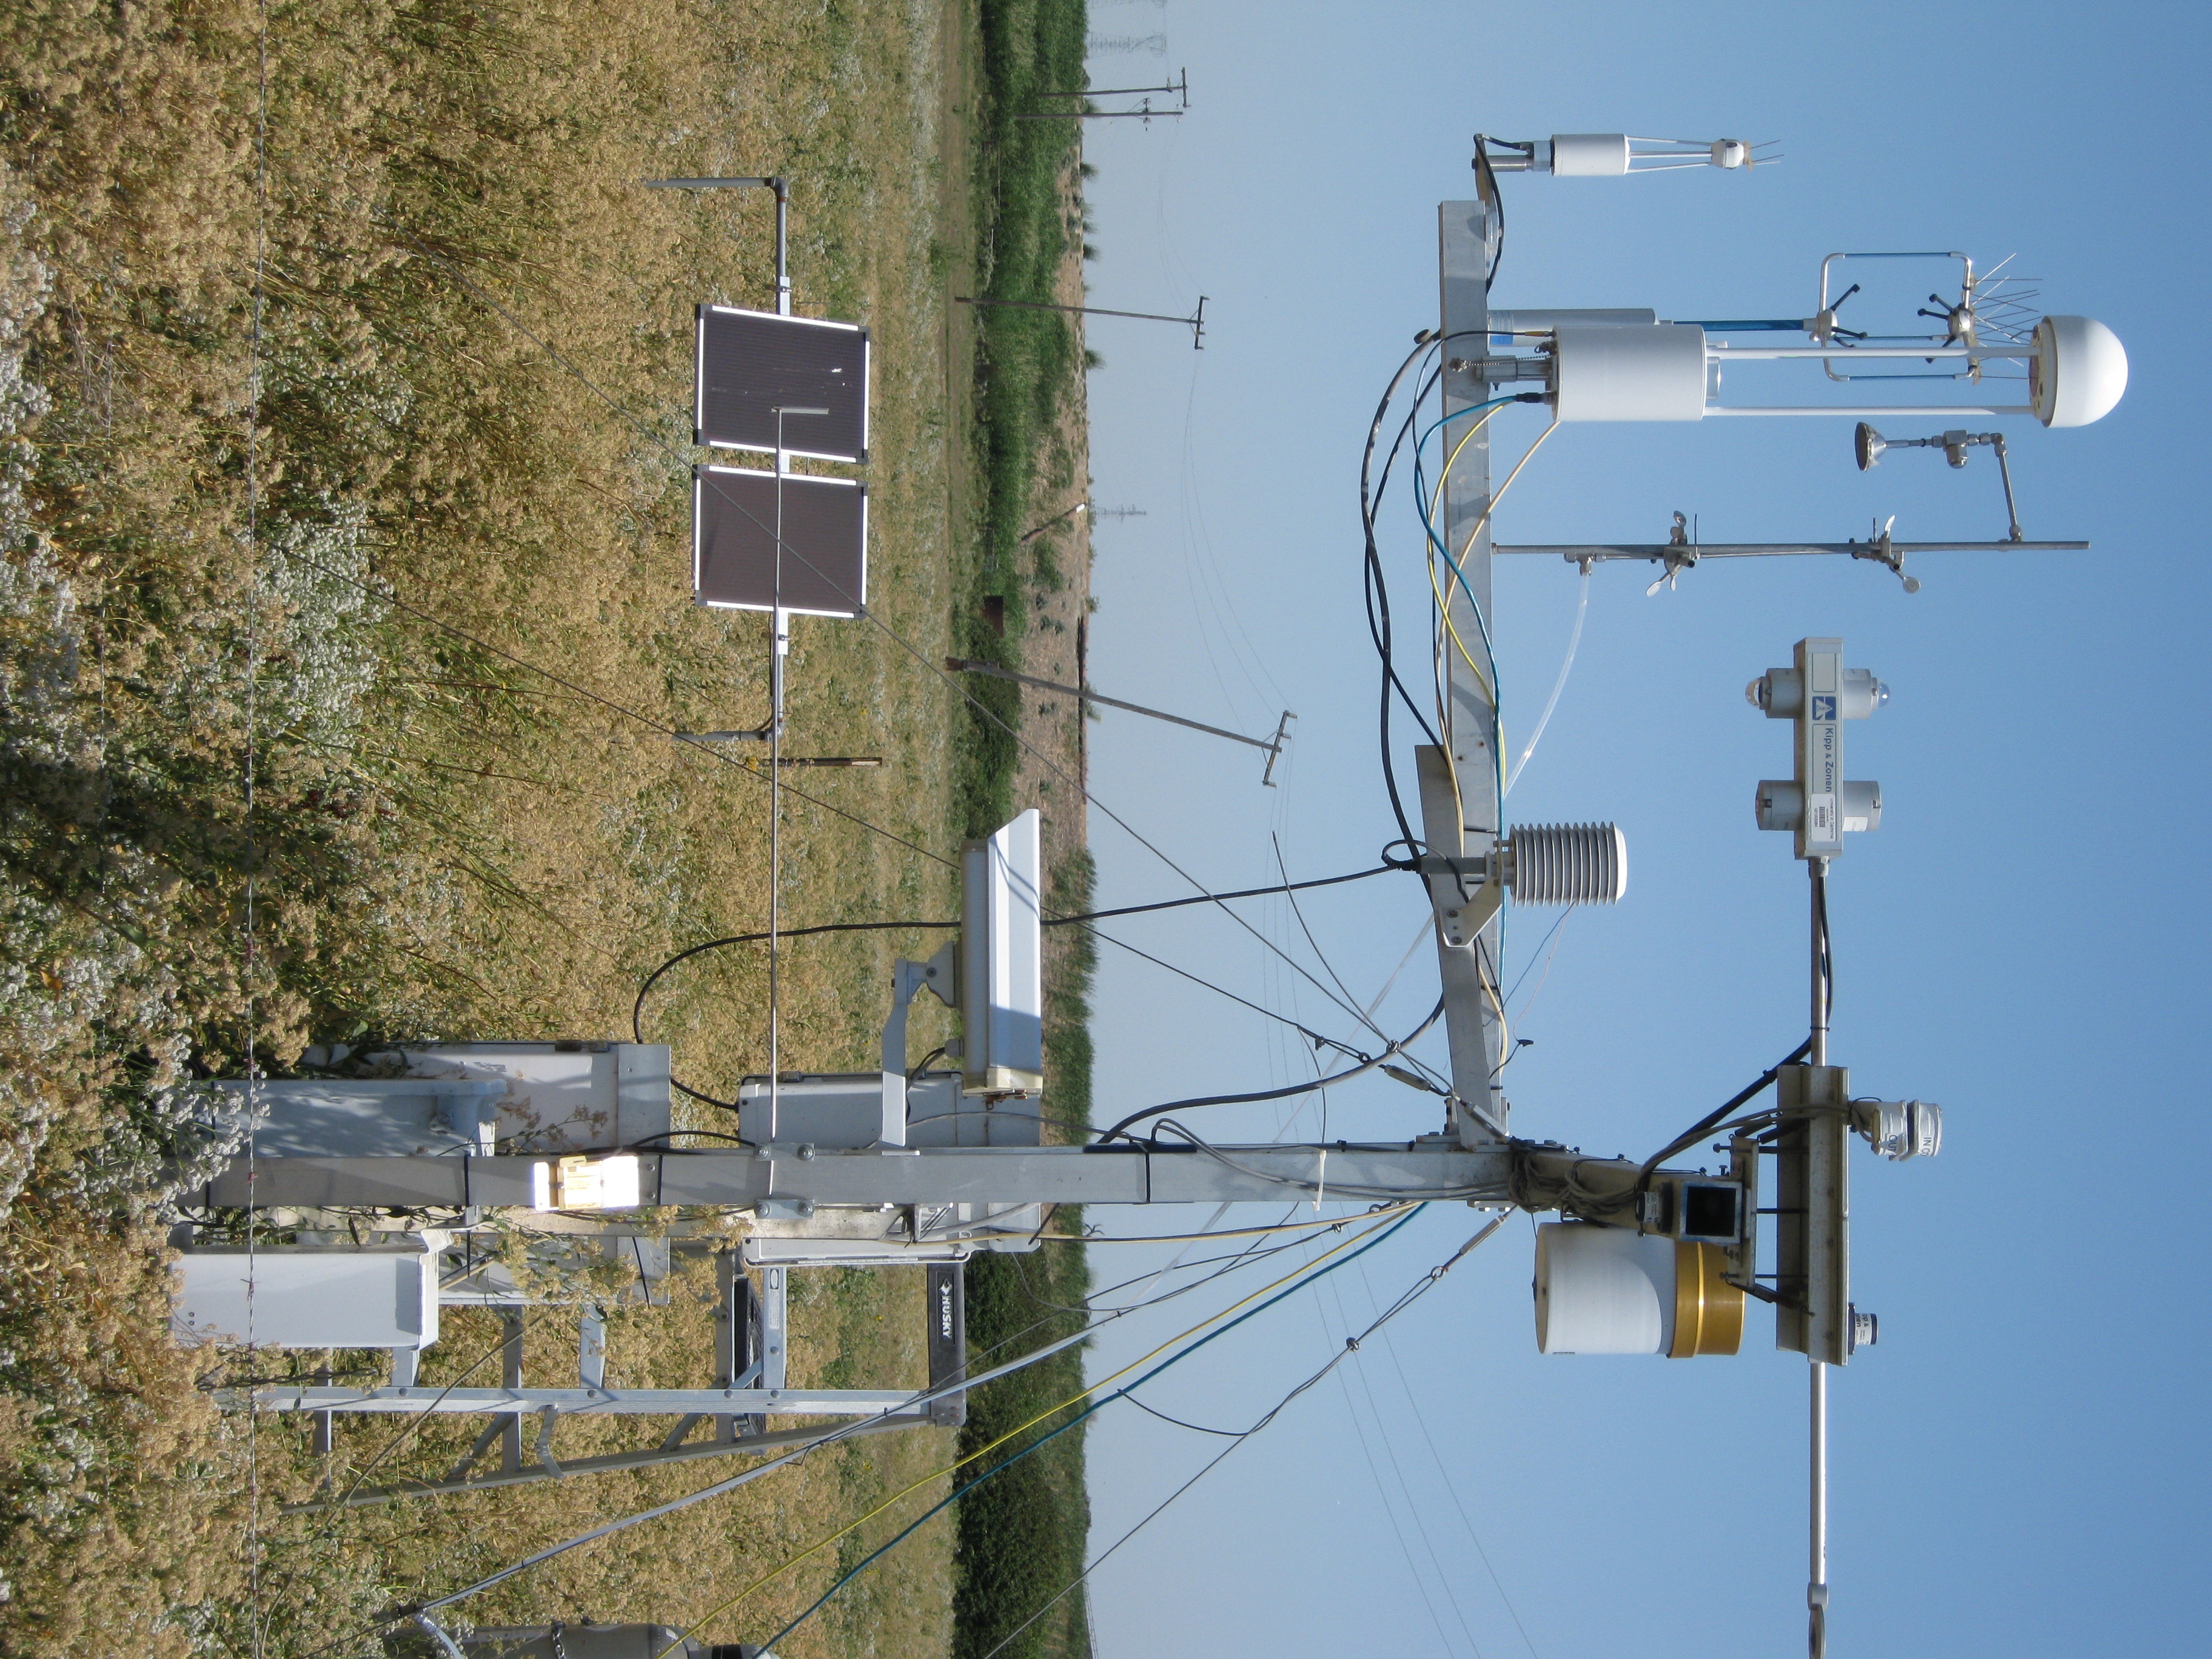
20100708SI_LI7700Tower5.jpg ( 2010-07-08 12:27:12 ) Full size: 3648x2736
Sherman Pasture full eddy tower and solar panels

SI_webcam_20101891045.jpg ( 2010-07-08 10:45:02 ) Full size: 640x480
Joe's shirt.
7 sets found
1 SI_mp graphs found
11 SI_met graphs found
Can't check SI_mixed
2 SI_mixed graphs found
5 SI_flx graphs found
2 SI_soilco2 graphs found
Can't check TWSI_mixed
Can't check SIMBTWEE_met