
Field Notes
<--2025-04-17 10:00:00 | 2025-05-05 12:00:00-->Other sites visited today: Vaira
Phenocam link: Searching...
Tonzi: 2025-04-29 09:30:00 (DOY 119)
Author: Joe Verfaillie
Others: Kuno
Summary: Collected GPS data, Swapped 7500s, failed to swap Tower 7700, Standard data collection, fixed tower fence, stole battery, replaced Floor RH/T fan.
| Tonzi 2025-04-29 Kuno and I arrived at about 10:30 PDT. It was a beautiful, sunny and warm day more suited to a picnic than fieldwork. The ground surface is almost dry - no puddles in the road. The trees and grass look to be at about peak greenness. Some flowers scattered about. Kuno started his standard stem and ground chamber measurements. The open areas are still taking up CH4 but a lot of the other fluxes are close to zero. Later he drilled some holes in the trees and was seeing very high CH4 concentrations from syringe samples he pulled from the holes. I think he tried to light the gas with a lighter. He also did floating chambers on the pound again - very low CH4 fluxes, high O2 and pH. I started downloading GPS data from Housen's GPS units. I had to cycle power on each one to get them to show up on the wireless router. Then I had to click on each of the daily files to download load the data. It seemed like I could only do six at a time. I collected the tower top data and swapped the 7500 and 7700 for calibration. However, after getting the freshly calibrated 7700 up and running I discovered it was reading negative CH4 in ppm. First I thought maybe the fine wire TC had broken, but the temperature was okay. Pressure was not. The pressure was reading -17kPa. The CH4 densities looked okay and fluxes would probably be fine but hard to get a pressure sensor fixed if I left it on the tower. So I decided to put the original 7700 (421) back up and bring in the freshly calibrated one (514) to get it fixed. 7500 sn 75H-2667 came off and sn 0065 went on. 7500 2667 read: 429.0ppm CO2, 458.9mmol/m3 H2O, 21.0C, 99.2kPa, 98.8SS 7500 0065 read: 431.5ppm CO2, 482.1mmol/m3 H2O, 21.1C 99.2kPa, 97.5SS The 7700 read: 2.07ppm CH4, 68.8RSSI - 86.2 after cleaning I updated the pressure coefficients and restarted the 7500 box. I connected the new 7700 and then connected the original 7700 in the software. I was going to download a file later but the Tower computer didn’t have the file transfer software. I topped off the wash reservoir. I swapped the 7500 on the Floor tower: sn 0042 came off and sn 0418 went on. Kuno had swapped the 7700 last week but the new one was missing its hat. I gave it the hat from the 7700 I didn't put on the main Tower. The 7550 software had a flag on the 7700 as a bad clock sync but it went away after a restart and the data seemed okay. 7500 0042 read: 433.7ppm CO2, 436.7mmol/m3 H2O, 25.2C, 99.2kPa, 99.4SS 7500 0418 read: 433.4ppm CO2, 476.4mmol/m3 H2O, 25.7C, 99.2kPa, 96.5SS The 7700 read: 2.05ppm CH4, 58.7RSSI - 72.7 after cleaning I set the pressure coefficients and restarted the 7550 box. I topped off the wash reservoir and tested the spray. I adjust the DIY spray head slightly. I serviced the z-cams, read the dendrometers, collected the FD data and measured/collected the well data and the tree bole temperature data. I looked for batteries that were any good to test Delfina's grape experiment equipment. There are three dead cores near the Tower fence gate. The fence battery seemed surprisingly good. I ended up stealing one of Troy's batteries. The ones I tested were all super low, but they are pretty new AGMs and a good charge in the lab might recover one. I took a Duracell one home. The cows messed up the fence wires around the main tower - I put it back together and the charger reported good charge. Cows had knocked the ground IRT loose again. I put it back into the mount. I did midday water potential oak 102 was about -10Bar and 92 was about -22Bar. I swapped the fan on the Floor RH/T sensor. The one I put in was 12V but it may be a 24V line - seemed to be spinning pretty fast. We left at about 15:30PDT |
Field Data
No tank data
No TZ Well data found
No TZ Moisture Point data found
No VR Moisture Point data found
No TZ grass heigth found
No VR grass heigth found
No TZ Tree DBH found
No water potential data found
No TZ Grass Biomass data found
No TZ OakLeaves Biomass data found
No TZ PineNeedles Biomass data found
1 photos found
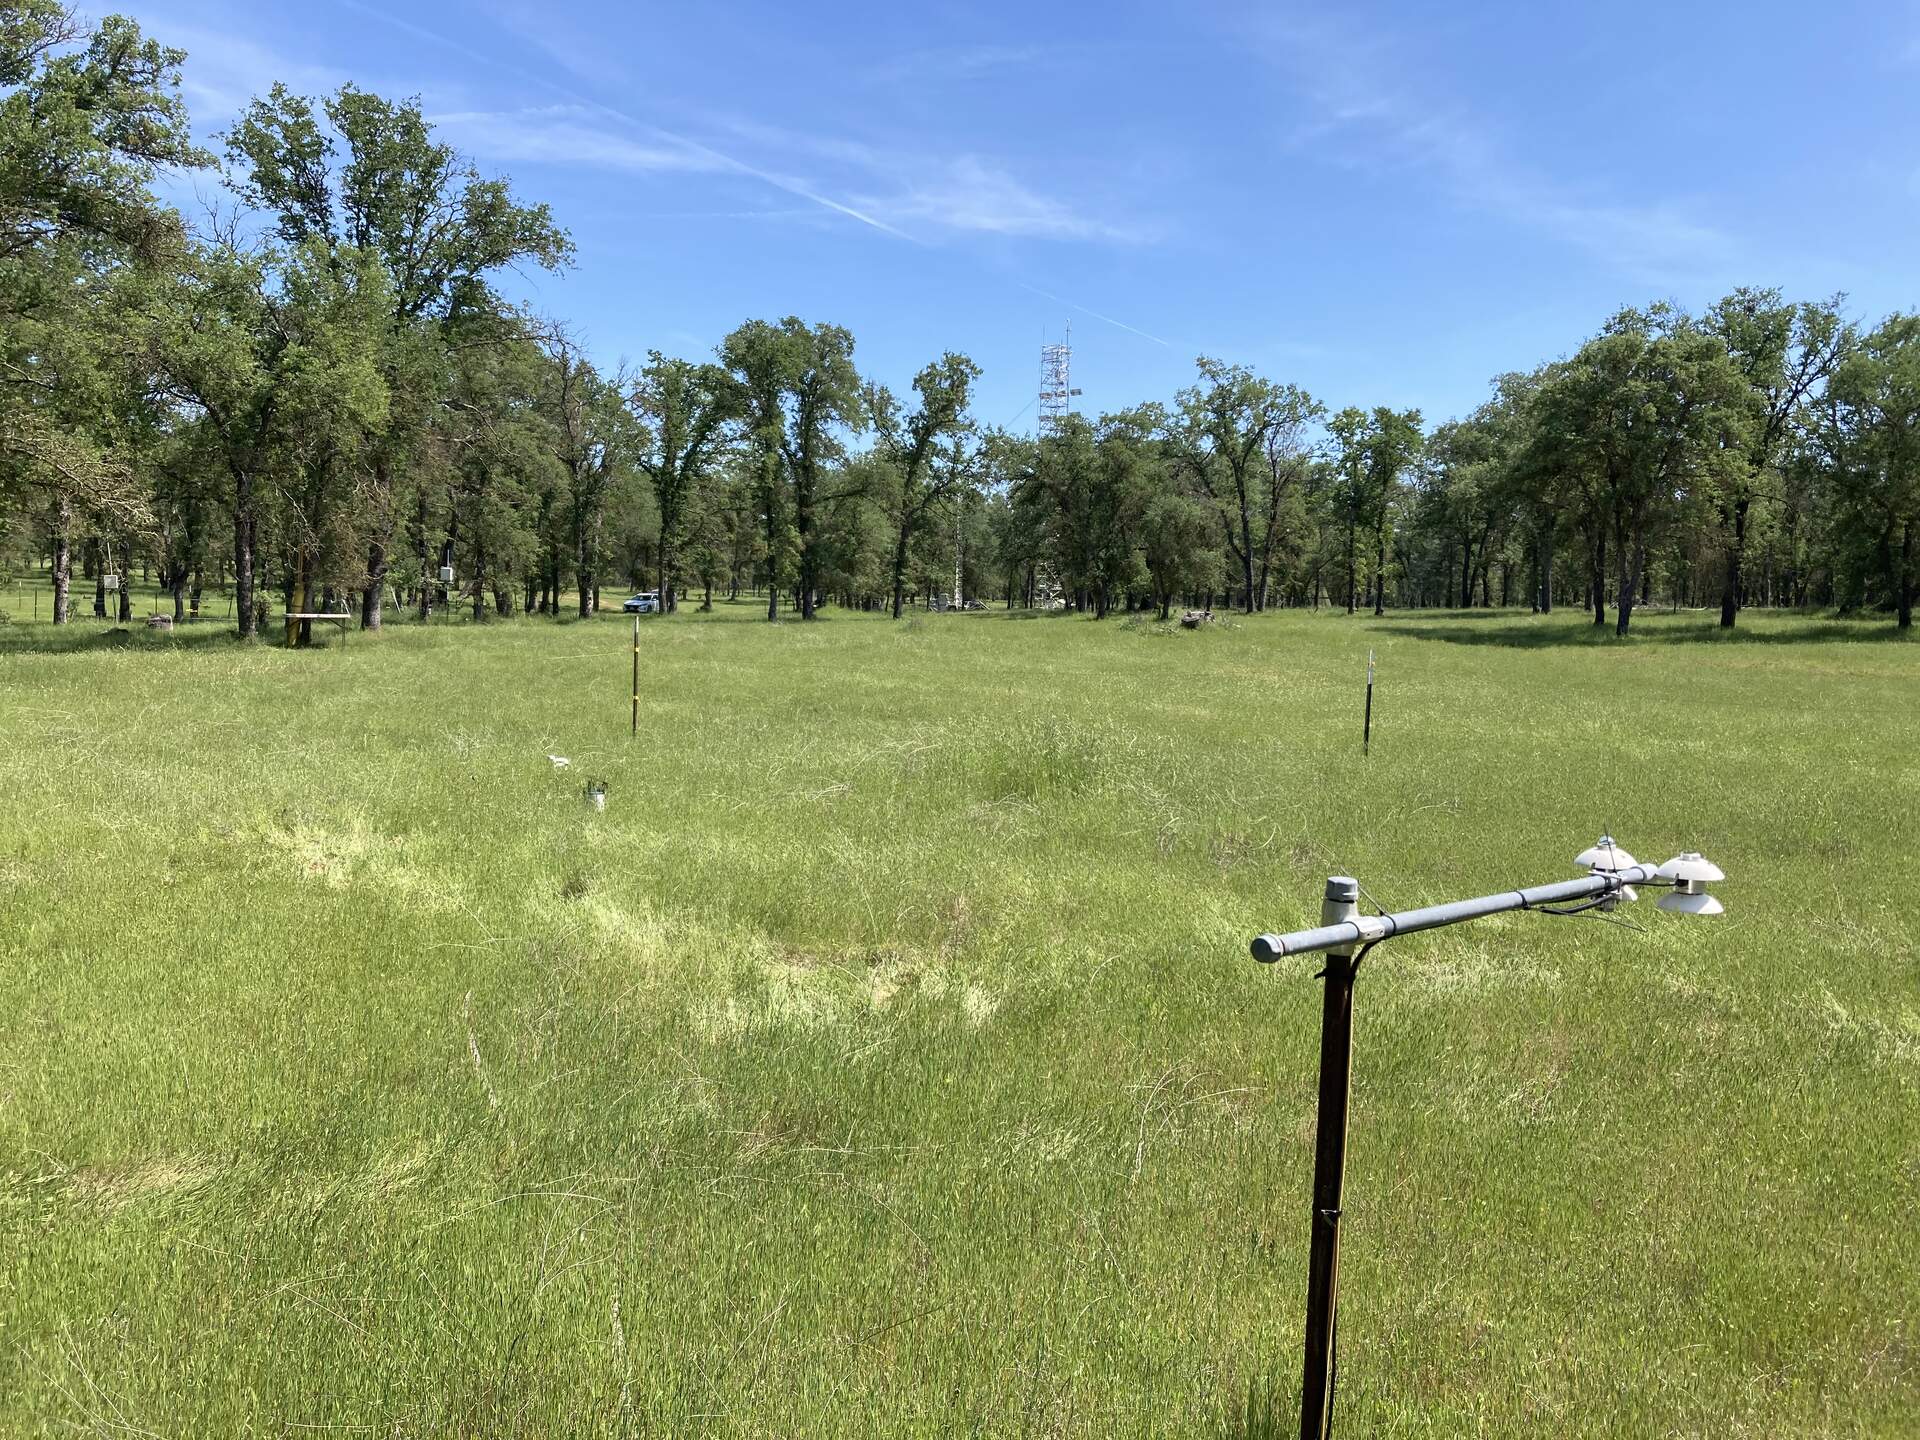
20250429TZ_Spring.jpg ( 2025-04-29 14:38:10 ) Full size: 1920x1440
View of the Tonzi oak savanna in spring
16 sets found
No data found for TZ_Fenergy.
11 TZ_tmet graphs found
No data found for TZ_soilco2.
Can't check TZ_mixed
3 TZ_mixed graphs found
1 TZ_fflux graphs found
8 TZ_fmet graphs found
No data found for TZ_tram.
3 TZ_co2prof graphs found
1 TZ_irt graphs found
No data found for TZ_windprof.
1 TZ_tflux graphs found
8 TZ_sm graphs found
Can't check TZ_met
1 TZ_met graphs found
Can't check TZVR_mixed
8 TZ_osu graphs found
3 TZ_fd graphs found
Tonzi Z-cam data