
Field Notes
<--2010-07-08 12:30:00 | 2010-07-28 09:00:00-->Other sites visited today: Twitchell Rice
Phenocam link: Searching...
Sherman Island: 2010-07-14 09:30:00 (DOY 195)
Author: Joe Verfaillie
Others: Jaclyn Hatala
| Arrived about 9:30 with Jaclyn. Warm, sunny, clear, nice breeze from the west. Much of the pepper weed flowers are yellow but looks like a big patch of fresh flower to the north of the tower. The field seems pretty dry.
I fixed the mounting of the soil CO2 CR23x. I removed the Velcro that gave way and put some silicon on the back corners of the 23x. I propped it up with a piece of wood to let the silicon dry. I removed the soil CO2 #2 probe that was reading 3.4% from its tube and it dropped down to 0.1% in the atmosphere relatively quickly. I replaced it in the tube and it rose again the around 2% before we left. I also remounted the AM16/32 in the met box with silicon and tied it in to place to let the silicon set. All was well. The LGR read: 8:55PST, 28.56C, 133.33Torr, 15.779usec, 10Hz, 1.846ppm, 3130.5hr The LI7700 RSSI was about 34 before I cleaned its mirrors with alcohol and kim wipes. After cleaning the RSSI was about 80. Copied data and swapped card. Radiometers looked clean. I checked two batteries that used to run data loggers before there was UPS backed up 12VDC from the box. The tower one was dead and guarded by a great big widow. The soil moisture one seems good. Left for Twitchell about 10:30am |
3 photos found
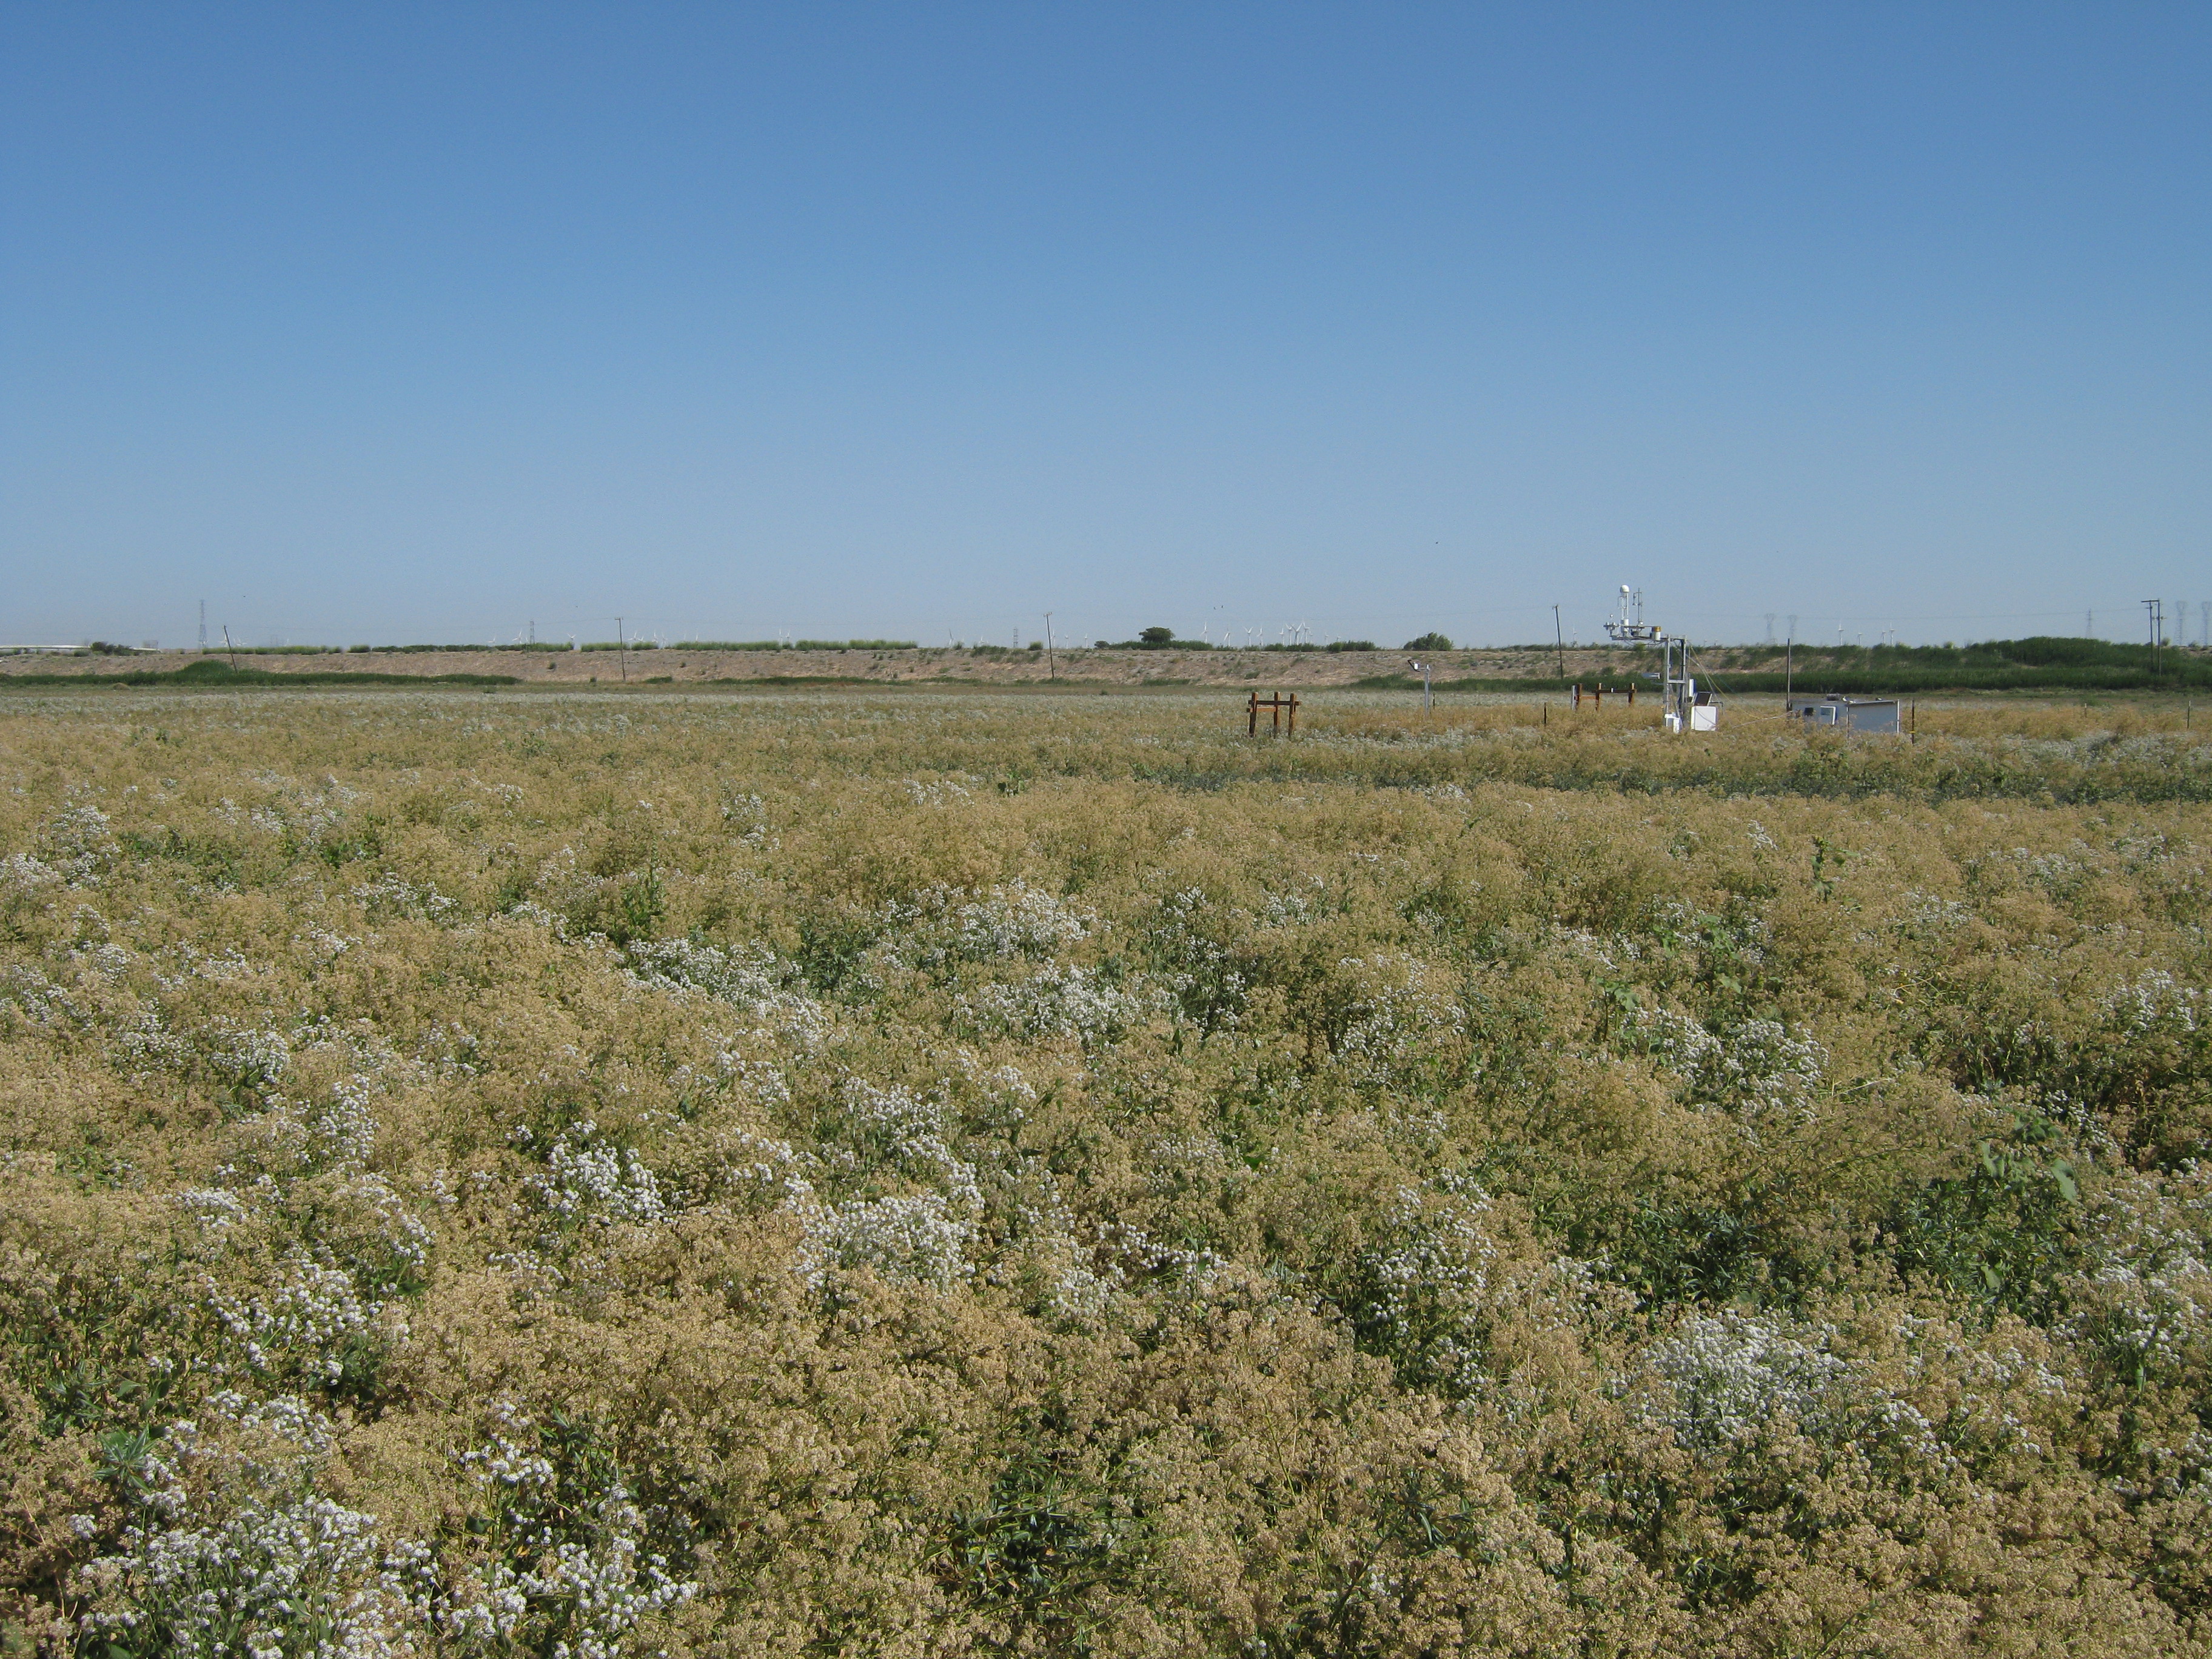
20100714SI_TowerLookingNorth.jpg ( 2010-07-14 10:17:38 ) Full size: 3648x2736
View of Sherman pasture dominated by flowering pepper weed
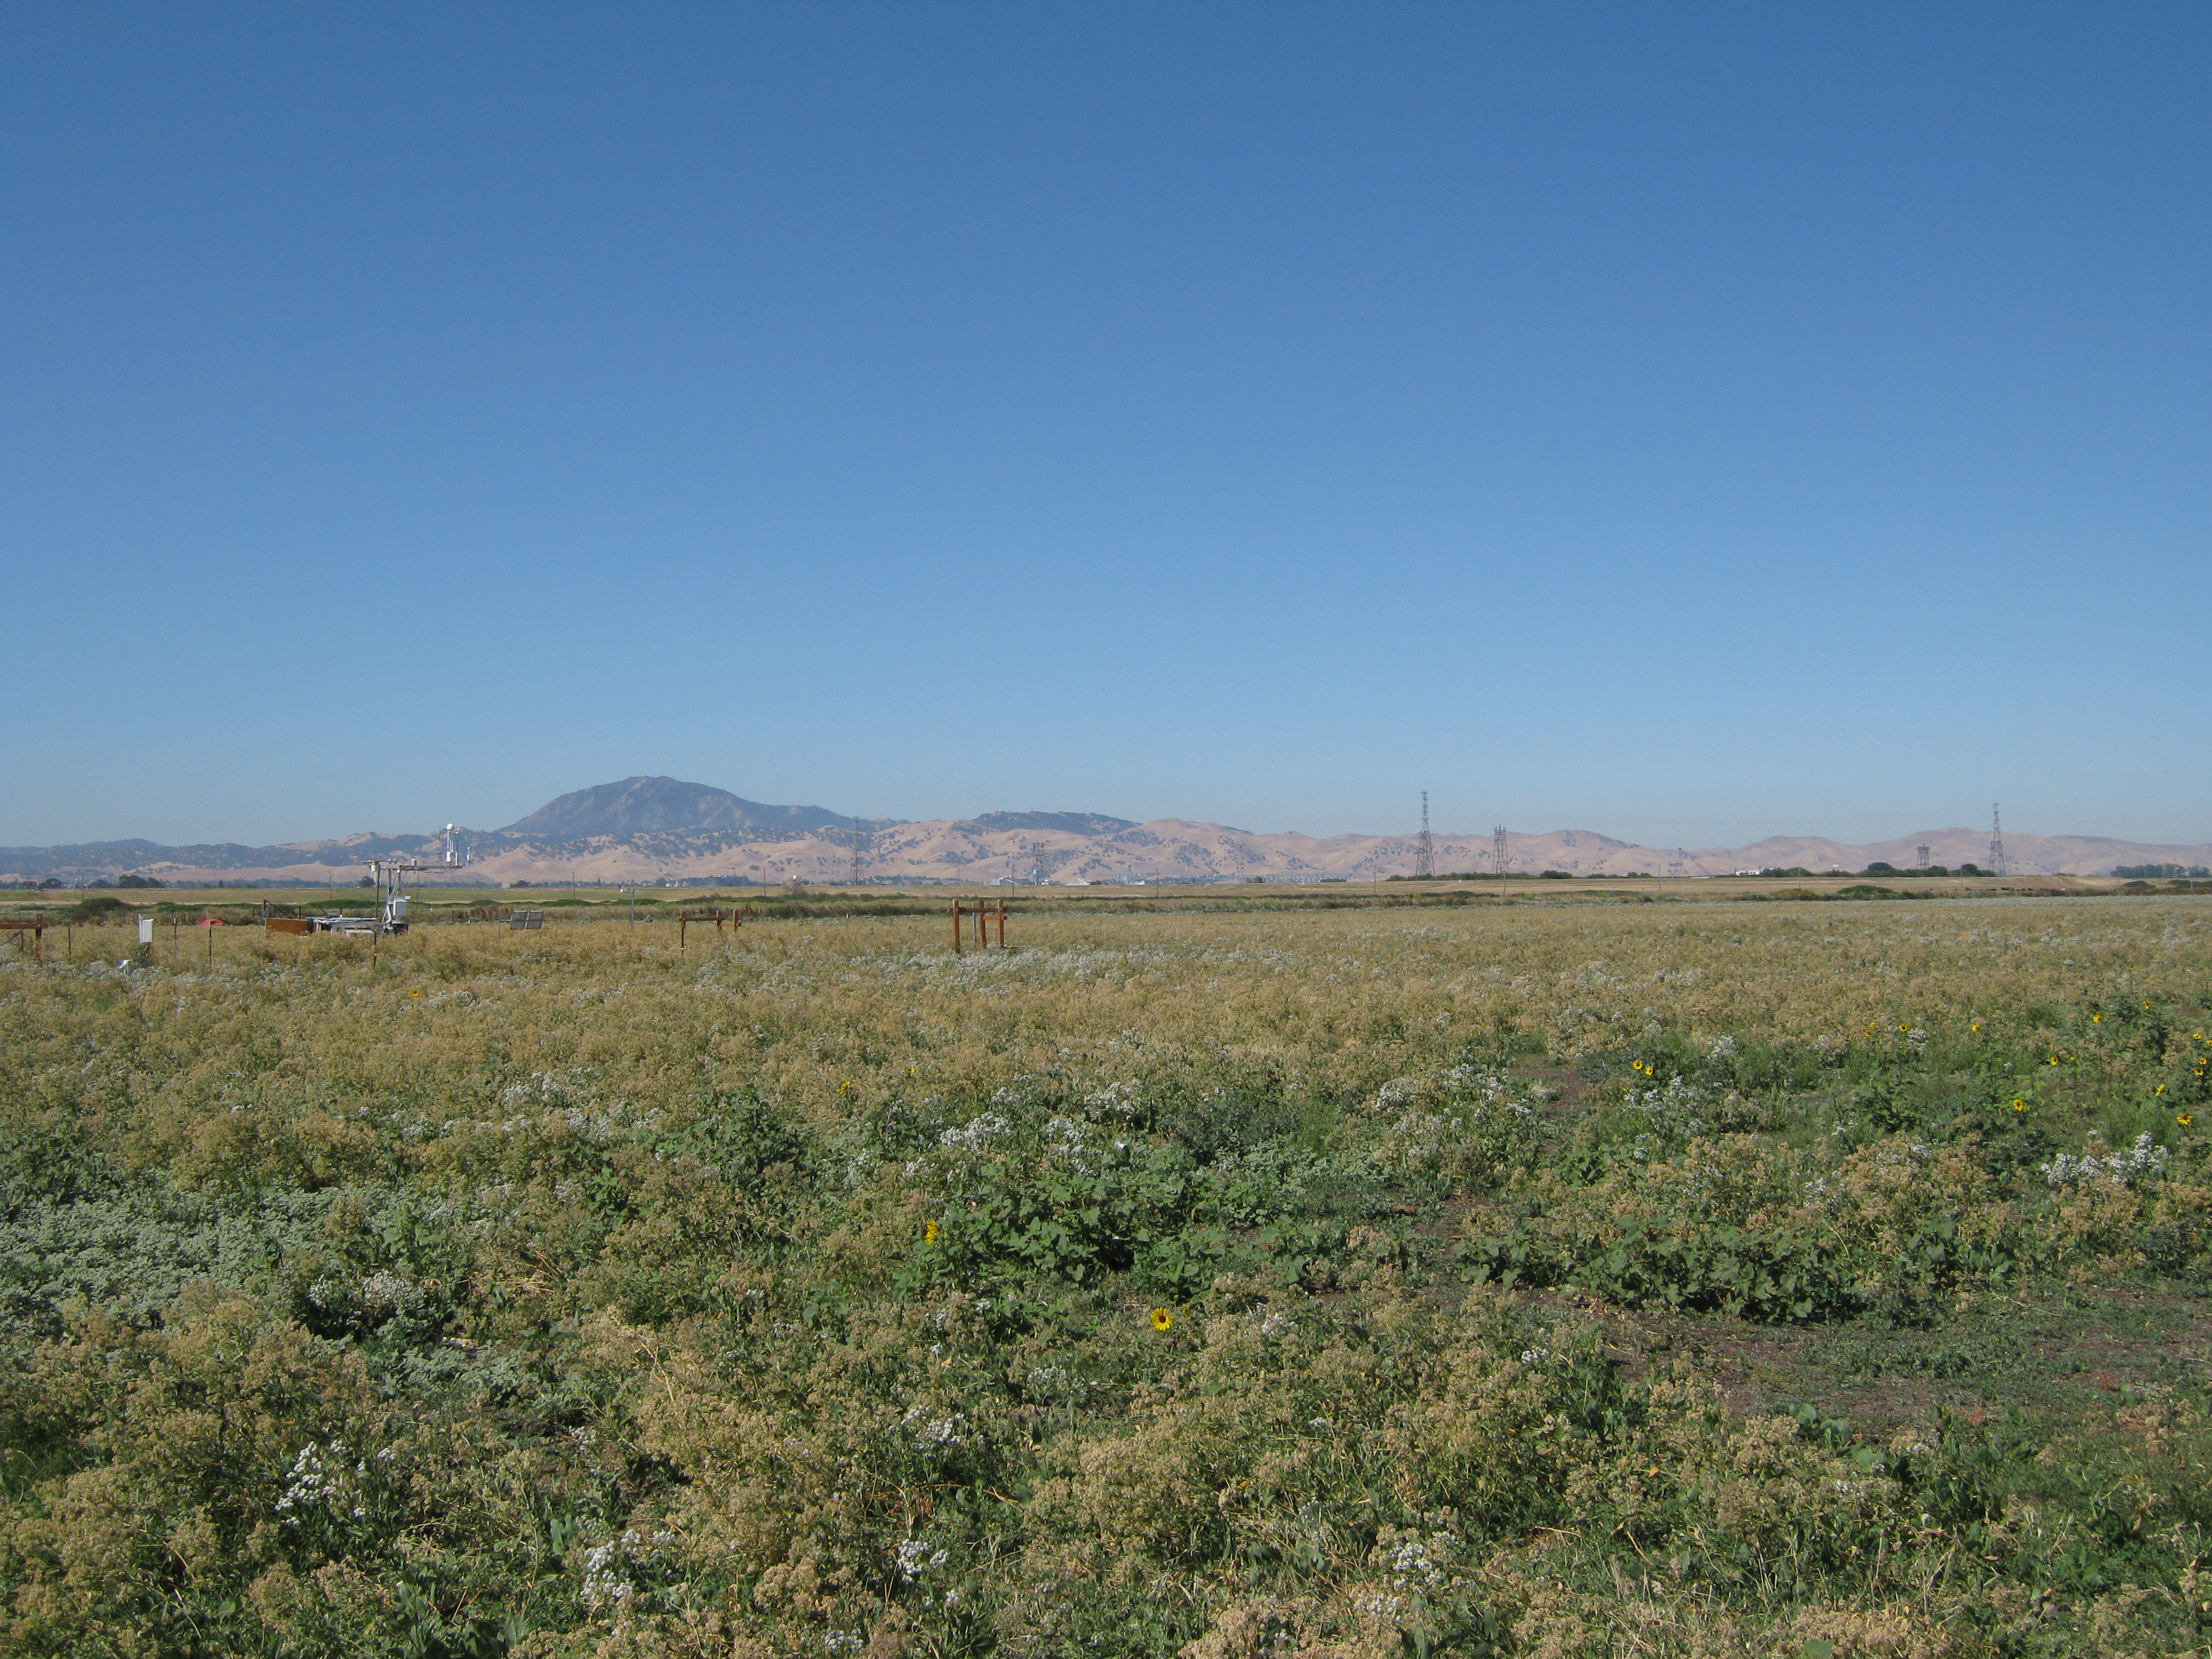
20100714SI_TowerLookingSouth.jpg ( 2010-07-14 10:10:20 ) Full size: 3648x2736
View of Sherman pasture dominated by flowering pepper weed with Mt Diablo in background
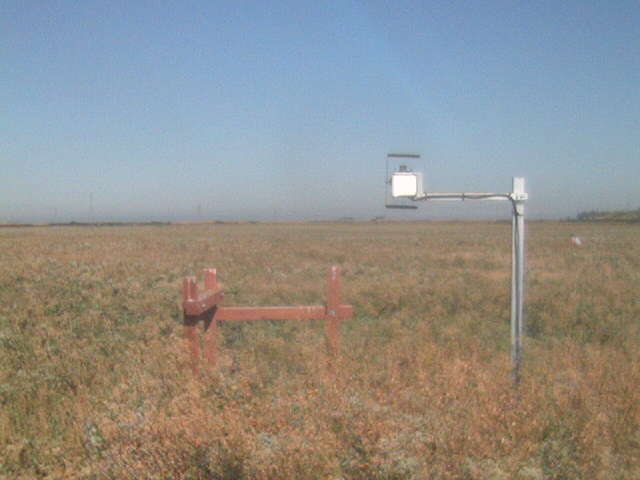
SI_webcam_20101950815.jpg ( 2010-07-14 08:15:02 ) Full size: 640x480
Jaclyn in the field
7 sets found
1 SI_mp graphs found
11 SI_met graphs found
Can't check SI_mixed
2 SI_mixed graphs found
5 SI_flx graphs found
2 SI_soilco2 graphs found
Can't check TWSI_mixed
Can't check SIMBTWEE_met