
Field Notes
<--2012-07-19 10:00:00 | 2012-08-02 10:00:00-->Other sites visited today: Sherman Island | Twitchell Rice | West Pond | DWR Corn
Phenocam link: Searching...
Mayberry: 2012-07-26 08:30:00 (DOY 208)
Author: Joe Verfaillie
Others: Jaclyn
Summary: Moved portable tower, main tower okay, swapped data logger at Tule tower and added CO2 sensors in the water.
| Mayberry
2012-07-26 I arrived about 8:30 PDT with Jaclyn. It was clear, sunny and mild with a gusty wind from the west. The ground and dead grass felt damp from heavy fog. Some of the weeds looked a bit greener than last week. We moved the portable tower from location 2 to location 1. The truck started right up. At location 1, we cleaned and lowered the solar panels. The 7700 was reporting an RSSI of 37. After cleaning it was 68. We did not check the wash reservoir. The sonic was aligned to true north. At the permanent tower all the systems looked okay. Jaclyn cleaned the 7700 mirrors. Cristina arrived with Sara and Carina on their way to Twitchell. Cristina took water samples. My job for the day was to install two Vaisala probes in the water and swap out the Tule CR10X with a 23X. The Vaisala probes were sealed inside porous Teflon socks with Plasti-Dip. When we first dunked the probes in the water some air bubbles appeared. When we put the probes in the water upside down, bubbles appeared from the other end. We decided the bubbles were from air trapped inside the socks escaping as the water pressure compressed the socks. Both probes went inside a PVC case. One probe went on the fence post in the tules and the other went on the fence post in the open water. Both were mounted horizontally at about 10cm (?). I mounted a new enclosure on the southeast corner of the scaffolding at the same level as the existing box. The new box had a 23X and the boards for the CO2 probes. I ran wires to the old box for power and connections to the multiplexors. I moved the water pressure and conductivity sensors to the new box. I rewired some of the other sensors in the existing box moving the IRT sensors to the AM16/32. When I left it all seemed to be running and the two CO2 sensors were reporting about 2500ppm CO2. I cleaned the solar panel on the Tule tower. I might need to use a bigger battery on the tower to support the CO2 probes. |
4 photos found
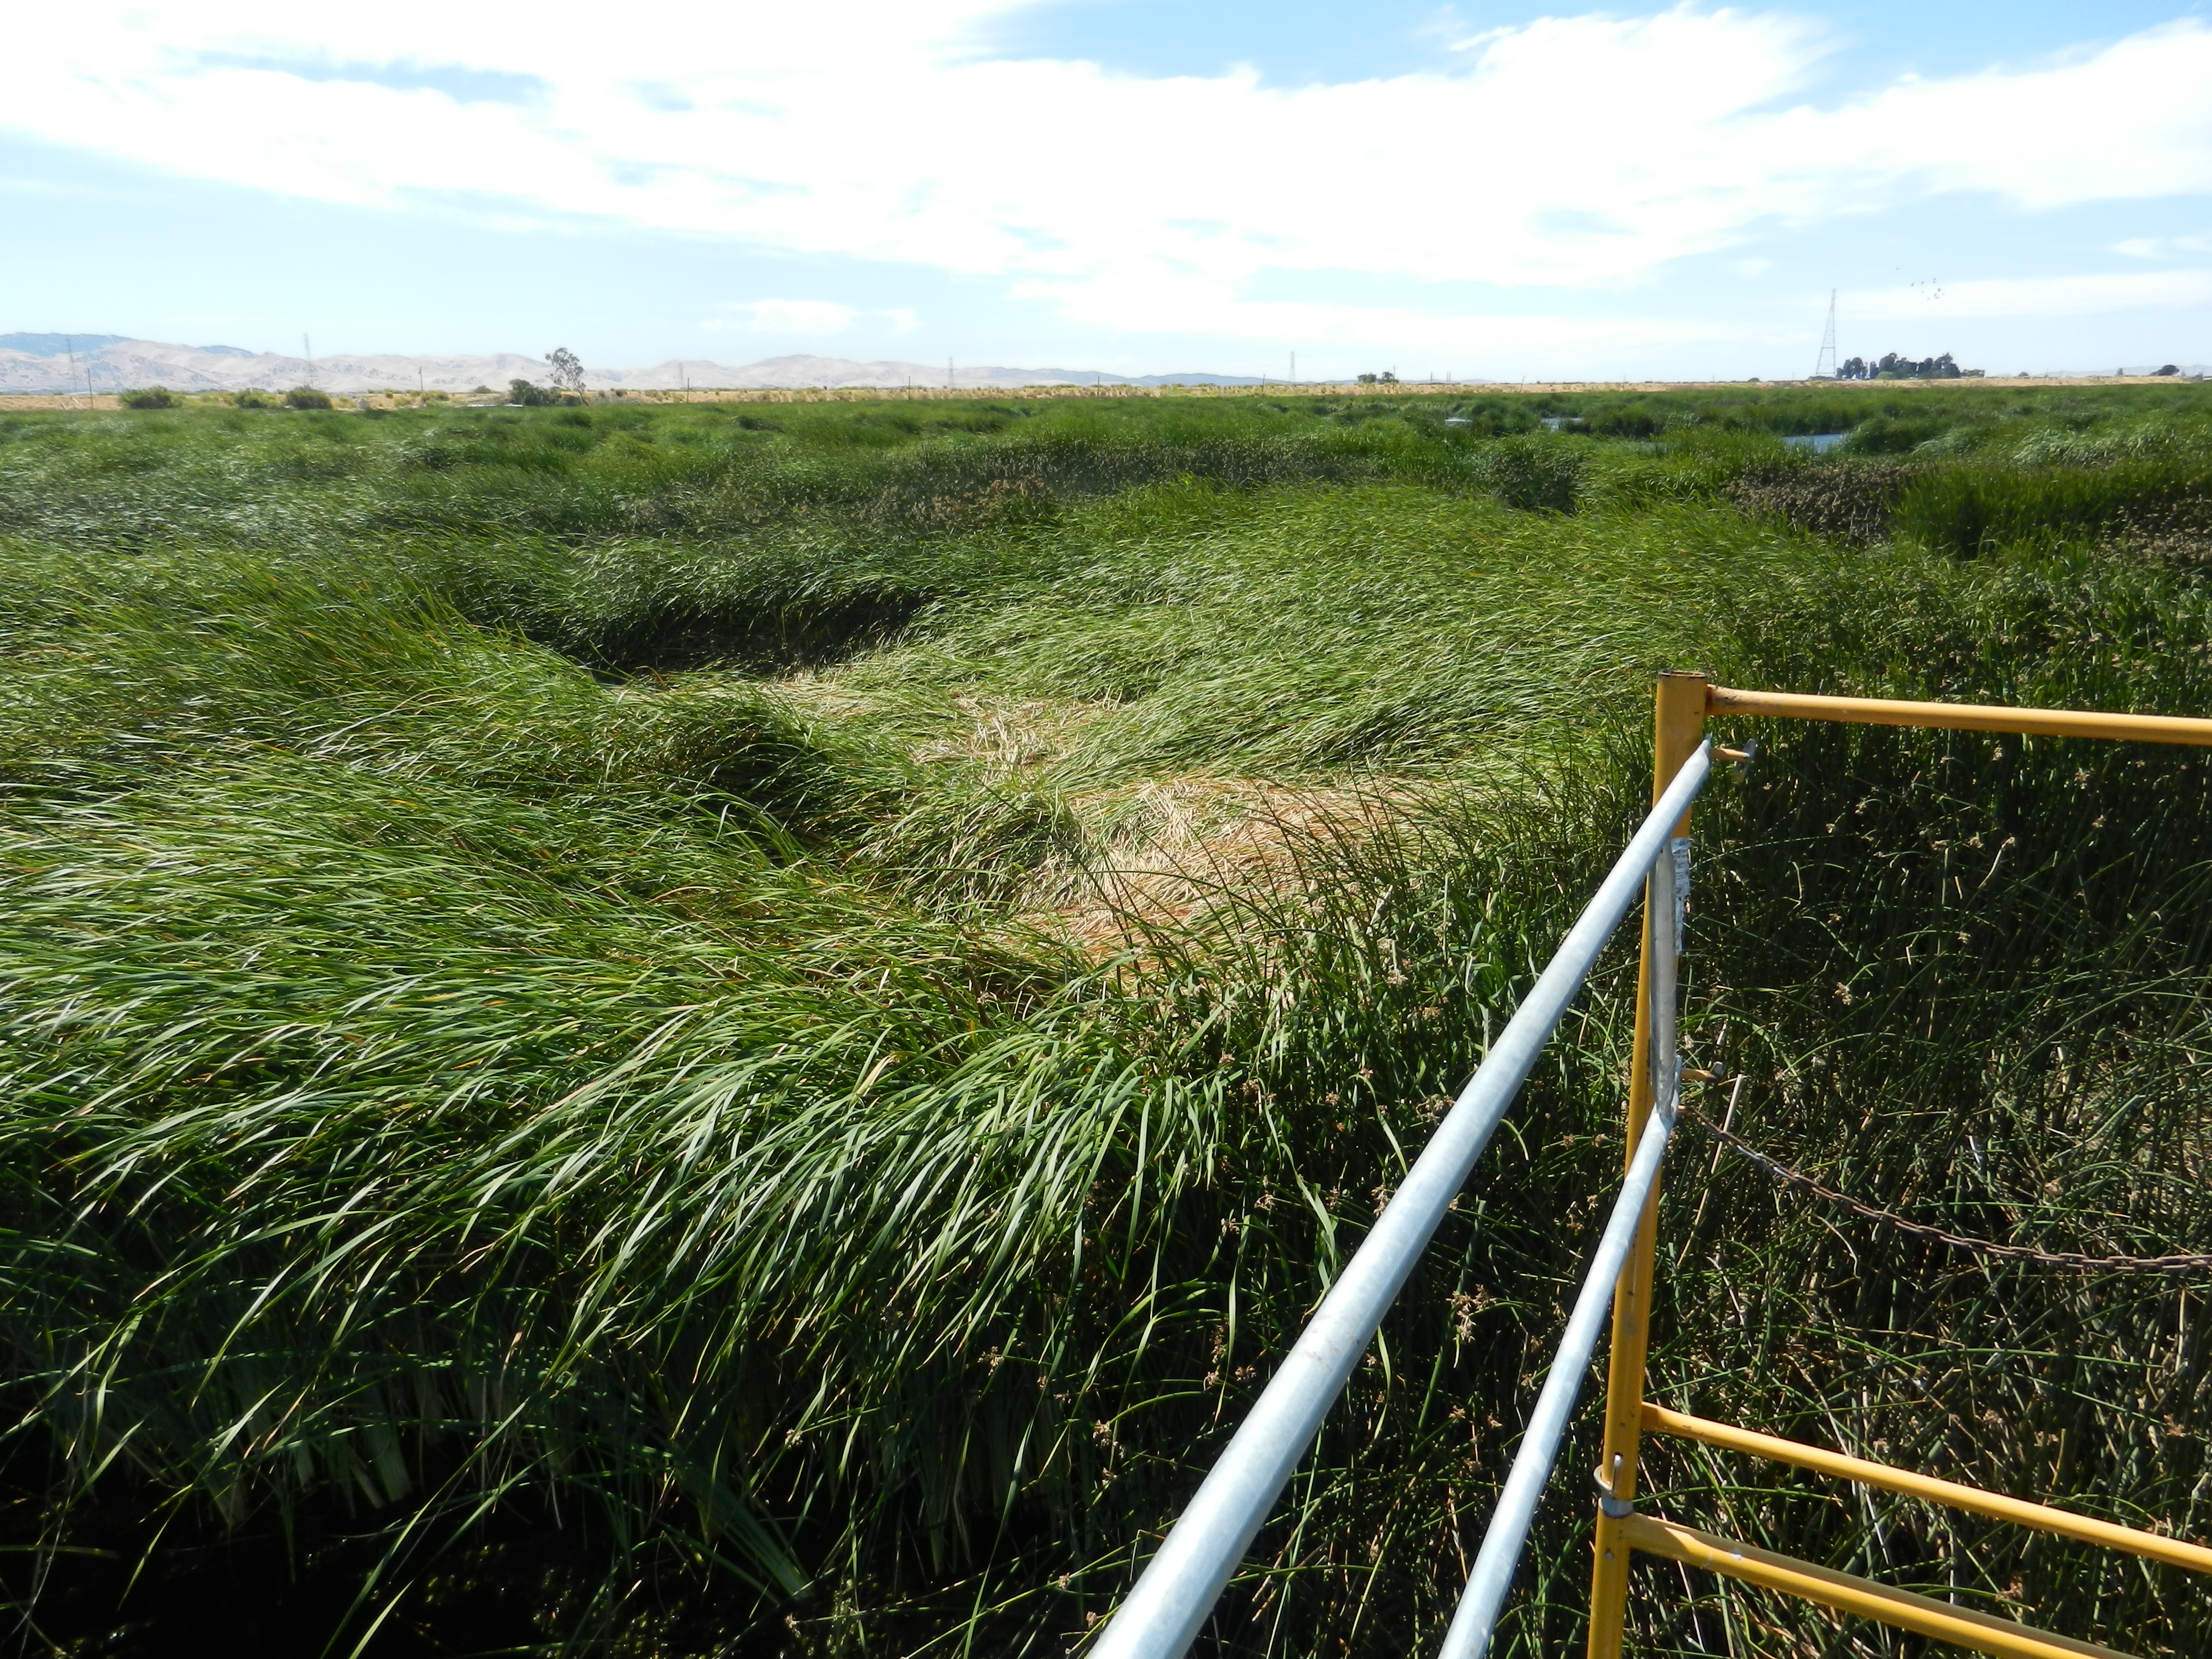
20120726MB_CattailBlowDown.jpg ( 2012-07-26 14:02:22 ) Full size: 4000x3000
Cattails blown down by high winds
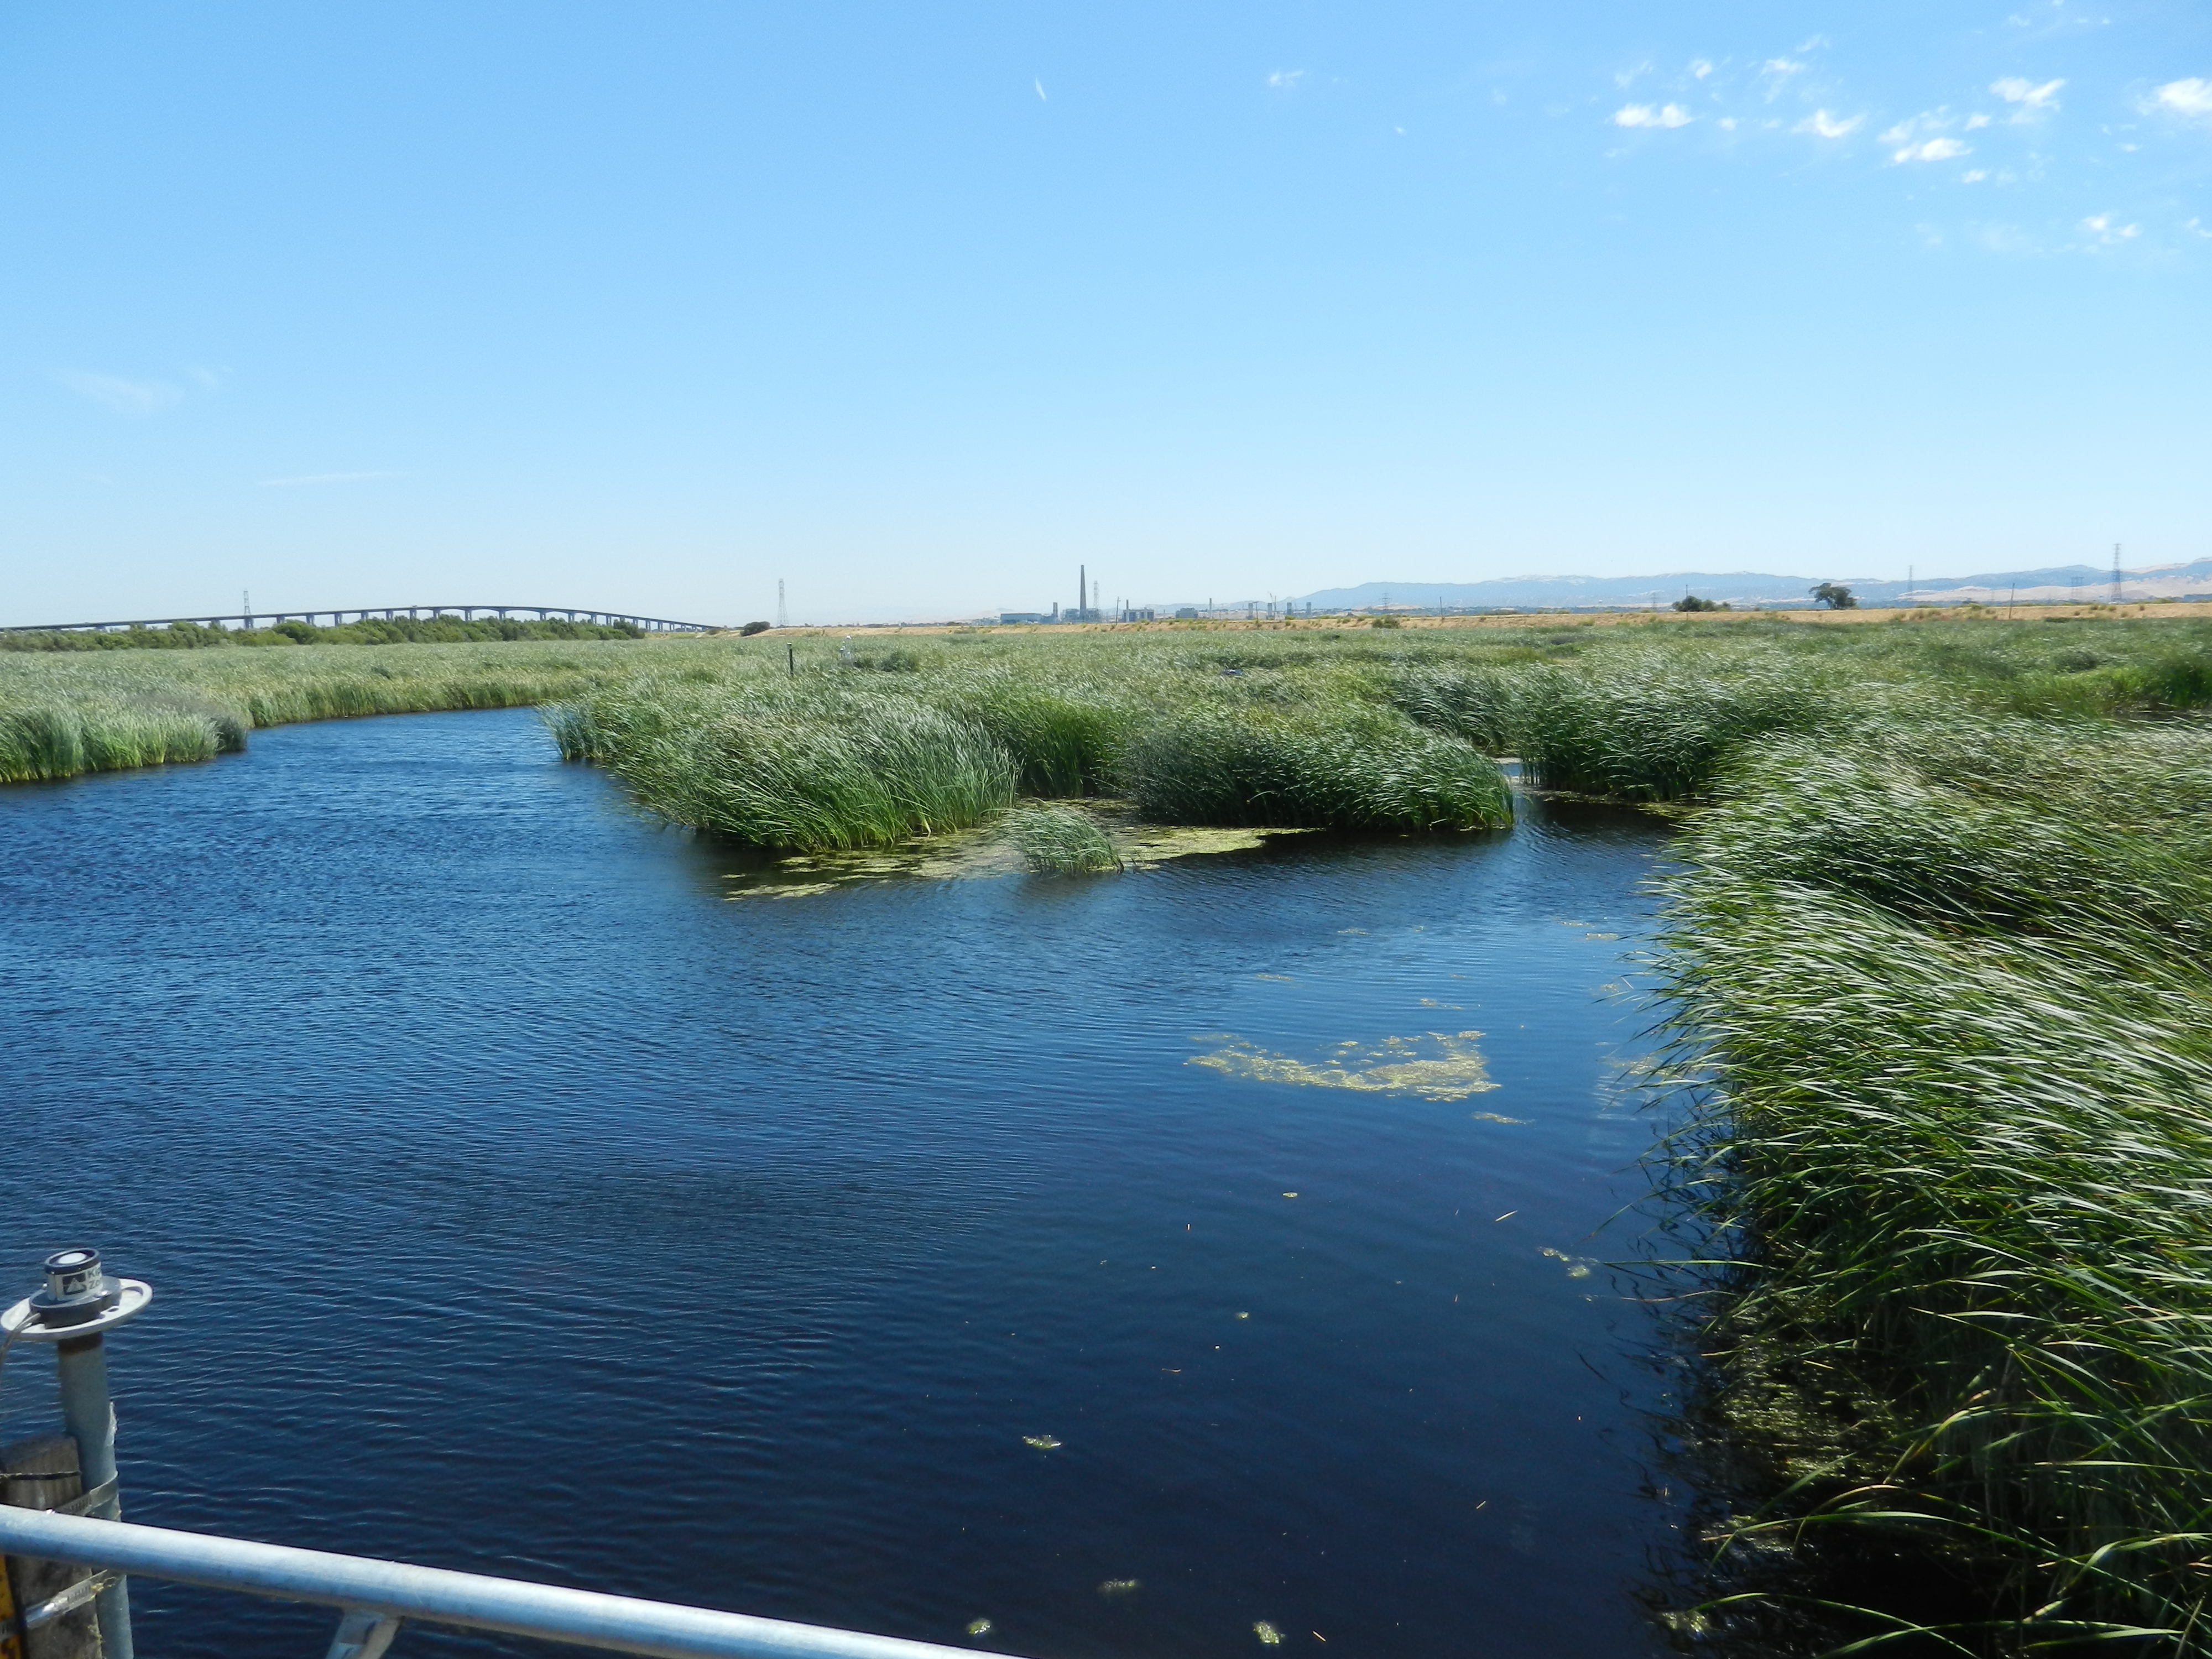
20120726MB_TowerFromTules.jpg ( 2012-07-26 14:03:35 ) Full size: 4000x3000
Cattails at a steep angle from gusty winds
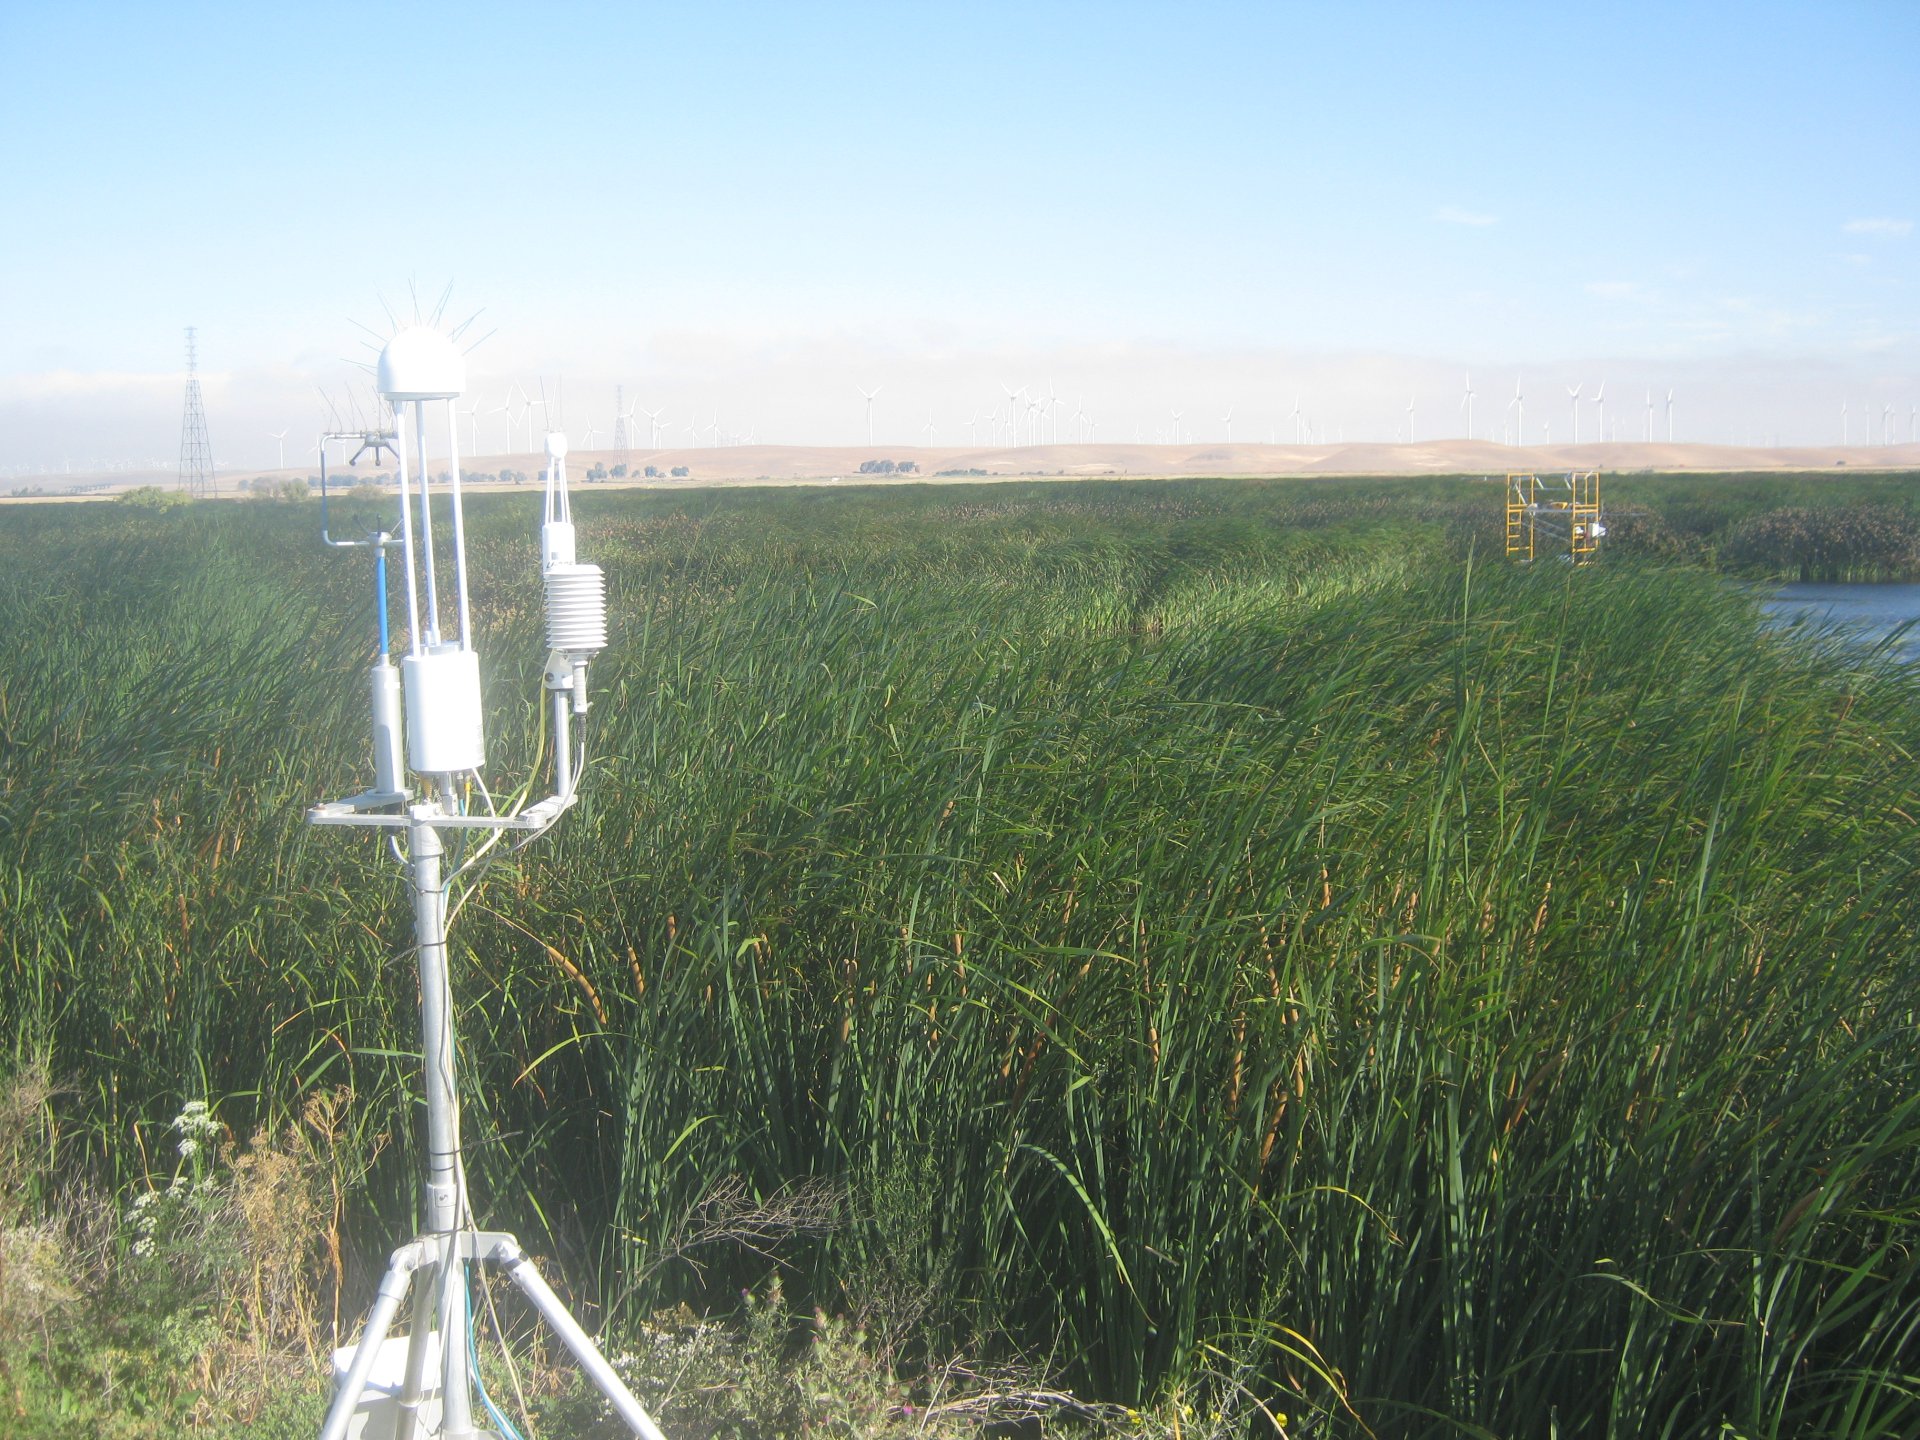
MB_autocam_20120726_1015.jpg ( 2012-07-26 09:15:03 ) Full size: 1920x1440
Joe begins work on Tule Tower
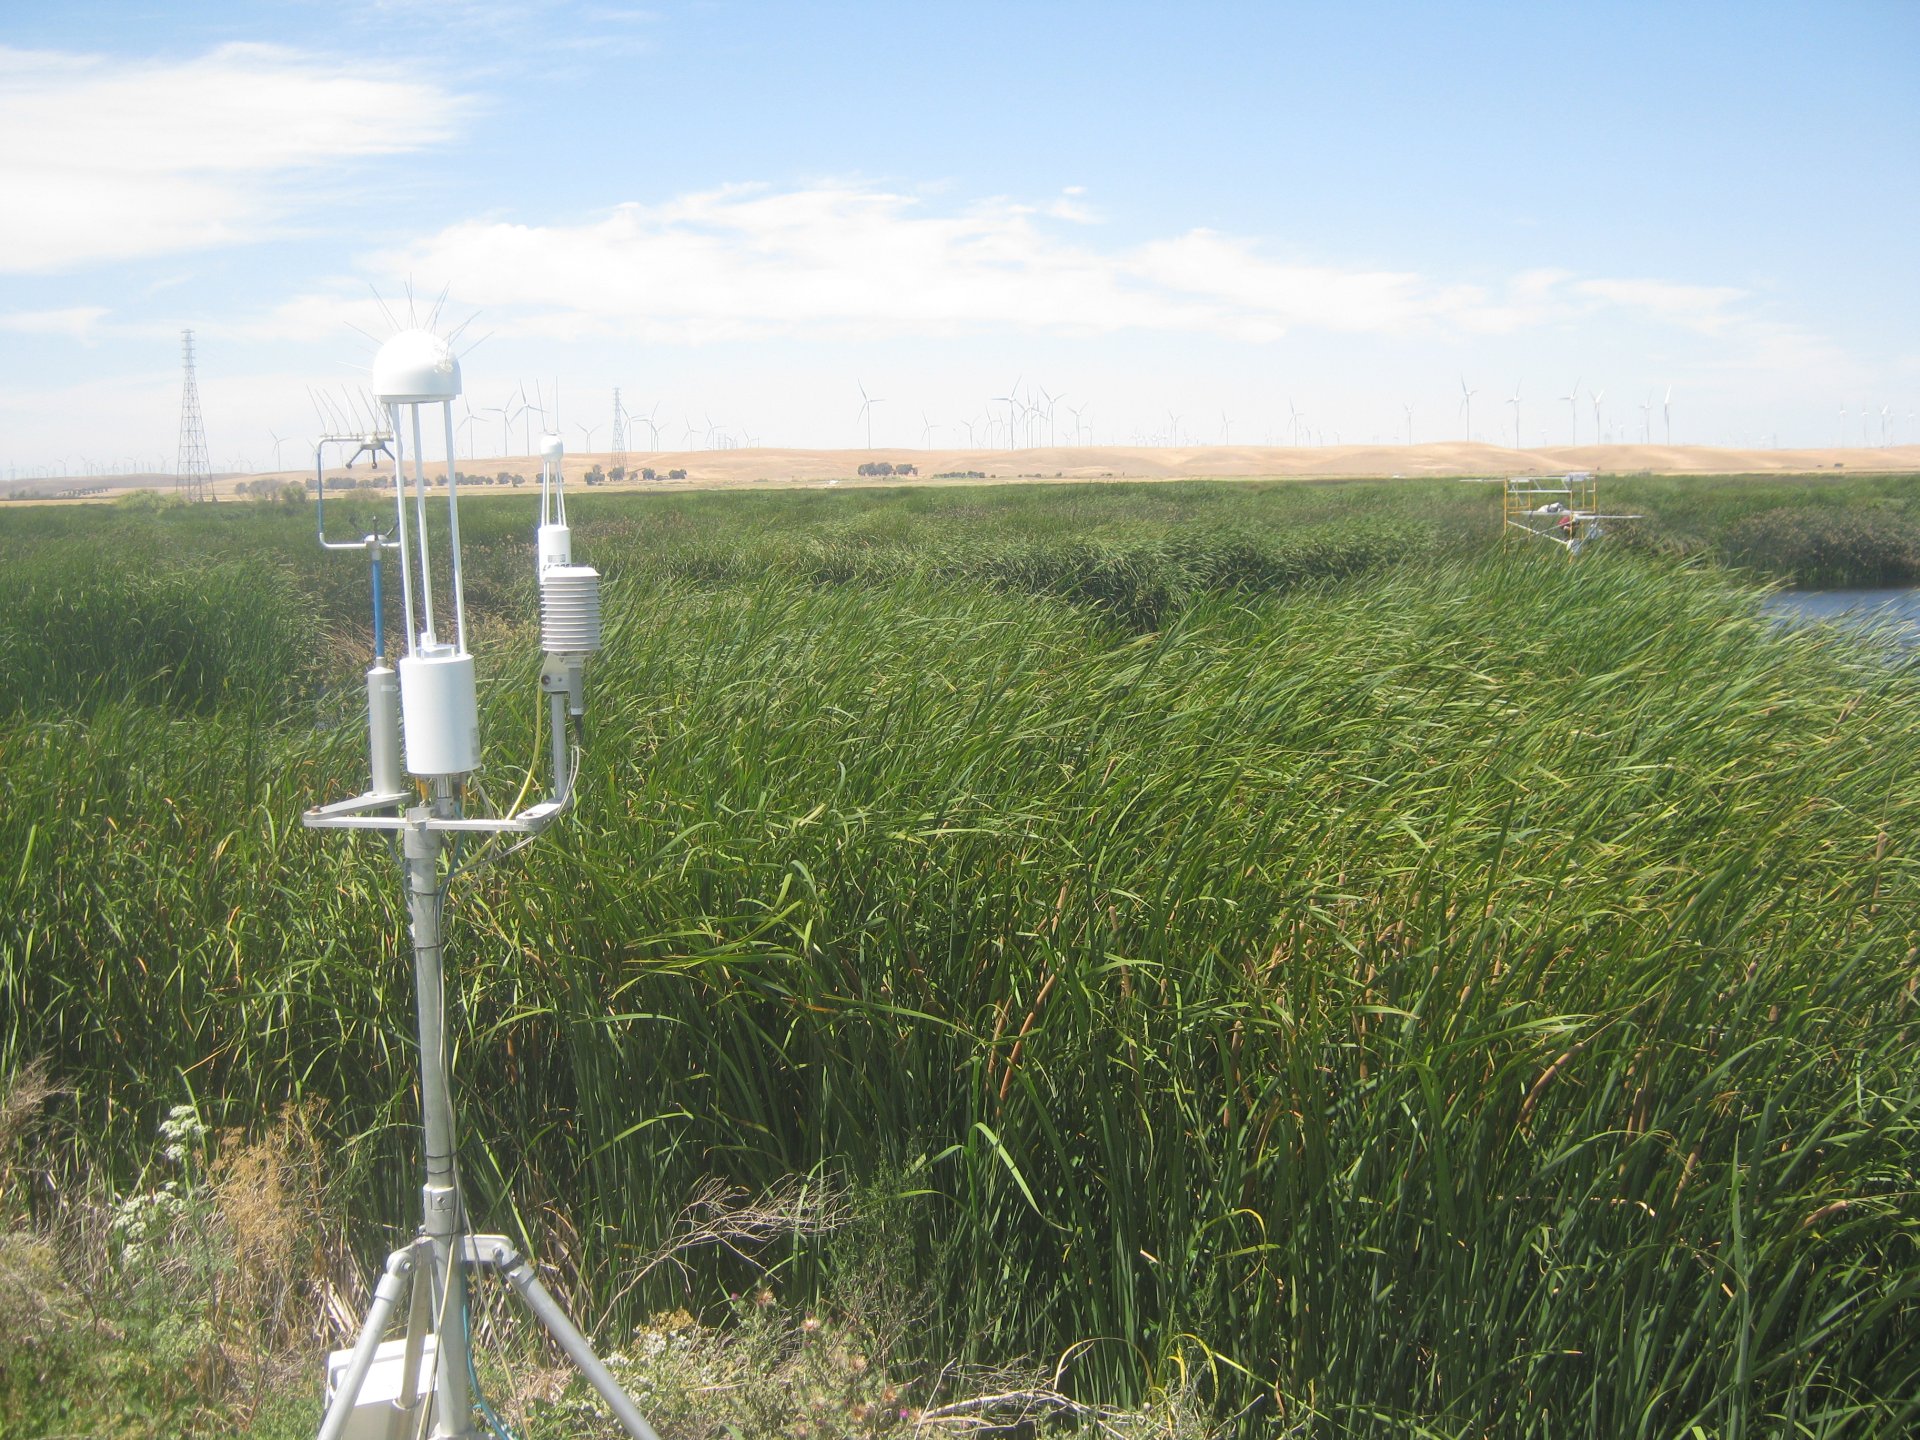
MB_autocam_20120726_1445.jpg ( 2012-07-26 13:45:02 ) Full size: 1920x1440
Joe finishes work on Tule Tower
11 sets found
7 MB_flux graphs found
No data found for MB_met.
28 MB_tule graphs found
Can't check MBWPEESWGT_mixed
1 MB_cam graphs found
Can't check MBEEWPSWEPGT_cam
Can't check SIMBTWEE_met
No data found for MB_minidot.
Can't check MBSWEEWPBCBA
1 MB_processed graphs found
Can't check MB_fd
1 MB_fd graphs found