Field Notes

<--2012-05-04 09:30:00 | 2012-07-10 09:00:00-->
Other sites visited today: Tonzi
Phenocam link: Searching...

Vaira: 2012-05-24 11:30:00 (DOY 145)
Author: Joe Verfaillie
Others: Naama

Summary: EMI survey.

Vaira
2012-05-24

I arrived with Naama about 11:30PST. It was warm and sunny with a nice west breeze. The road puddles are gone, but the water hole is still full. The grass is browning except for the low areas where it is still green.

Naama started the EMI survey, while I checked on the tower. All looked well at the tower.

I finished the EMI survey.

Field Data

No tank data

No VR Well data found

No TZ Moisture Point data found

No VR Moisture Point data found

No TZ grass heigth found

No VR grass heigth found

No VR Tree DBH found

No water potential data found

No VR Grass Biomass data found

No VR OakLeaves Biomass data found

No VR PineNeedles Biomass data found

3 photos found
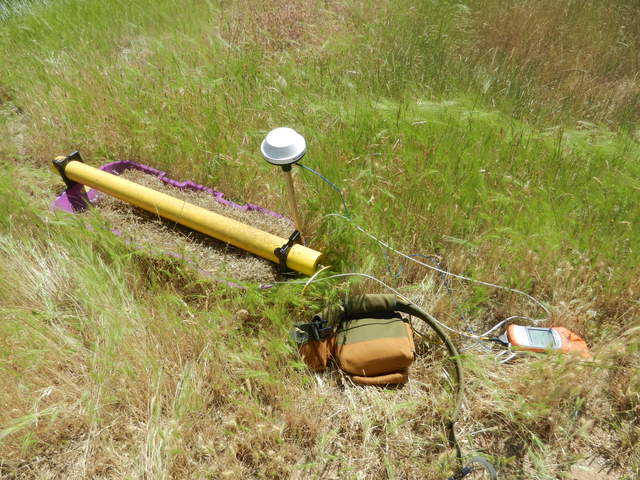
Electro magnetic induction sled
20120524VR_EMI.jpg ( 2012-05-24 14:36:43 ) Full size: 4000x3000
Electro magnetic induction sled
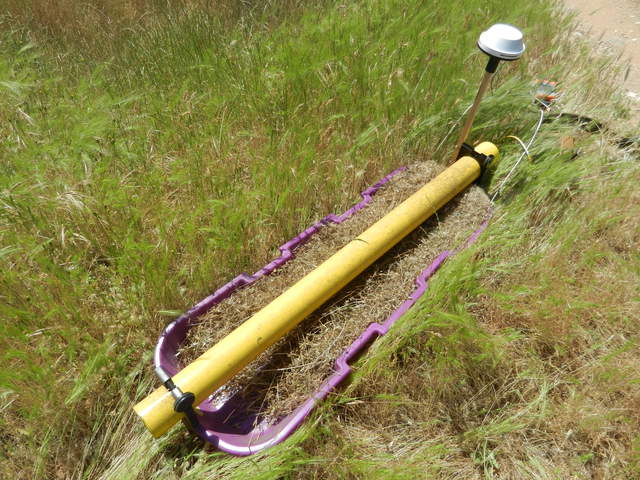
Electro Magnetic Inductance sled full of grass seed.
20120524VR_EMIseedCollection.jpg ( 2012-05-24 14:36:51 ) Full size: 4000x3000
Electro Magnetic Inductance sled full of grass seed.
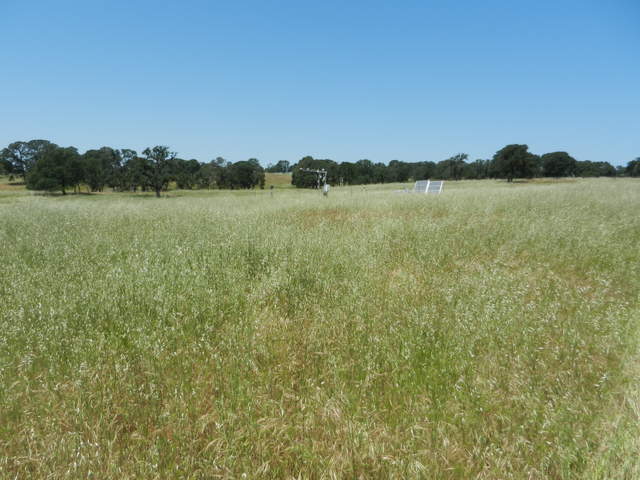
Tall senescing grass at Vaira
20120524VR_Site.jpg ( 2012-05-24 12:49:38 ) Full size: 4000x3000
Tall senescing grass at Vaira

Graphs display:
9 sets found

16 VR_met graphs found

Explore the graph:Temperatures in a new window

Explore the graph:System Power Voltage in a new window

Explore the graph:Soil Temperatures Set 1 in a new window

Explore the graph:Soil Temperatures Set 2 in a new window

Explore the graph:Soil Temperature Set 3 in a new window

Explore the graph:Soil Temperature at -4cm in a new window

Explore the graph:Soil Heat Flux in a new window

Explore the graph:Soil Moisture in a new window

Explore the graph:Photosynthetic Active Radiation in a new window

Explore the graph:Short/Long Wave Radiation in a new window

Explore the graph:LED sensor in a new window

Explore the graph:Vaira PPT in a new window

Explore the graph:Peltier SHF Plates in a new window

Explore the graph:Peltier SHF Temperatures in a new window

Explore the graph:LED NDVI in a new window

Explore the graph:NDVI SRS Raw Data in a new window

2 VR_flux graphs found

Explore the graph:CO2 Density in a new window

Explore the graph:Sonic Wind in a new window

6 VR_soilco2 graphs found

Explore the graph:VR West Eosense Profile in a new window

Explore the graph:VR North Vaisala Profile in a new window

Explore the graph:Soil CO2 West Temperatures in a new window

Explore the graph:Soil CO2 North Temperatures in a new window

Explore the graph:Soil CO2 East Temperatures in a new window

Explore the graph:VR East Vaisala Profile in a new window

No data found for VR_pond.
Can't check TZVR_mixed
No data found for VR_fd.
No data found for VR_processed.
No data found for VR_arable.
No data found for VR_soilvue.