
Field Notes
<--2012-05-17 11:30:00 | 2012-05-25 13:30:00-->Other sites visited today: DWR Corn
Phenocam link: Searching...
Twitchell Rice: 2012-05-21 09:30:00 (DOY 142)
Author: Joe Verfaillie
Others: Sara, Melanie
Summary: Strong wind, field flooded, installed well and last soil temp set, 7550 box not logging - fixed.
| Twitchell
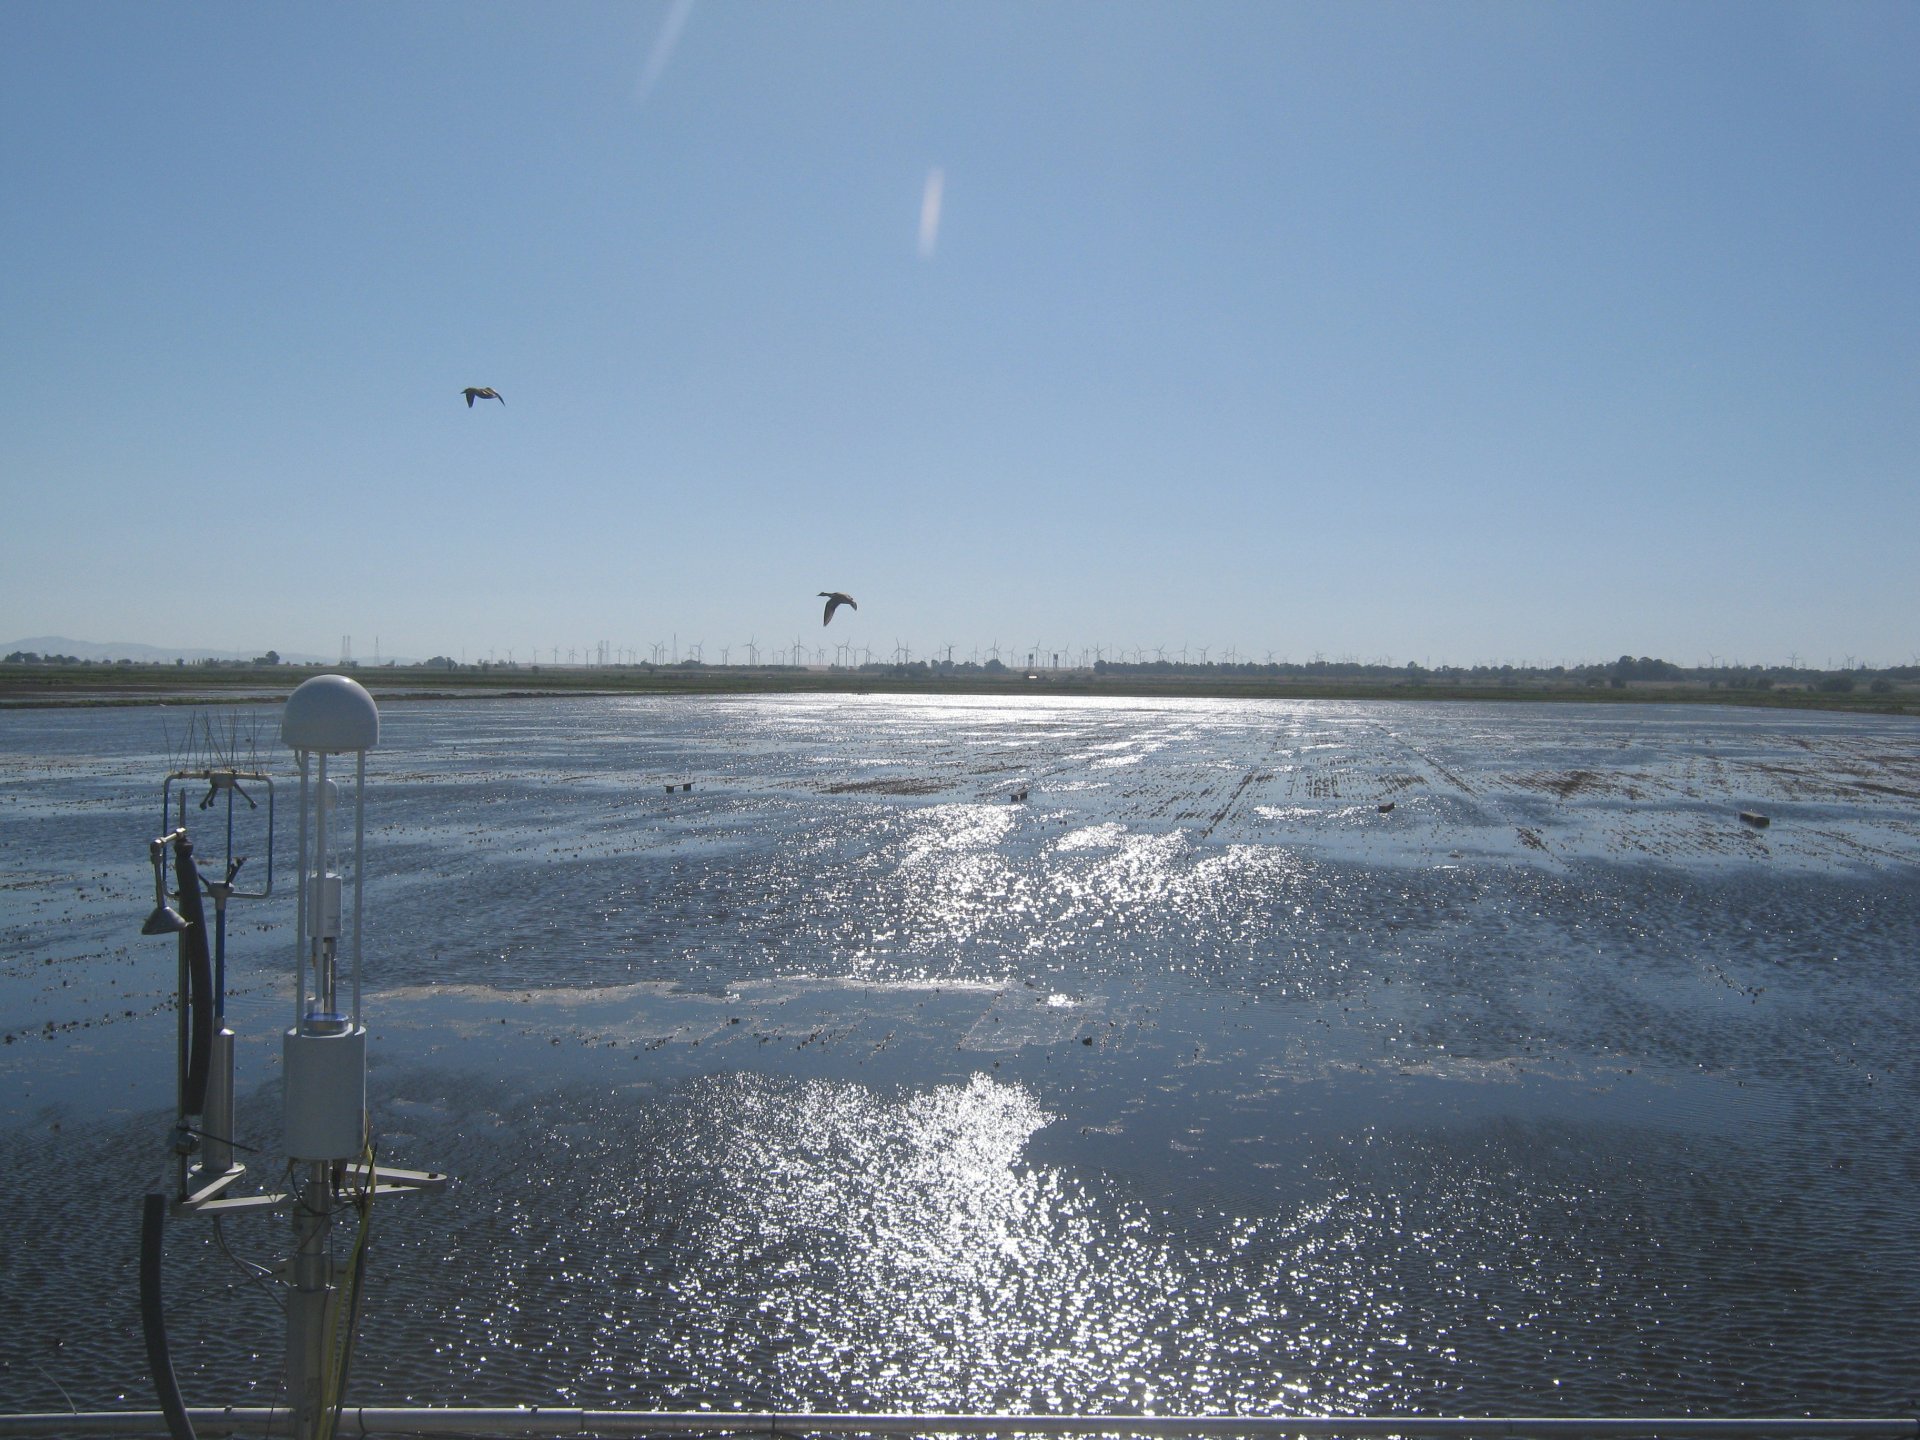
2012-05-21 I arrived about 9:30 with Sara and Melanie. It was clear and sunny with a strong wind (~8m/s) from the west. The field has been planted and is being flash flooded. The northern two checks are full of water but the southern one is still partly free of water. The water near the tower was close to 20cm deep. Sara repaired the broken soil temperature profile stick. I installed the repaired soil temps and the well. The well is at a similar depth as last time, but we will have to make some measurements when they drain the field again. The 7550 box wasn’t logging data. The lights on the panel and the USB stick were not flashing properly and the “logging” panel of the 7550 software reported an error. I pulled the USB memory and copied the data to the field netbook. Looks like data stops on May 10th. I check the USB memory with the computer and got no errors. Reinserting the USB memory did not fix the problem. I pushed the rest button on the 7550 box and it seem to get stuck in a reboot cycle – the ready light never relit. Finally I removed the power from the box and then reconnected it. I may have had to unplug and replug the USB one last time before it worked. When logging correctly the red status light near the USB memory blinks at about 2Hz and every 5 seconds or so the blue light on the USB stick blinks rapidly. The “Logging” tab in the software if also free of errors. I should have swung the radiometers back over the field – next time. |
2 photos found
TW_autocam_20120520_1545.jpg ( 2012-05-20 15:45:02 ) Full size: 1920x1440
Flash flood

TW_autocam_20120522_1245.jpg ( 2012-05-22 12:45:02 ) Full size: 1920x1440
UC Davis on site
6 sets found
12 TW_met graphs found
5 TW_flux graphs found
Can't check TWSI_mixed
Can't check SIMBTWEE_met
1 TW_cam graphs found
Can't check TATWBABCSB_cam