Field Notes
<--2012-05-10 13:00:00 | 2012-05-21 09:30:00-->Other sites visited today: West Pond | Mayberry | DWR Corn | Sherman Island
Phenocam link: Searching...
Twitchell Rice: 2012-05-17 11:30:00 (DOY 138)
Author: Joe Verfaillie
Others: Jaclyn, Emily G
Summary: Quick check, very dirty, field planted, most ground sensors reinstalled. Scouted alfalfa field.
| Twitchell
2012-05-17 I arrived about 11:30 with Jaclyn and Emily G. It was mostly sunny and warm with a strong wind from the west. The fields are being planted and our check seems done. Later we met Jim and he said that we could put the ground stuff in. They will do a flash flood in the next day or two and then let things dry out enough apply an herbicide and fertilizer later. The LI7700’s RSSI was 2 (two). With the wind and the tractor work there’s tons of dust in the air. I cleaned the mirrors and got the RSSI up to about 60. The wash reservoir was almost completely empty – we filled it. We drove along the alfalfa fields to the south looking for a site for a tower. The alfalfa extent is relatively small in the north-south direction and there are some gas wells to the west. Later Jaclyn and Sara and Gavin put in the ground sensors. One of the soil temperature sticks broke and will be replaced next time. The well will also need to go in next time. |
4 photos found

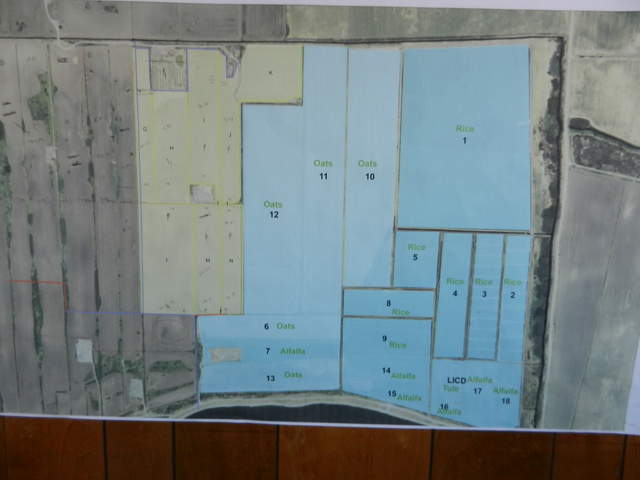
20120517TW_FieldMap.jpg ( 2012-05-17 12:14:14 ) Full size: 4000x3000
Map of the rice fields

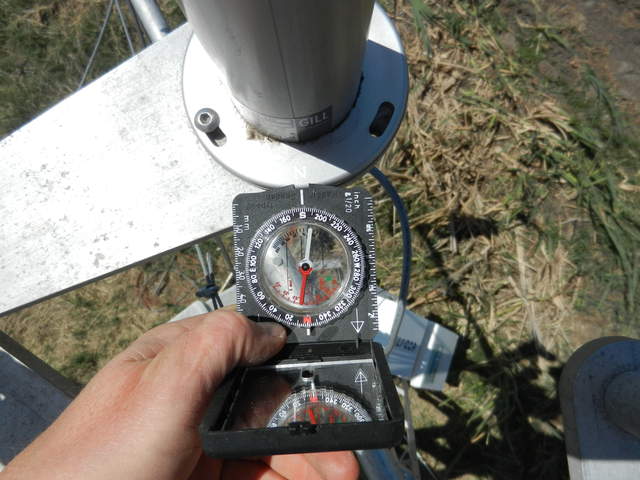
20120517TW_SonicCompass.jpg ( 2012-05-17 11:38:35 ) Full size: 4000x3000
Compass heading of the rice sonic

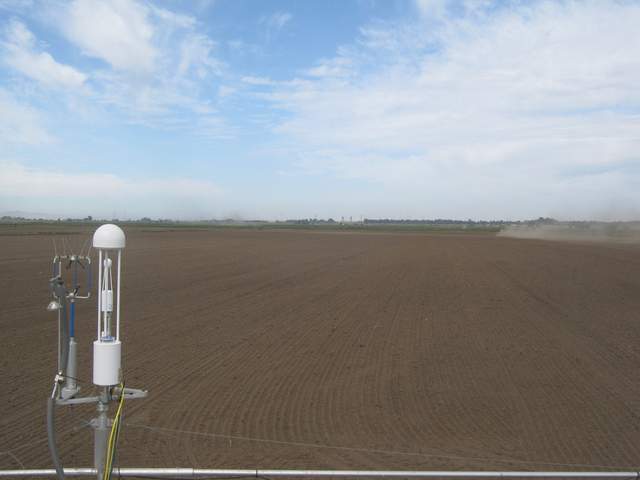
TW_autocam_20120517_0845.jpg ( 2012-05-17 08:45:02 ) Full size: 1920x1440
Planting

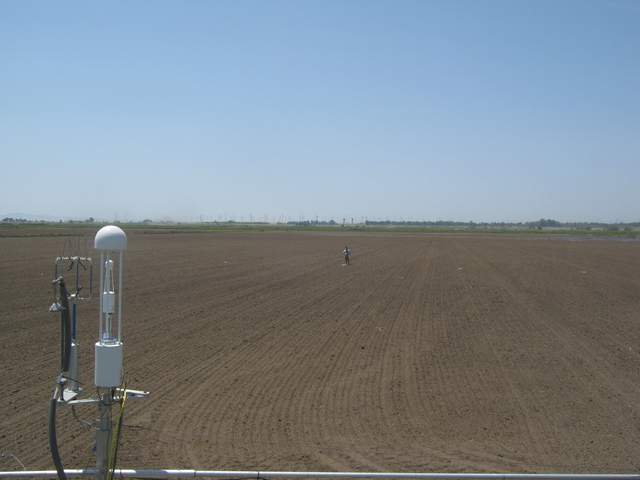
TW_autocam_20120518_1245.jpg ( 2012-05-18 12:45:02 ) Full size: 1920x1440
UC Davis on site
6 sets found
12 TW_met graphs found
5 TW_flux graphs found
Can't check TWSI_mixed
Can't check SIMBTWEE_met
1 TW_cam graphs found
Can't check TATWBABCSB_cam

