Field Notes

<--2012-04-05 10:30:00 | 2012-04-19 11:30:00-->
Other sites visited today: Vaira | Tonzi
Phenocam link: Searching...

Tonzi: 2012-04-19 09:30:00 (DOY 110)
Author: Siyan Ma
Others: Joe, Naama, Laurie

Summary: Sonia and Jessica launching weather ballons, Naama did EMI survey at Vaira, Laurie took soil sample at Tonzi, Vaira computer crashed - removed, Diffuse PAR removed for repair


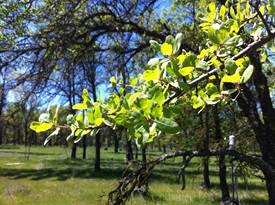
When: Date: 4/19/2012 , Day: 109 , Watch Time: 9:30 am .
Where: Tonzi/Vaira Ranch
Who: Siyan, Joe, Naama, Laurie
ü Sonia and Jessica were launching weather balloons at Tonzi.
ü Naama did EMI survey at Vaira.
ü Laurie collected soil samples for total C and N at Tonzi
Weather: clear, sunny
Phenology: grasses looked strong; oak leaves expanding.

Fresh green oak leaves on a twig

Weather ballon release

Summary
  1. checked and downloaded data at Tower, Floor, and Vaira
  2. Calibrated Li-800 in the field.
  3. Read dendrometers
  4. Soil moisture was not measured due to dead battery.
  5. Measure groundwater well:

Date

DOY

Location

Depth without the black thing (feet)

4/19/2012

109

Floor

24.3


Tower

28.3


roadside

32.8

Vaira_Grass Site
  1. Fence and gate power: 12 v.
  2. Panel and Batteries: - v; - amps; - amps.
  3. Reading from Gillsonic screen before downloading data. (The value of H2O and CO2 should be in the range of 0 – 5 v.)


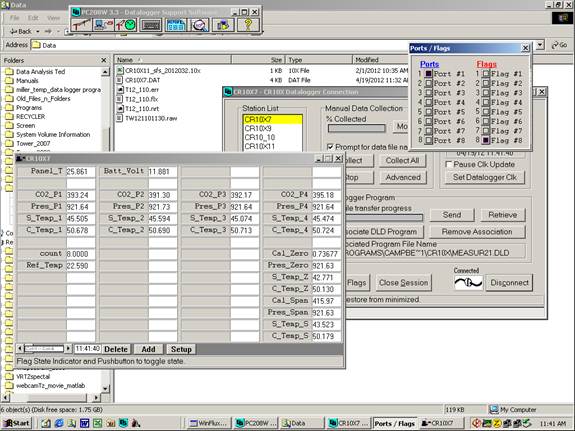
No screen shot taken this time. Computer was dead. Joe took it back to the lab and fixed the following Monday.
  1. downloading data
  2. Check the fans of air temp. and relative humidity sensors at Vaira. YES!
  3. Check MD-9 system connections YES! Check CR23X with two multiplexers

The diffusion sensor caused the problems of multiplexer functioning. Joe fixed the cable of the sensor in the lab.
  1. Check levels of Radiation sensors, clear up surfaces.YES!
  2. Check rain gage, make sure not clogged. YES!
  3. Closed gate and set up fence. YES!

Tonzi_Tower Site

  1. Fence and gate power: 12 v.
  2. Panel and Batteries: - v; - amps; - amps.
  3. Reading from Gillsonic screen before downloading data. (The value of H2O and CO2 should be in the range of 0 – 5 v.)
  4. Tower Gill sonic plots screen before downloading data
  5. downloading data YES!
  6. check the fans of air temp. and relative humidity sensors on the tower and the floor. YES!
  7. Check rain gage, make sure not clogged. YES!
  8. Check calibration cylinders;

Screen shot of Li-800 calibration pre-cal

Screen shot of Li-800 calibration zero pre-cal

Screen shot of Li-800 calibration zero post-cal

Screen shot of Li-800 calibration span pre-cal
Screen shot of Li-800 calibration span post-cal
close gate and set up fence. YES!
Toniz_Floor Site
  1. Fence and gate power: 12 v.
  2. Panel and Batteries: - v; - amps; - amps. (about 7:00 am local time)
  3. Reading from Gillsonic screen before downloading data. (The value of H2O and CO2 should be in the range of 0 – 5 v.)

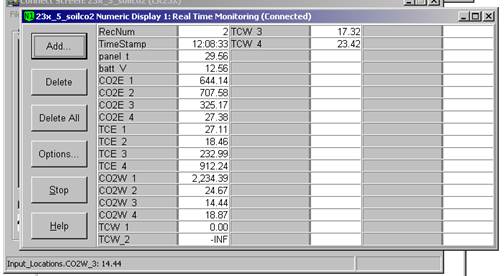
Screen shot will be added later.
  1. downloading data YES!
  2. Check MD-9 system connections YES!

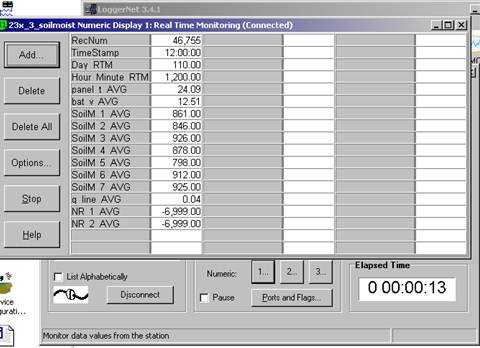
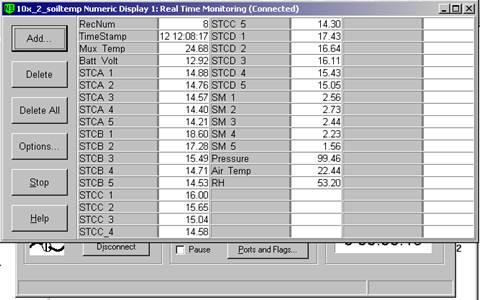
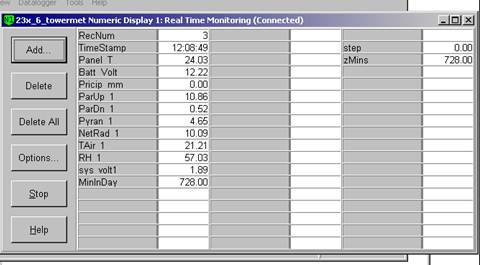
CR23X3 – floor-Met
CR23X6 – tower-Met
CR10X2 – floor-Met
Screen shot of sap flow data logger table

Screen shot of soil moisture data logger table

Screen shot of floor met data logger table

Screen shot of tower met data logger table

Screen shot of soil co2 data logger table
  1. Close gate and set up fence. YES!


Tonzi


Dendrometer


Date

Day

Tag #

Reading (mm)


4/19/2012

109

72

10.2


79

8.9


102

11.3


245

9.1


250

X

(reset to 10.5 on May 7, 2009)


1

19.3


2

16.4


3

16.9


4

23.5


5

23.7


7

7.7

133


8

16.5

11828


71

X


77

X


78

X


248

X

broken


255

X


‌252‌

X


6

X


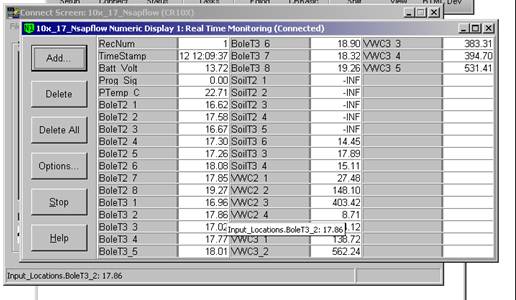
Notes: “X” means not working any more.
Dendrometers installed by Gretchen group
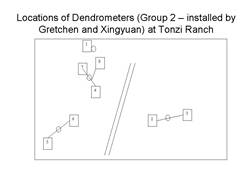
Diagram of dendrometer tree locations

Field Data

No tank data

Well Depth

DateLocationDepth (feet)
2012-04-19TZ_floor24.3
2012-04-19TZ_road32.8
2012-04-19TZ_tower28.3

No TZ Moisture Point data found

No VR Moisture Point data found

No TZ grass heigth found

No VR grass heigth found

Tree DBH

DateTag#Reading (mm)
2012-04-19119.3
2012-04-1910211.3
2012-04-19216.4
2012-04-192459.1
2012-04-19316.9
2012-04-19423.5
2012-04-19523.7
2012-04-1977.7
2012-04-197210.2
2012-04-19798.9
2012-04-19816.5

No water potential data found

No TZ Grass Biomass data found

No TZ OakLeaves Biomass data found

No TZ PineNeedles Biomass data found

4 photos found

Getting ready for a weather balloon launch
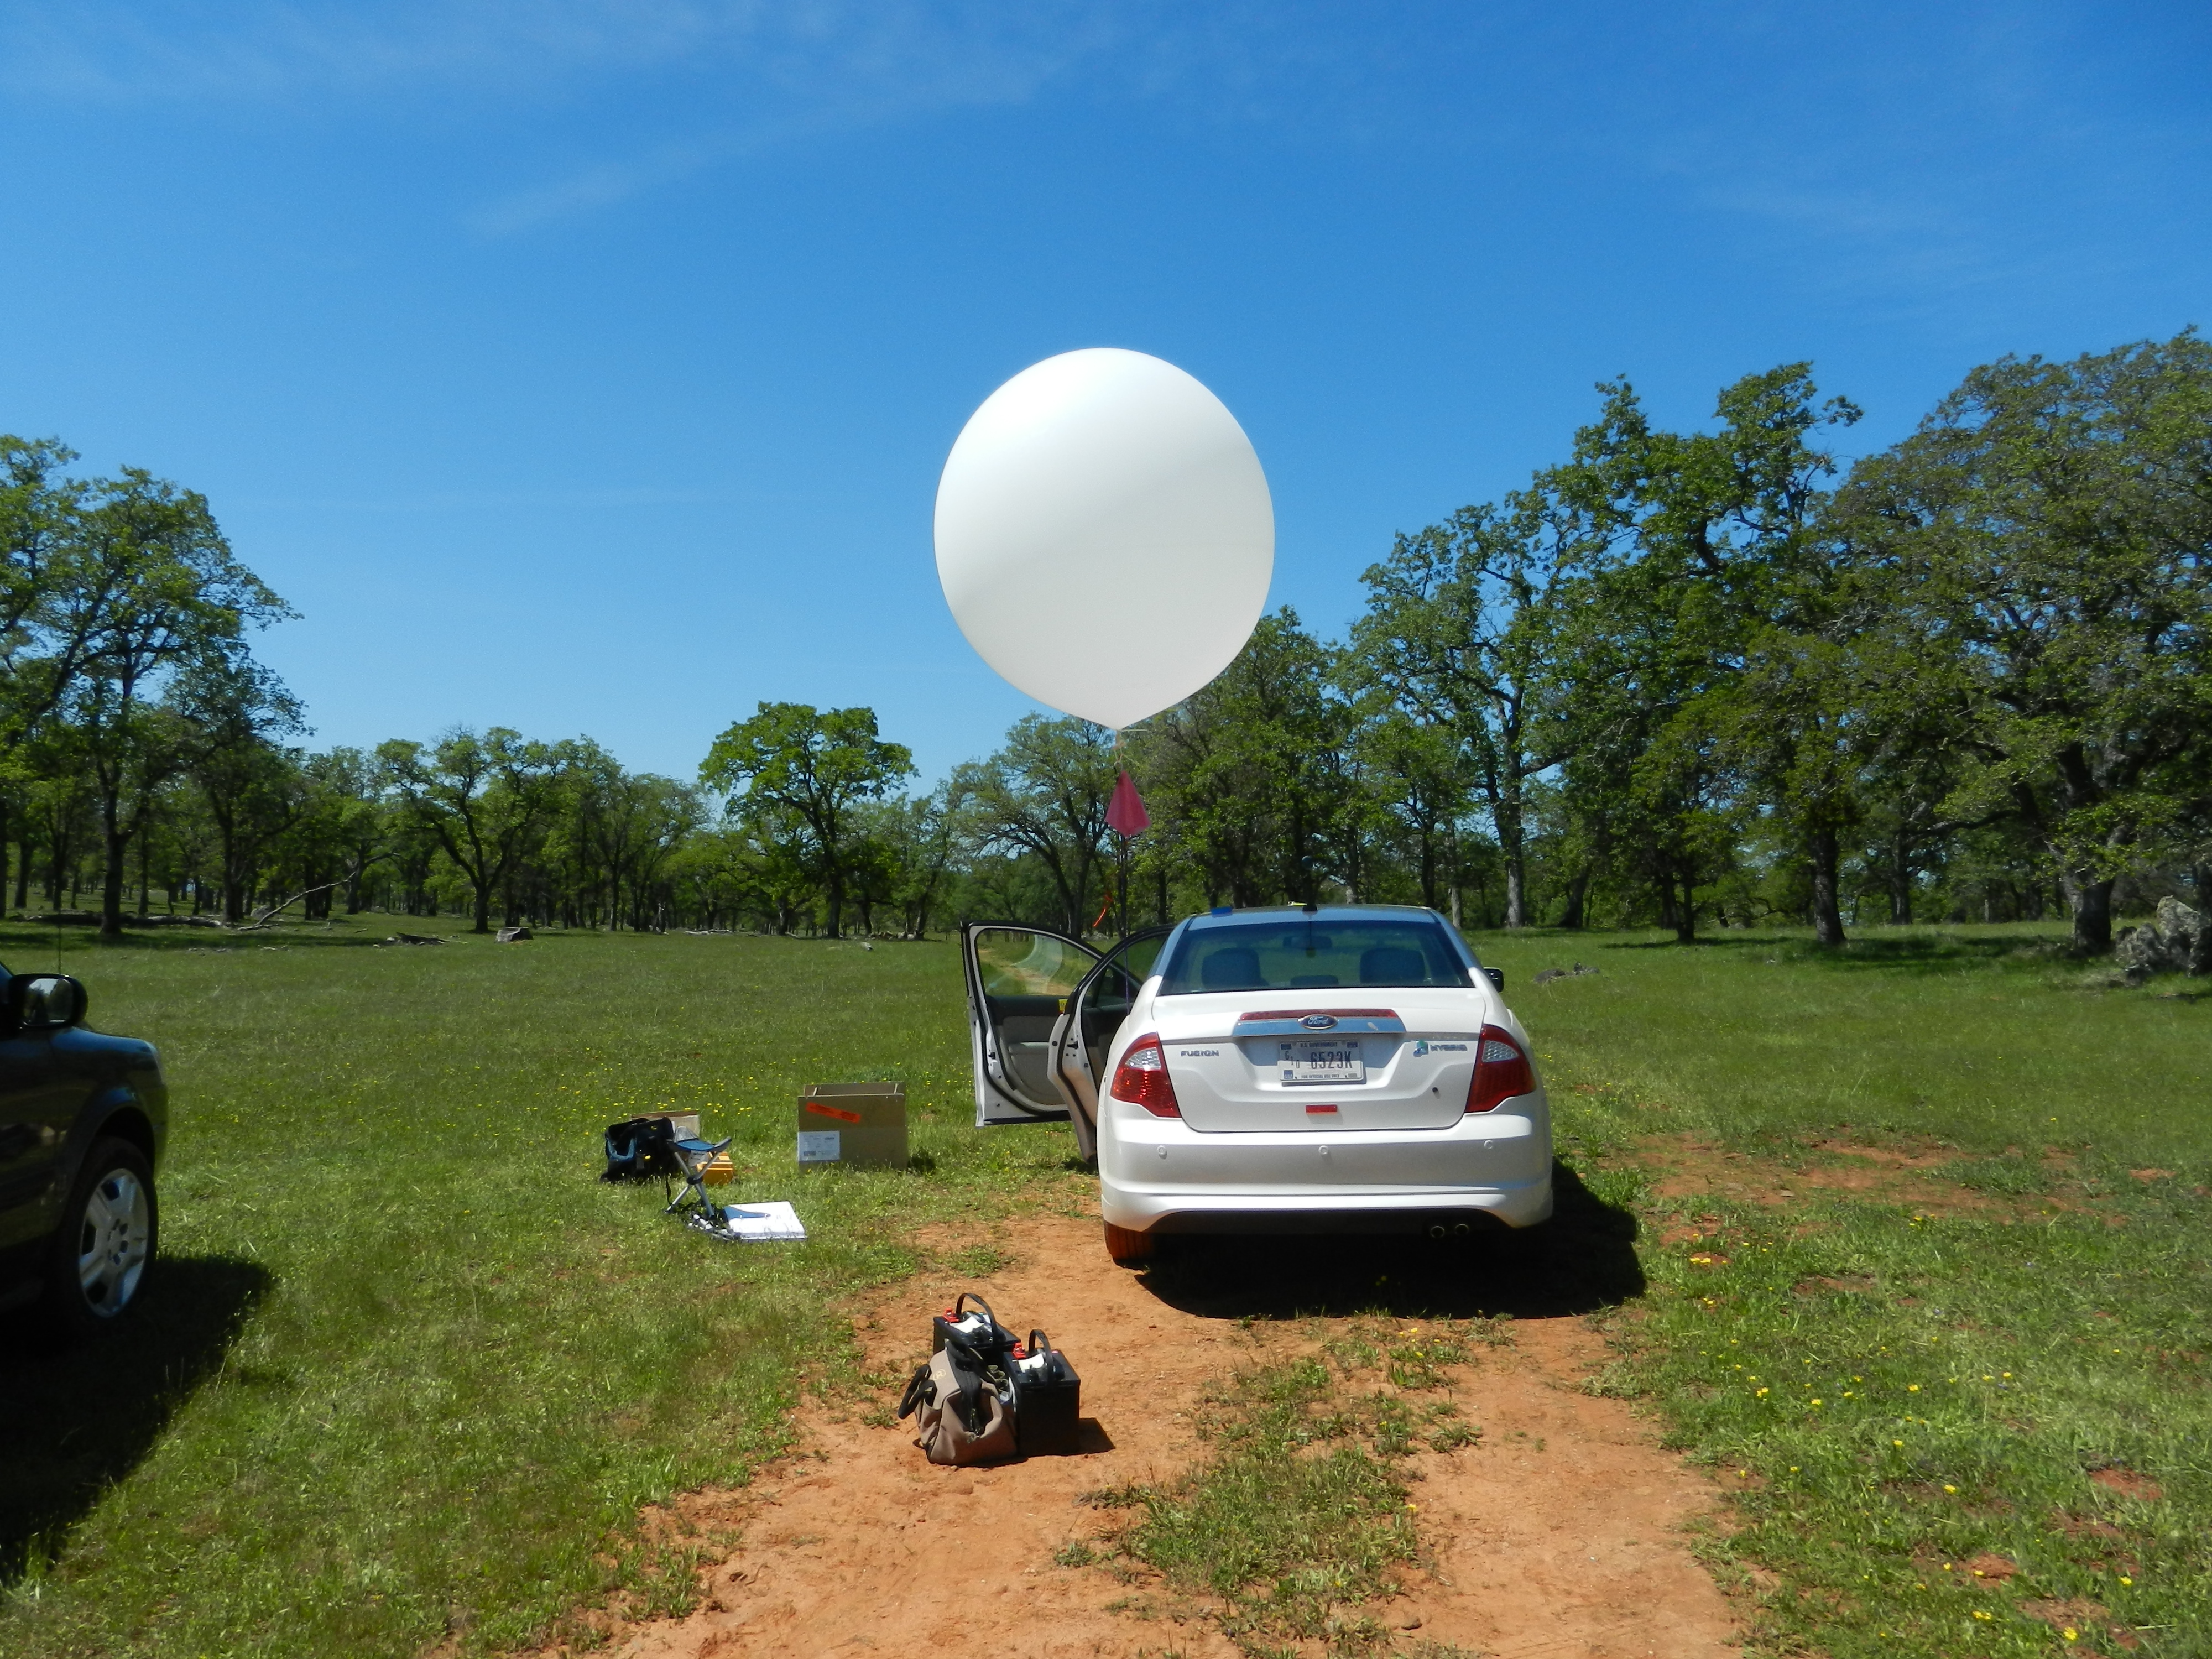
20120419TZ_WeatherBalloon1.jpg ( 2012-04-19 12:12:24 ) Full size: 4000x3000
Getting ready for a weather balloon launch

Getting ready for a weather balloon launch
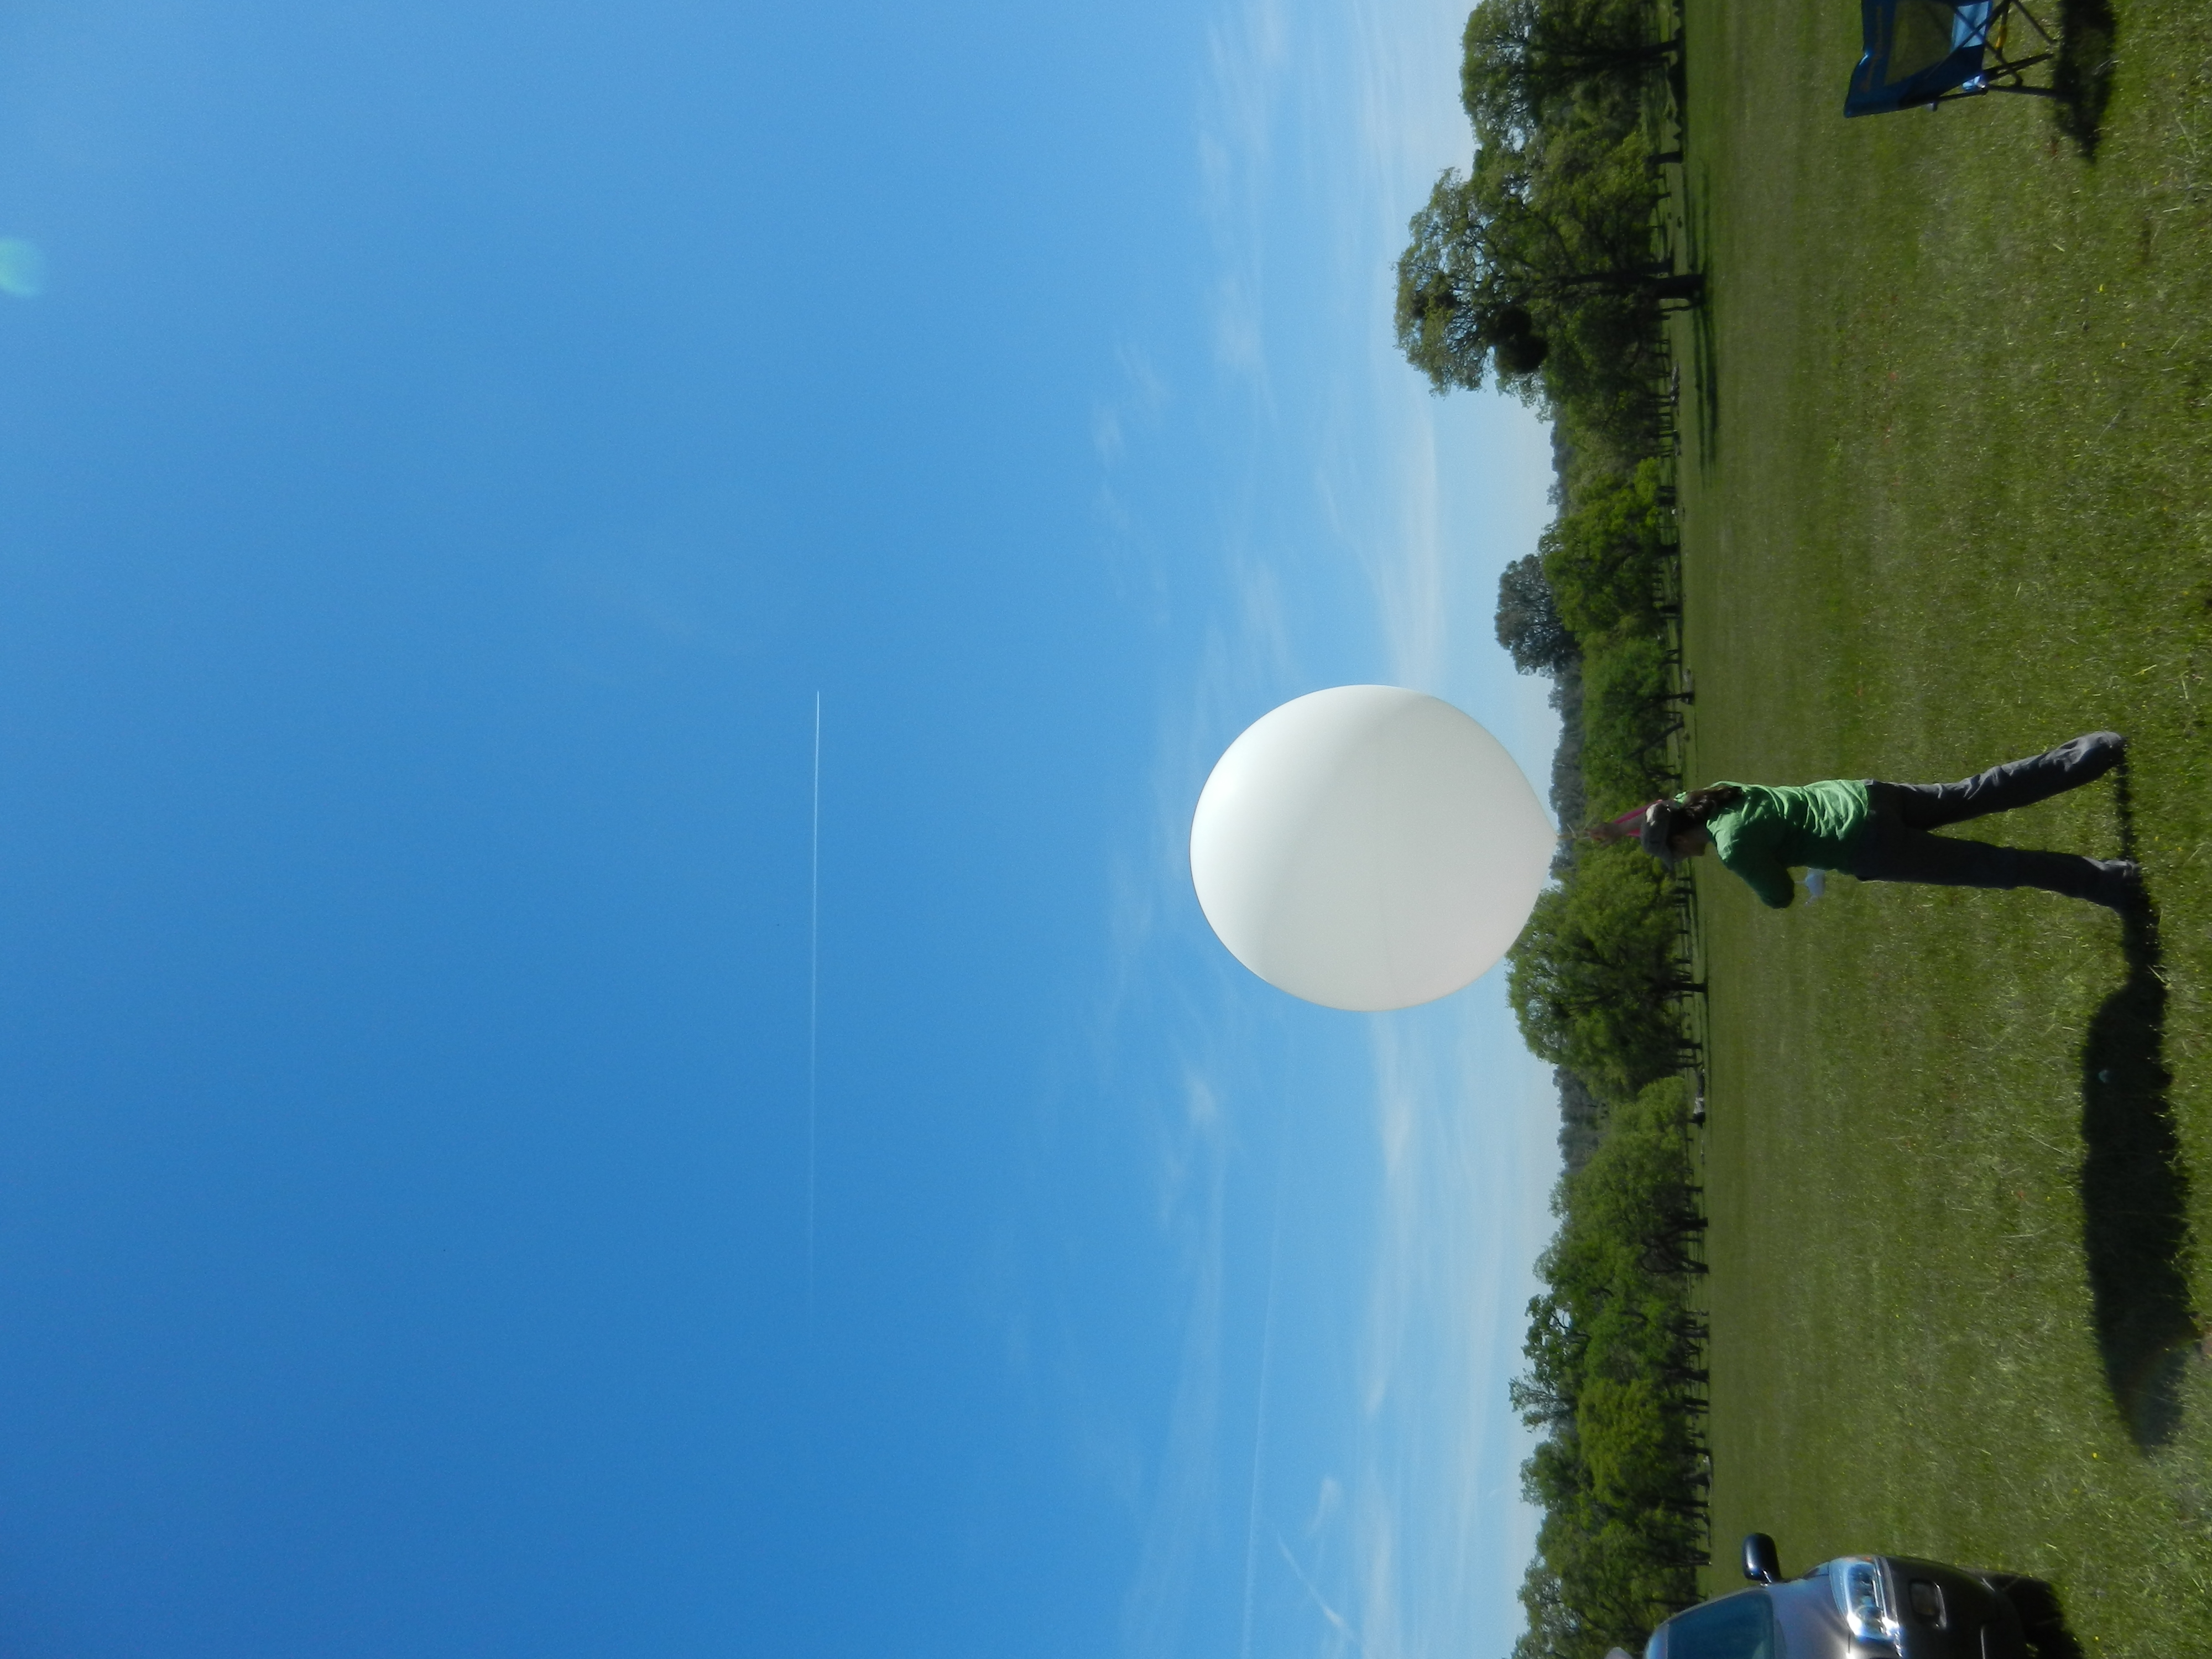
20120419TZ_WeatherBalloon2.jpg ( 2012-04-19 12:28:14 ) Full size: 4000x3000
Getting ready for a weather balloon launch

Weather balloon launch at the oak woodland
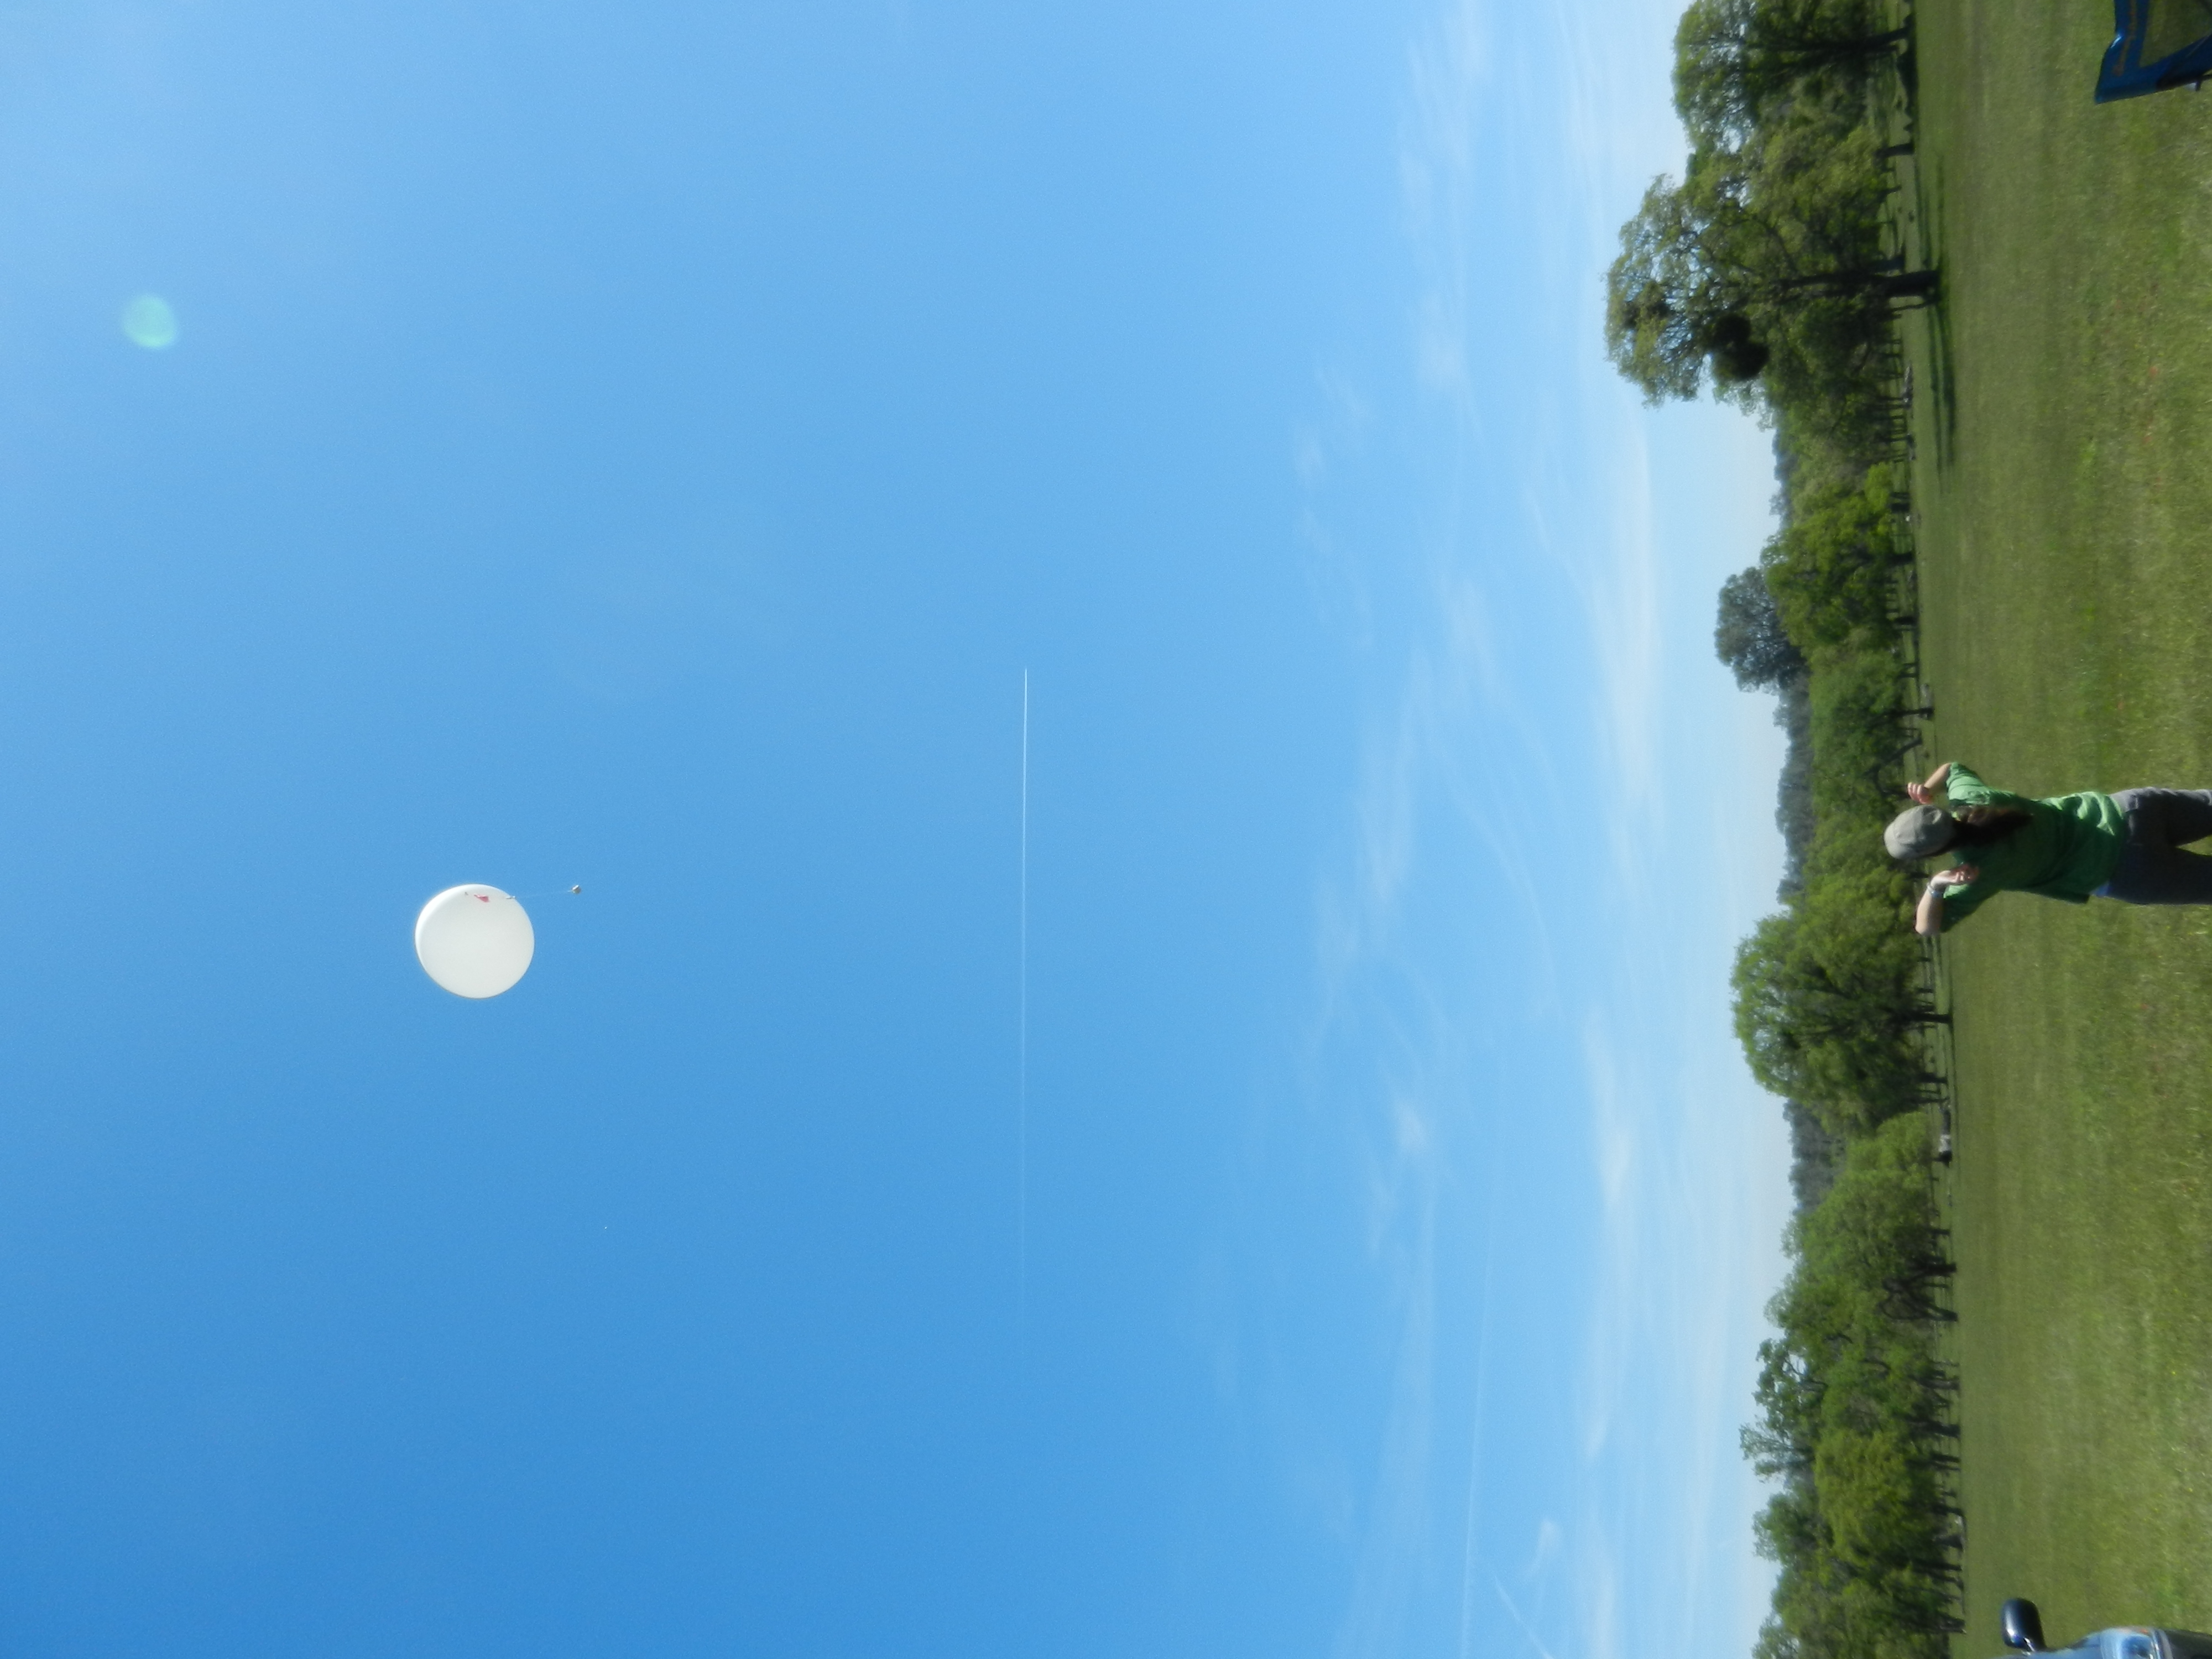
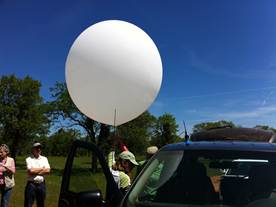
20120419TZ_WeatherBalloon3.jpg ( 2012-04-19 12:28:17 ) Full size: 4000x3000
Weather balloon launch at the oak woodland

Weather balloon launch at the oak woodland
20120419TZ_WeatherBalloon4.jpg ( 2012-04-19 12:28:31 ) Full size: 4000x3000
Weather balloon launch at the oak woodland

Graphs display:
16 sets found

No data found for TZ_Fenergy.
11 TZ_tmet graphs found

Explore the graph:Tonzi Tower Met: Temperature and Power in a new window

Explore the graph:Tonzi Tower Met: Solar Radiation in a new window

Explore the graph:Tonzi Tower Met: IRT Sensors in a new window

Explore the graph:LED Sensor Incoming in a new window

Explore the graph:LED Sensor Outgoing in a new window

Explore the graph:4-Band Solar Radiation in a new window

Explore the graph:Air Temperature Profile in a new window

Explore the graph:Relativity Humidity Profile in a new window

Explore the graph:Tonzi Tower PRI in a new window

Explore the graph:SRS PRI/NDVI in a new window

Explore the graph:SRS NDVI in a new window

11 TZ_soilco2 graphs found

Explore the graph:Tonzi Soil CO2 Profile: Open (East) CO2 in a new window

Explore the graph:Tonzi Soil CO2 Profile: Tree (West) CO2 in a new window

Explore the graph:Tonzi Soil CO2 Profile: Open (East) Temperatures in a new window

Explore the graph:Tonzi Soil CO2 Profile: Tree (West) Temperatures in a new window

Explore the graph:Tonzi Soil CO2 Profile: Upper CO2 in a new window

Explore the graph:Tonzi Soil CO2 Profile: Lower CO2 in a new window

Explore the graph:Tonzi Soil CO2 Profile: Upper Temperatures in a new window

Explore the graph:Tonzi Soil CO2 Profile: Lower Temperatures in a new window

Explore the graph:Tonzi Soil CO2 Profile: Power and Temperature in a new window

Explore the graph:Tree 2 Soil CO2 in a new window

Explore the graph:Tree 2 Soil Temperature in a new window

Can't check TZ_mixed
3 TZ_mixed graphs found

Explore the graph:Tonzi PPT in a new window

Explore the graph:Tonzi CO2 and H2O Densities in a new window

Explore the graph:Air Pressure in a new window

1 TZ_fflux graphs found

Explore the graph:Tonzi Wind Speed in a new window

8 TZ_fmet graphs found

Explore the graph:Soil Heat Flux in a new window

Explore the graph:Tonzi Soil Temperature Set A in a new window

Explore the graph:Tonzi Soil Temperatures Set B in a new window

Explore the graph:Tonzi Soil Temperatures Set C in a new window

Explore the graph:Tonzi Soil Temperature Set D in a new window

Explore the graph:Well Level in a new window

Explore the graph:Well Water Temperature in a new window

Explore the graph:Soil Water Potential in a new window

1 TZ_tram graphs found

Explore the graph:Tonzi Tram Incoming PAR in a new window

3 TZ_co2prof graphs found

Explore the graph:Tower CO2 Profile Concentrations in a new window

Explore the graph:Tower CO2 Profile Cell Pressure in a new window

Explore the graph:CO2 Profile Sensor Temperature in a new window

No data found for TZ_irt.
No data found for TZ_windprof.
1 TZ_tflux graphs found

Explore the graph:Tower CO2 and H2O in a new window

2 TZ_sm graphs found

Explore the graph:Floor Solar Radiations in a new window

Explore the graph:TZ Soil Moisture in a new window

Can't check TZ_met
1 TZ_met graphs found

Explore the graph:Floor and Tower RH in a new window

Can't check TZVR_mixed
8 TZ_osu graphs found

Explore the graph:Soil Moisture And Rain in a new window

Explore the graph:SP1 Solar Radiation in a new window

Explore the graph:SP1 Soil Temperature Profile in a new window

Explore the graph:SP1 Soil Heat Flux in a new window

Explore the graph:SP2 Soil Moisture in a new window

Explore the graph:SP2 Soil Temperature in a new window

Explore the graph:SP3 Soil Moisture in a new window

Explore the graph:SP3 Soil Temperature in a new window

No data found for TZ_fd.
Tonzi Z-cam data

plot of Tonzi z-cam LAI

plot of Tonzi z-cam gap fration