
Field Notes
<--2012-04-19 09:30:00 | 2012-04-23 11:00:00-->Other sites visited today: Vaira | Tonzi
Phenocam link: Searching...
Tonzi: 2012-04-19 11:30:00 (DOY 110)
Author: Joe Verfaillie
Others: Siyan, Lauri, Sonia, Jessica
Summary: Tram drailed - reset and filed rails, leaf angle photos for Martin, new soil co2 TC not reading, Sonia and Jessica were lanuching weather ballons.
| Tonzi
2012-04-19 I arrived with Siyan about 11:30PDT. It was clear, sunny and warm with a breeze from the west. Everything is very green and there are large puddles in the road. The trees are not as full as those at Vaira, maybe 70% full. There was sediment on some of the grass in the drainage down through the floor site like there had been running water there. Sonia and Jessica were there a ways down the road from the soil CO2 enclosure. Sonia's parents were there as well. We watched them release a weather balloon with radio-sonde about noon time. The tram had stopped due to a derail about midway down the track. It went to park after cycling the power. I filed down some rough spots were it derailed. I did not see it run again while I was there, but it might have. Siyan said it only ran about a day after our last visit. I worked on taking leaf angle photos for Martin. I took photos a 2, 4, 6, 8, 10 and 12m heights on the northeast and south east corners of the tower. The camera was at 18x (450mm) zoom and rotated clockwise looking from above a little more than 180 degrees in each location. I worked up the northeast corner and then back down the southeast corner. The bottom few levels on the southeast corner were hurried and have about half as many photos. The rest of the locations have photo butted end to end through the whole rotation. Siyan did the standard field work. The Moisture Point reader had a dead battery. She serviced the z-cams. The new soil CO2 profile near Jessica's (Liukang's) tree has some problem the TC were not reading. We left about 2:45 and picked up Naama and Rohna at Vaira on the way out. |
Field Data
No tank data
Well Depth
| Date | Location | Depth (feet) |
|---|---|---|
| 2012-04-19 | TZ_floor | 24.3 |
| 2012-04-19 | TZ_road | 32.8 |
| 2012-04-19 | TZ_tower | 28.3 |
No TZ Moisture Point data found
No VR Moisture Point data found
No TZ grass heigth found
No VR grass heigth found
Tree DBH
| Date | Tag# | Reading (mm) |
|---|---|---|
| 2012-04-19 | 1 | 19.3 |
| 2012-04-19 | 102 | 11.3 |
| 2012-04-19 | 2 | 16.4 |
| 2012-04-19 | 245 | 9.1 |
| 2012-04-19 | 3 | 16.9 |
| 2012-04-19 | 4 | 23.5 |
| 2012-04-19 | 5 | 23.7 |
| 2012-04-19 | 7 | 7.7 |
| 2012-04-19 | 72 | 10.2 |
| 2012-04-19 | 79 | 8.9 |
| 2012-04-19 | 8 | 16.5 |
No water potential data found
No TZ Grass Biomass data found
No TZ OakLeaves Biomass data found
No TZ PineNeedles Biomass data found
4 photos found
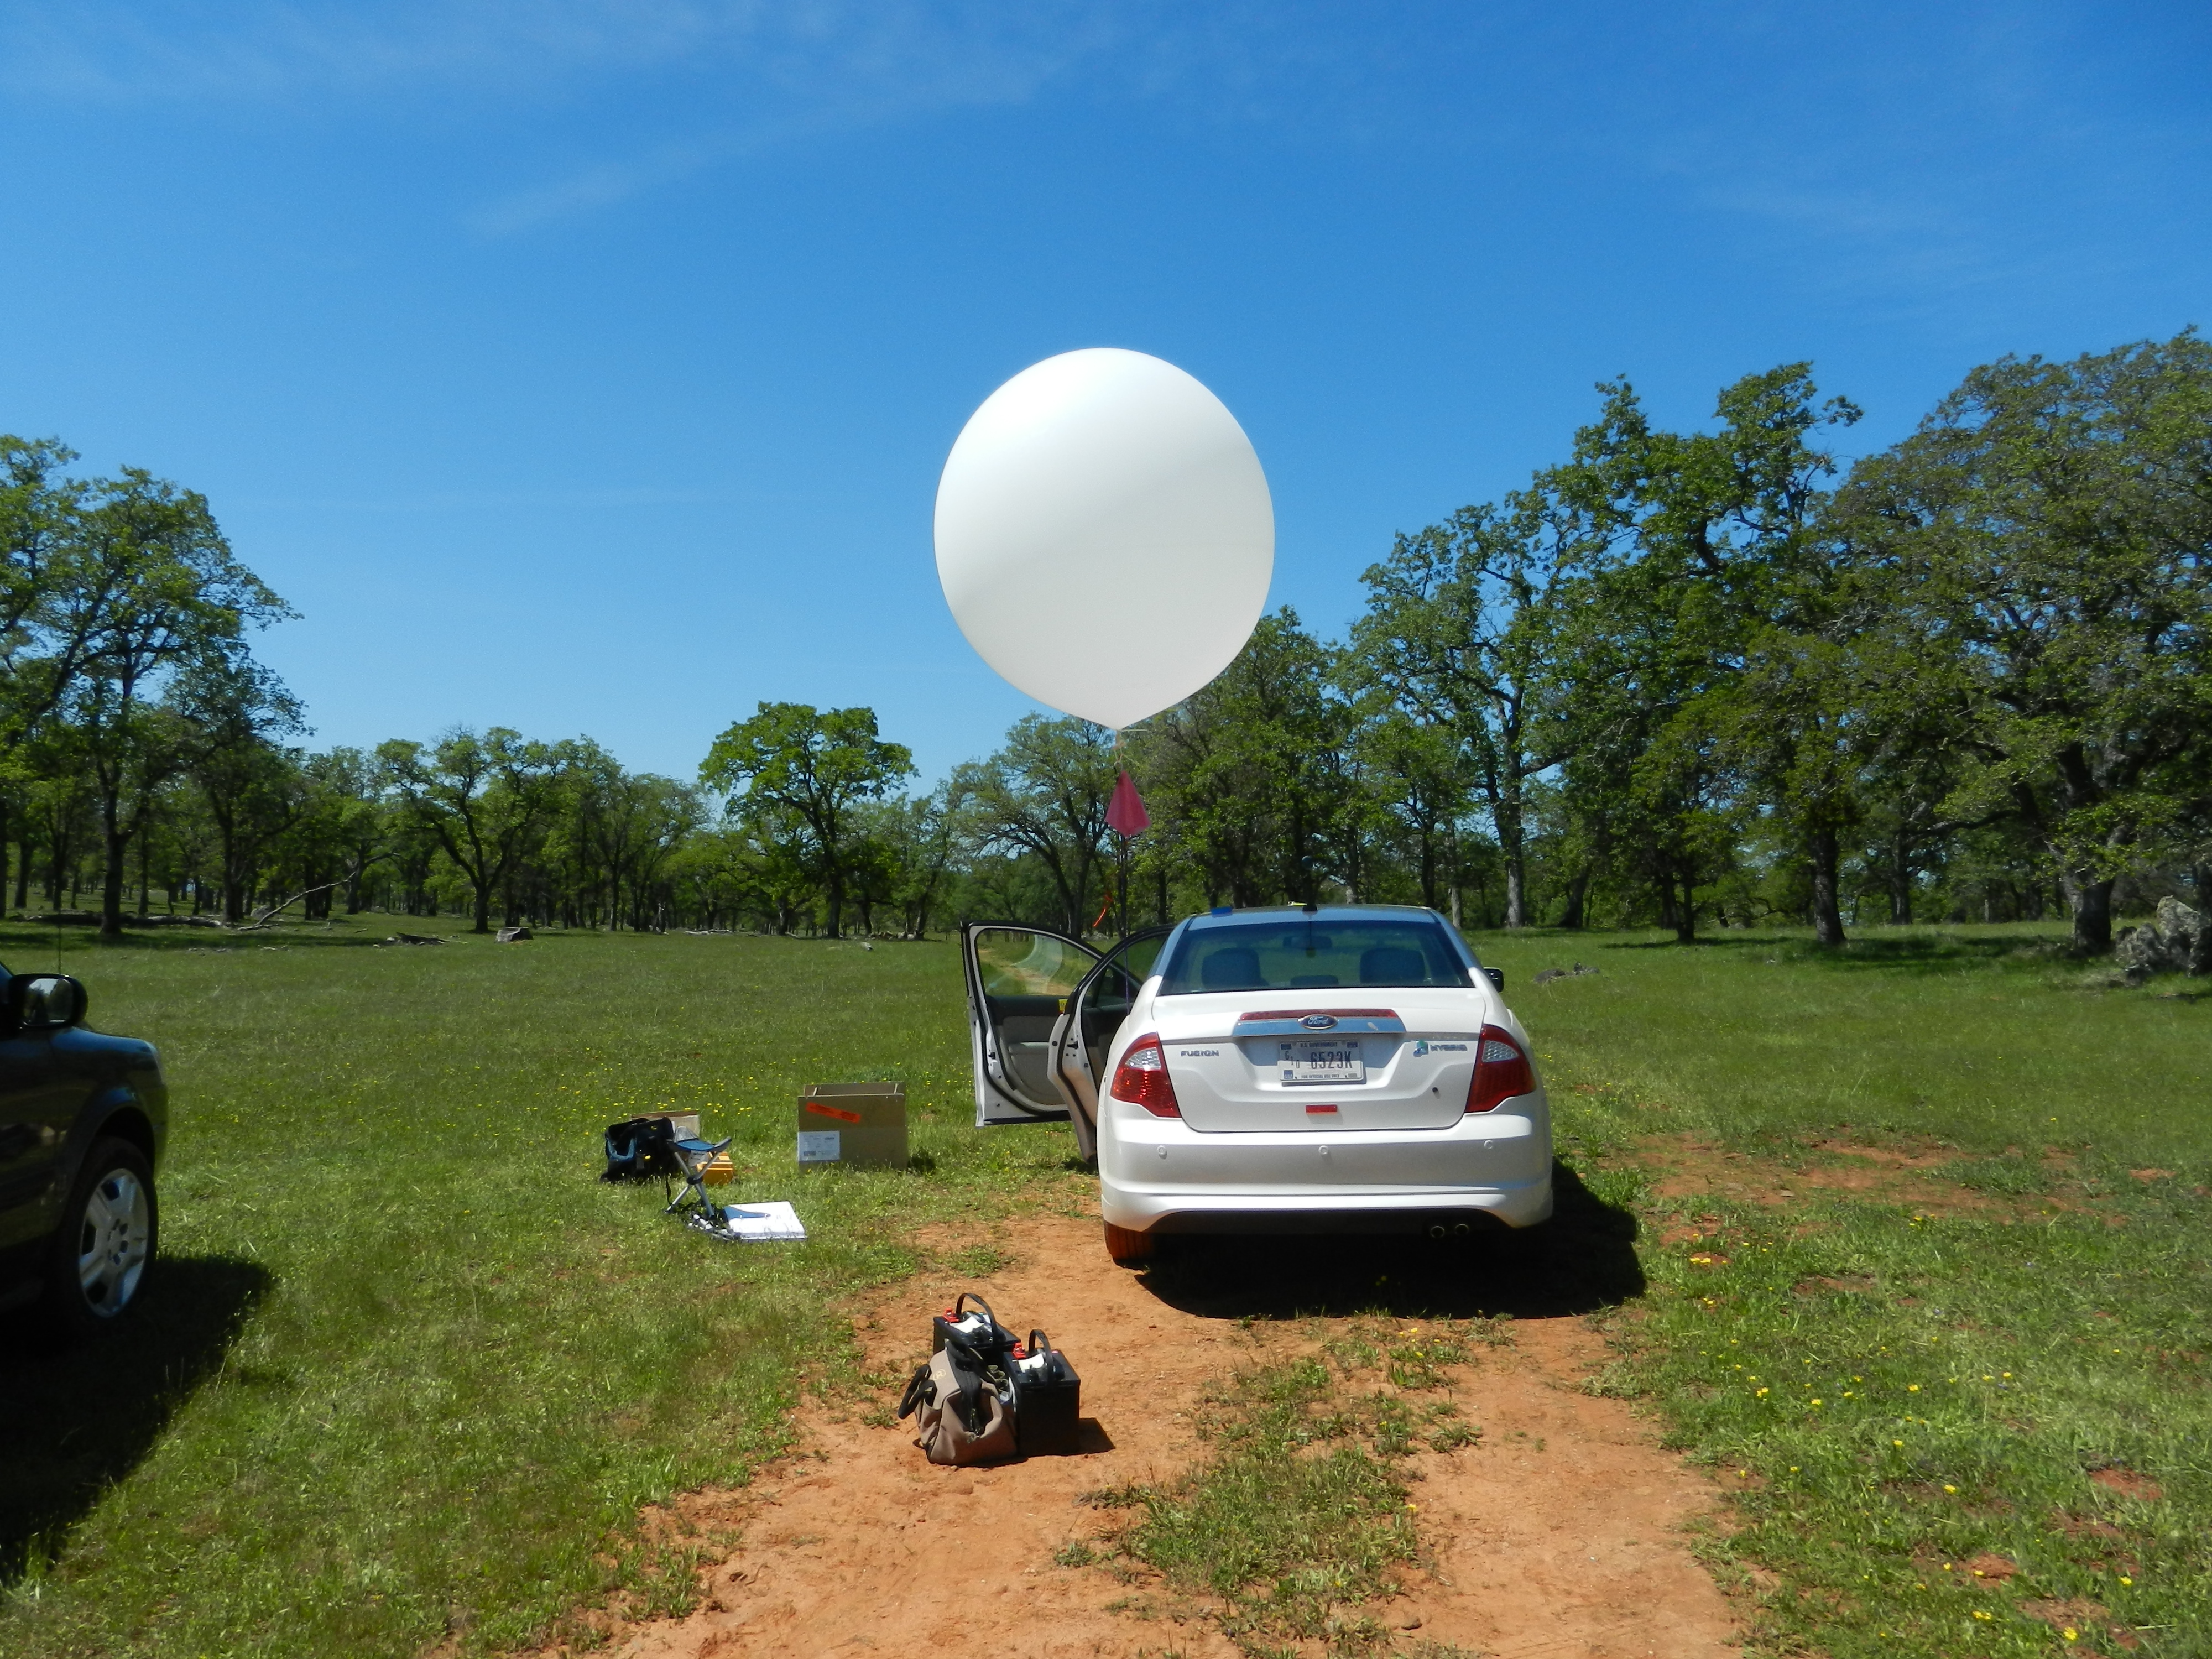
20120419TZ_WeatherBalloon1.jpg ( 2012-04-19 12:12:24 ) Full size: 4000x3000
Getting ready for a weather balloon launch
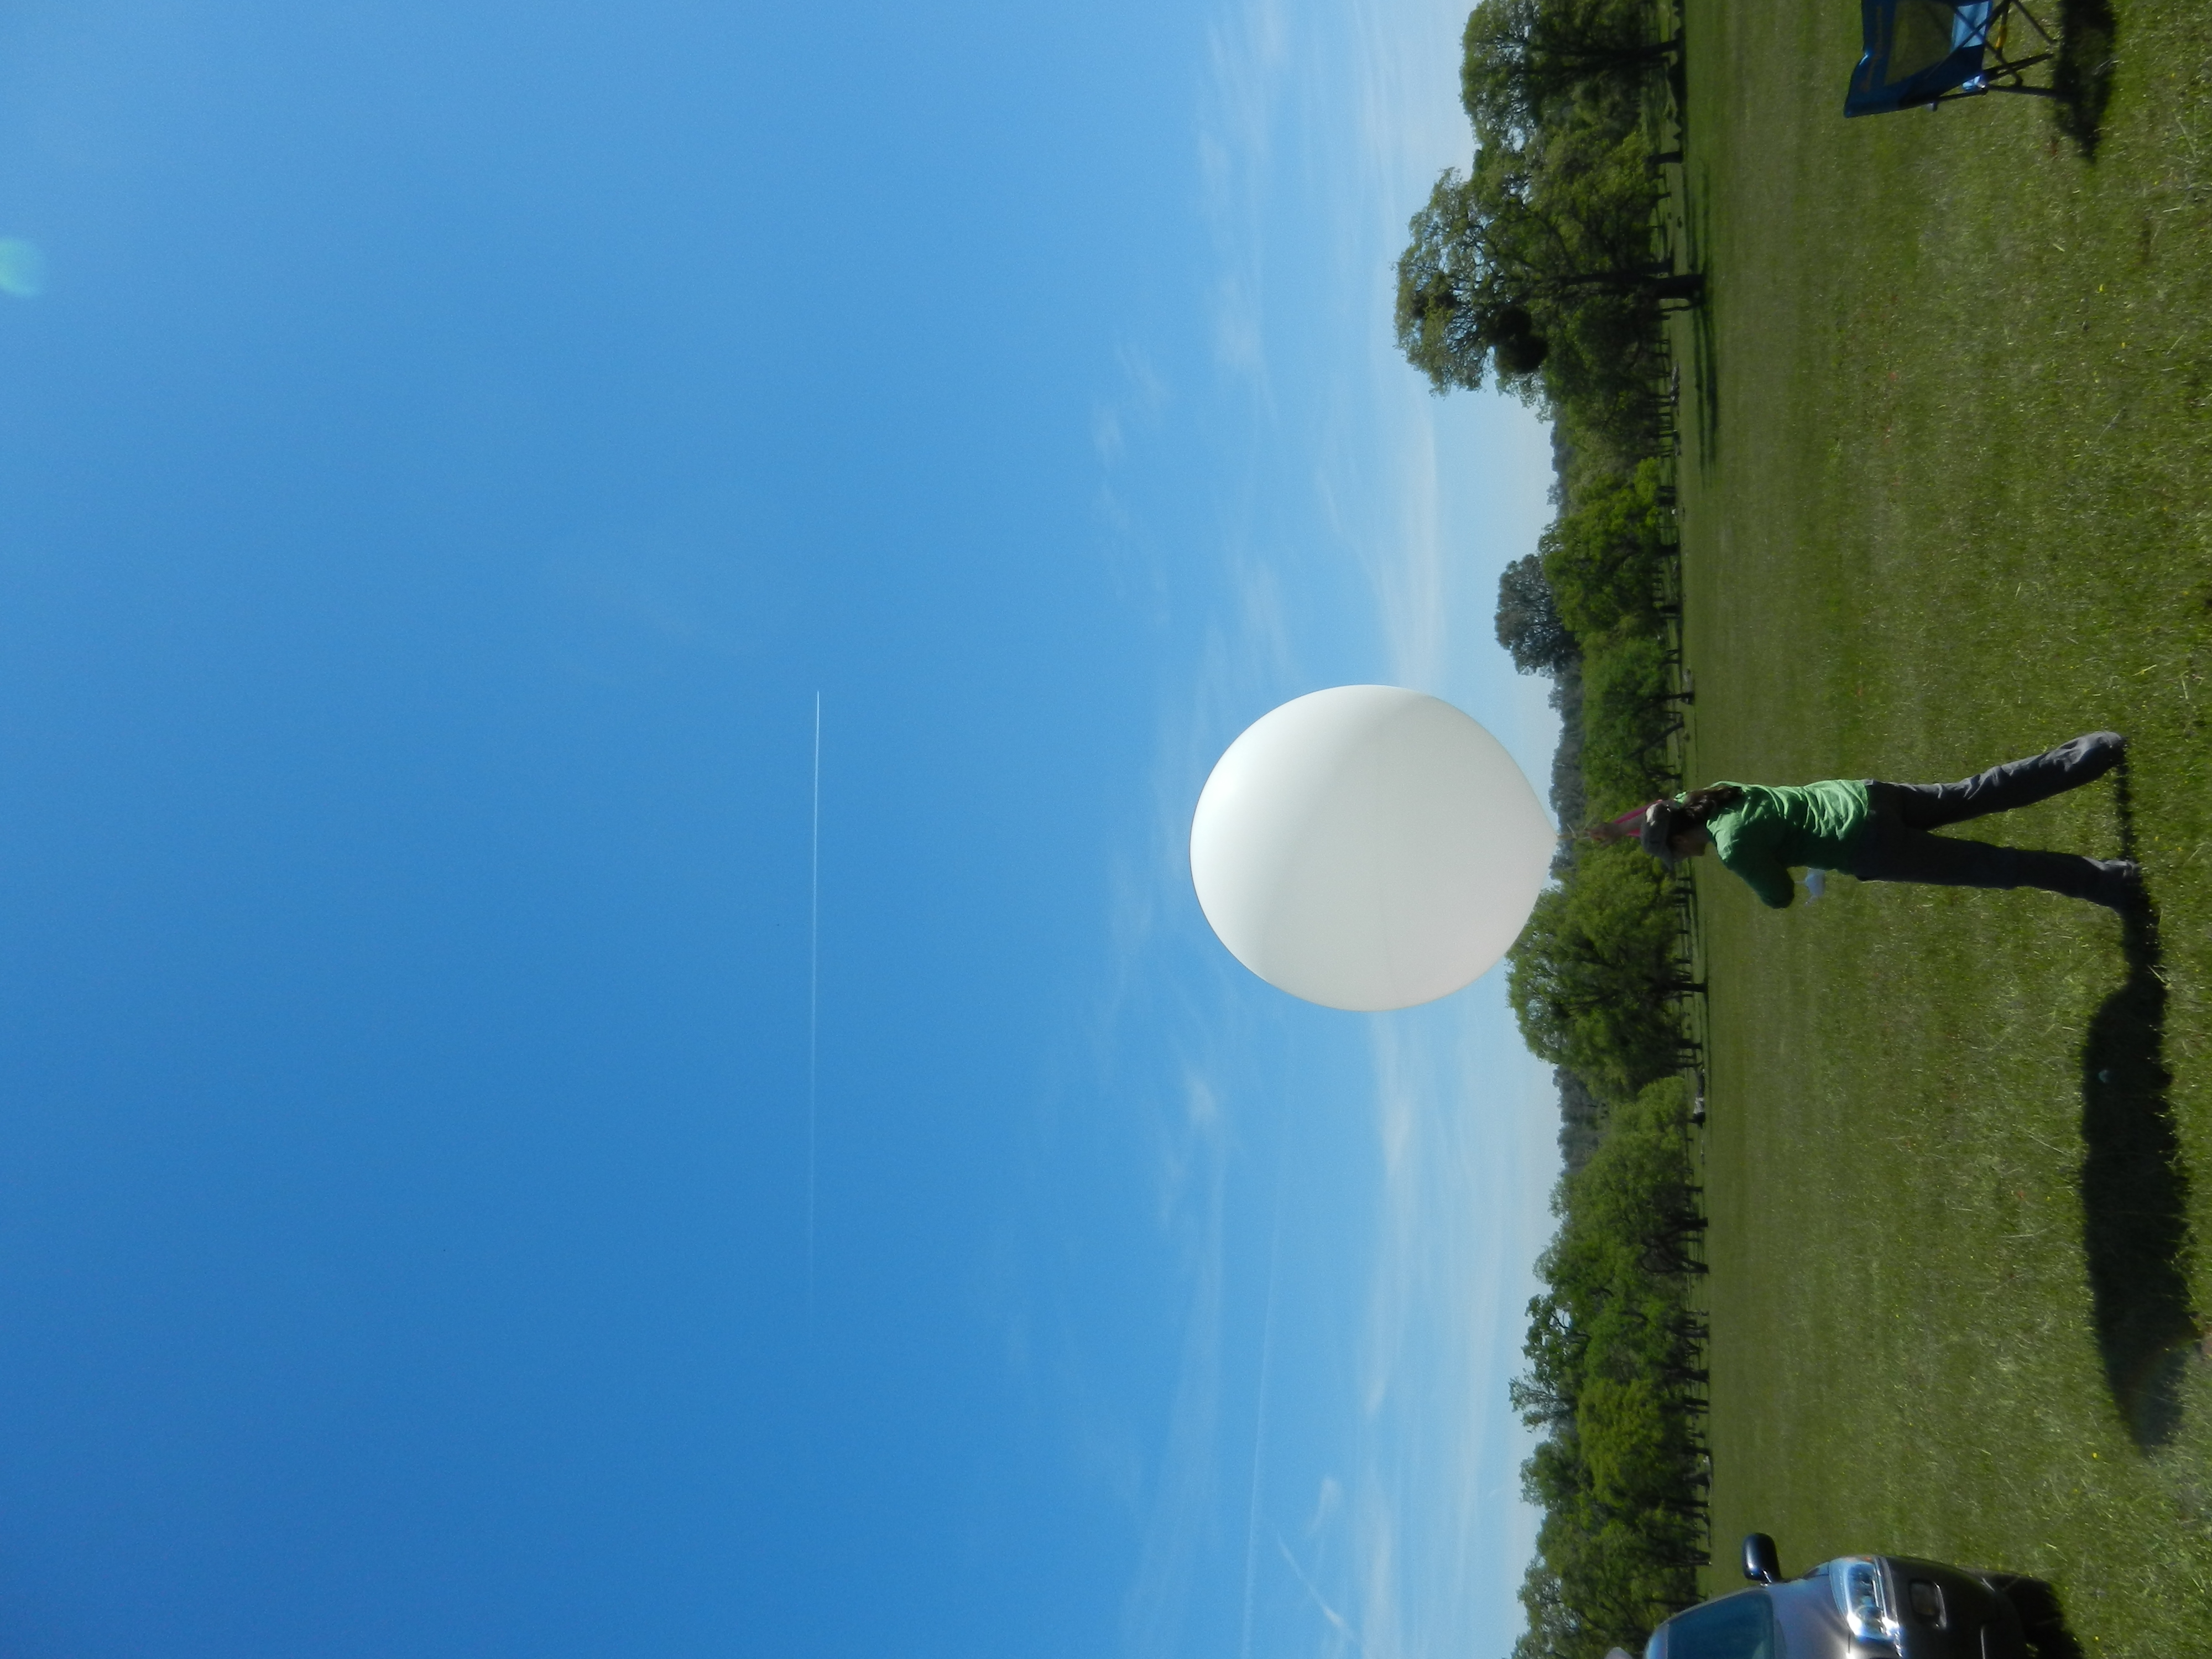
20120419TZ_WeatherBalloon2.jpg ( 2012-04-19 12:28:14 ) Full size: 4000x3000
Getting ready for a weather balloon launch
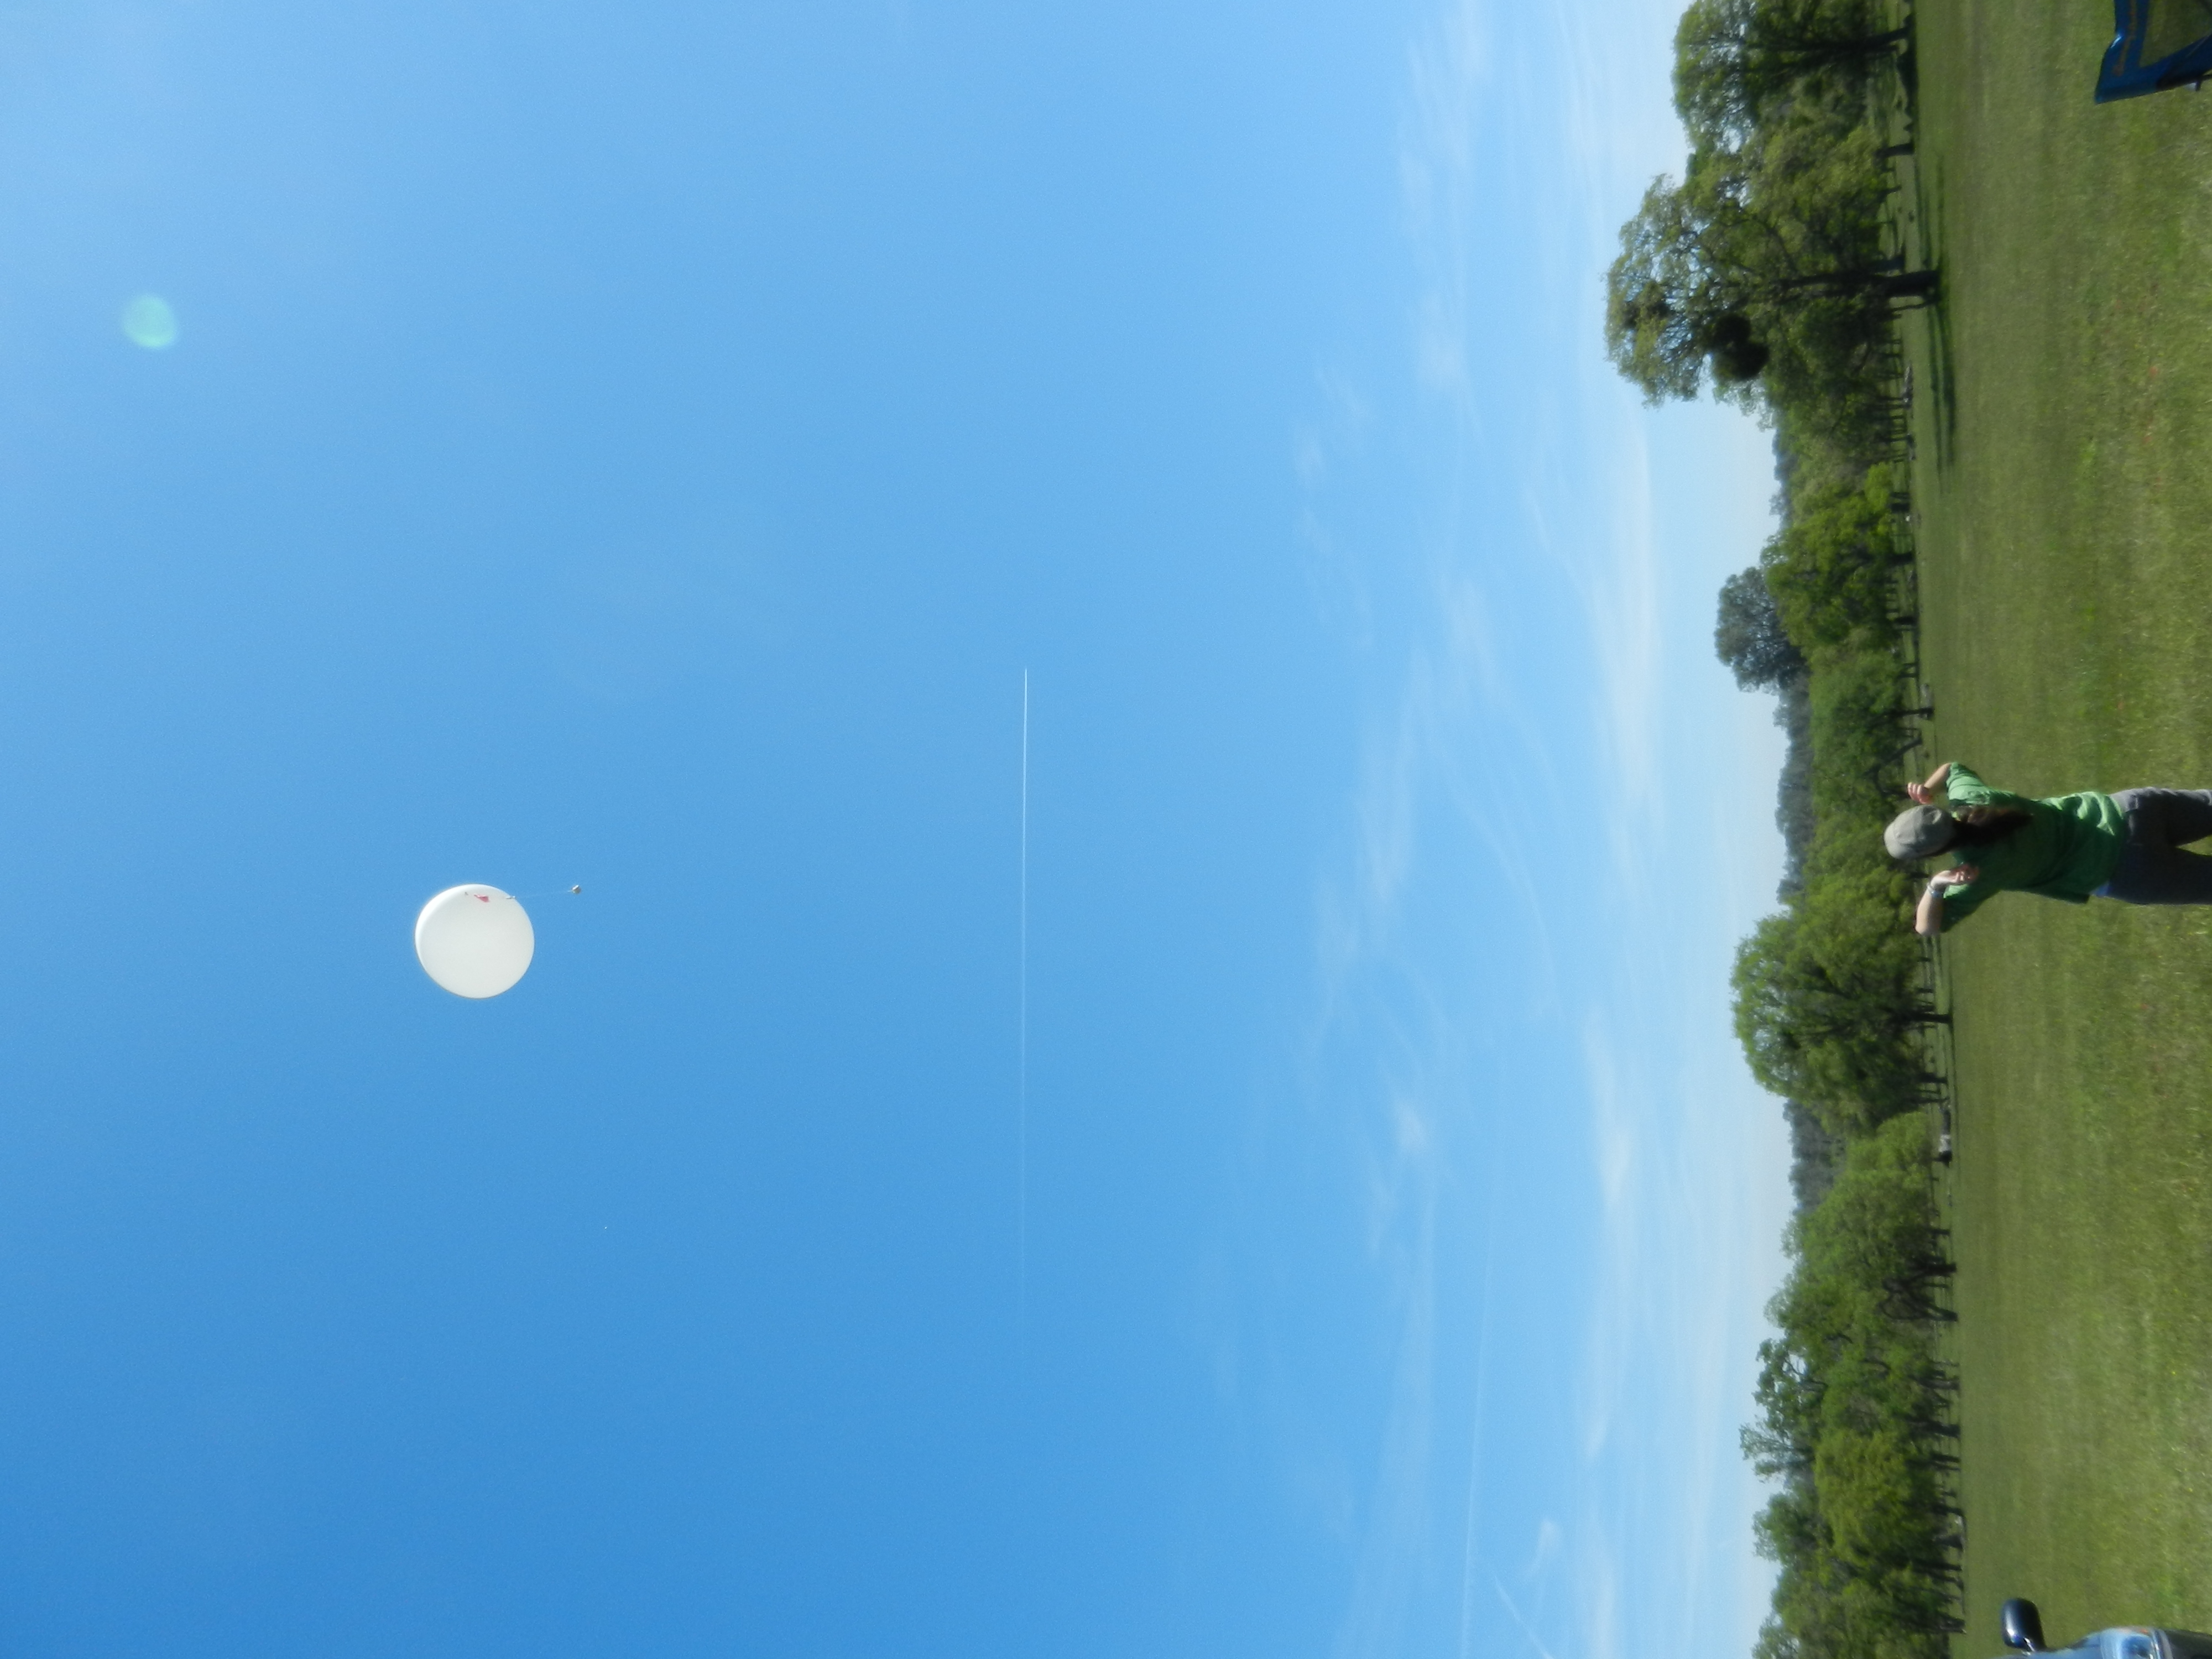
20120419TZ_WeatherBalloon3.jpg ( 2012-04-19 12:28:17 ) Full size: 4000x3000
Weather balloon launch at the oak woodland
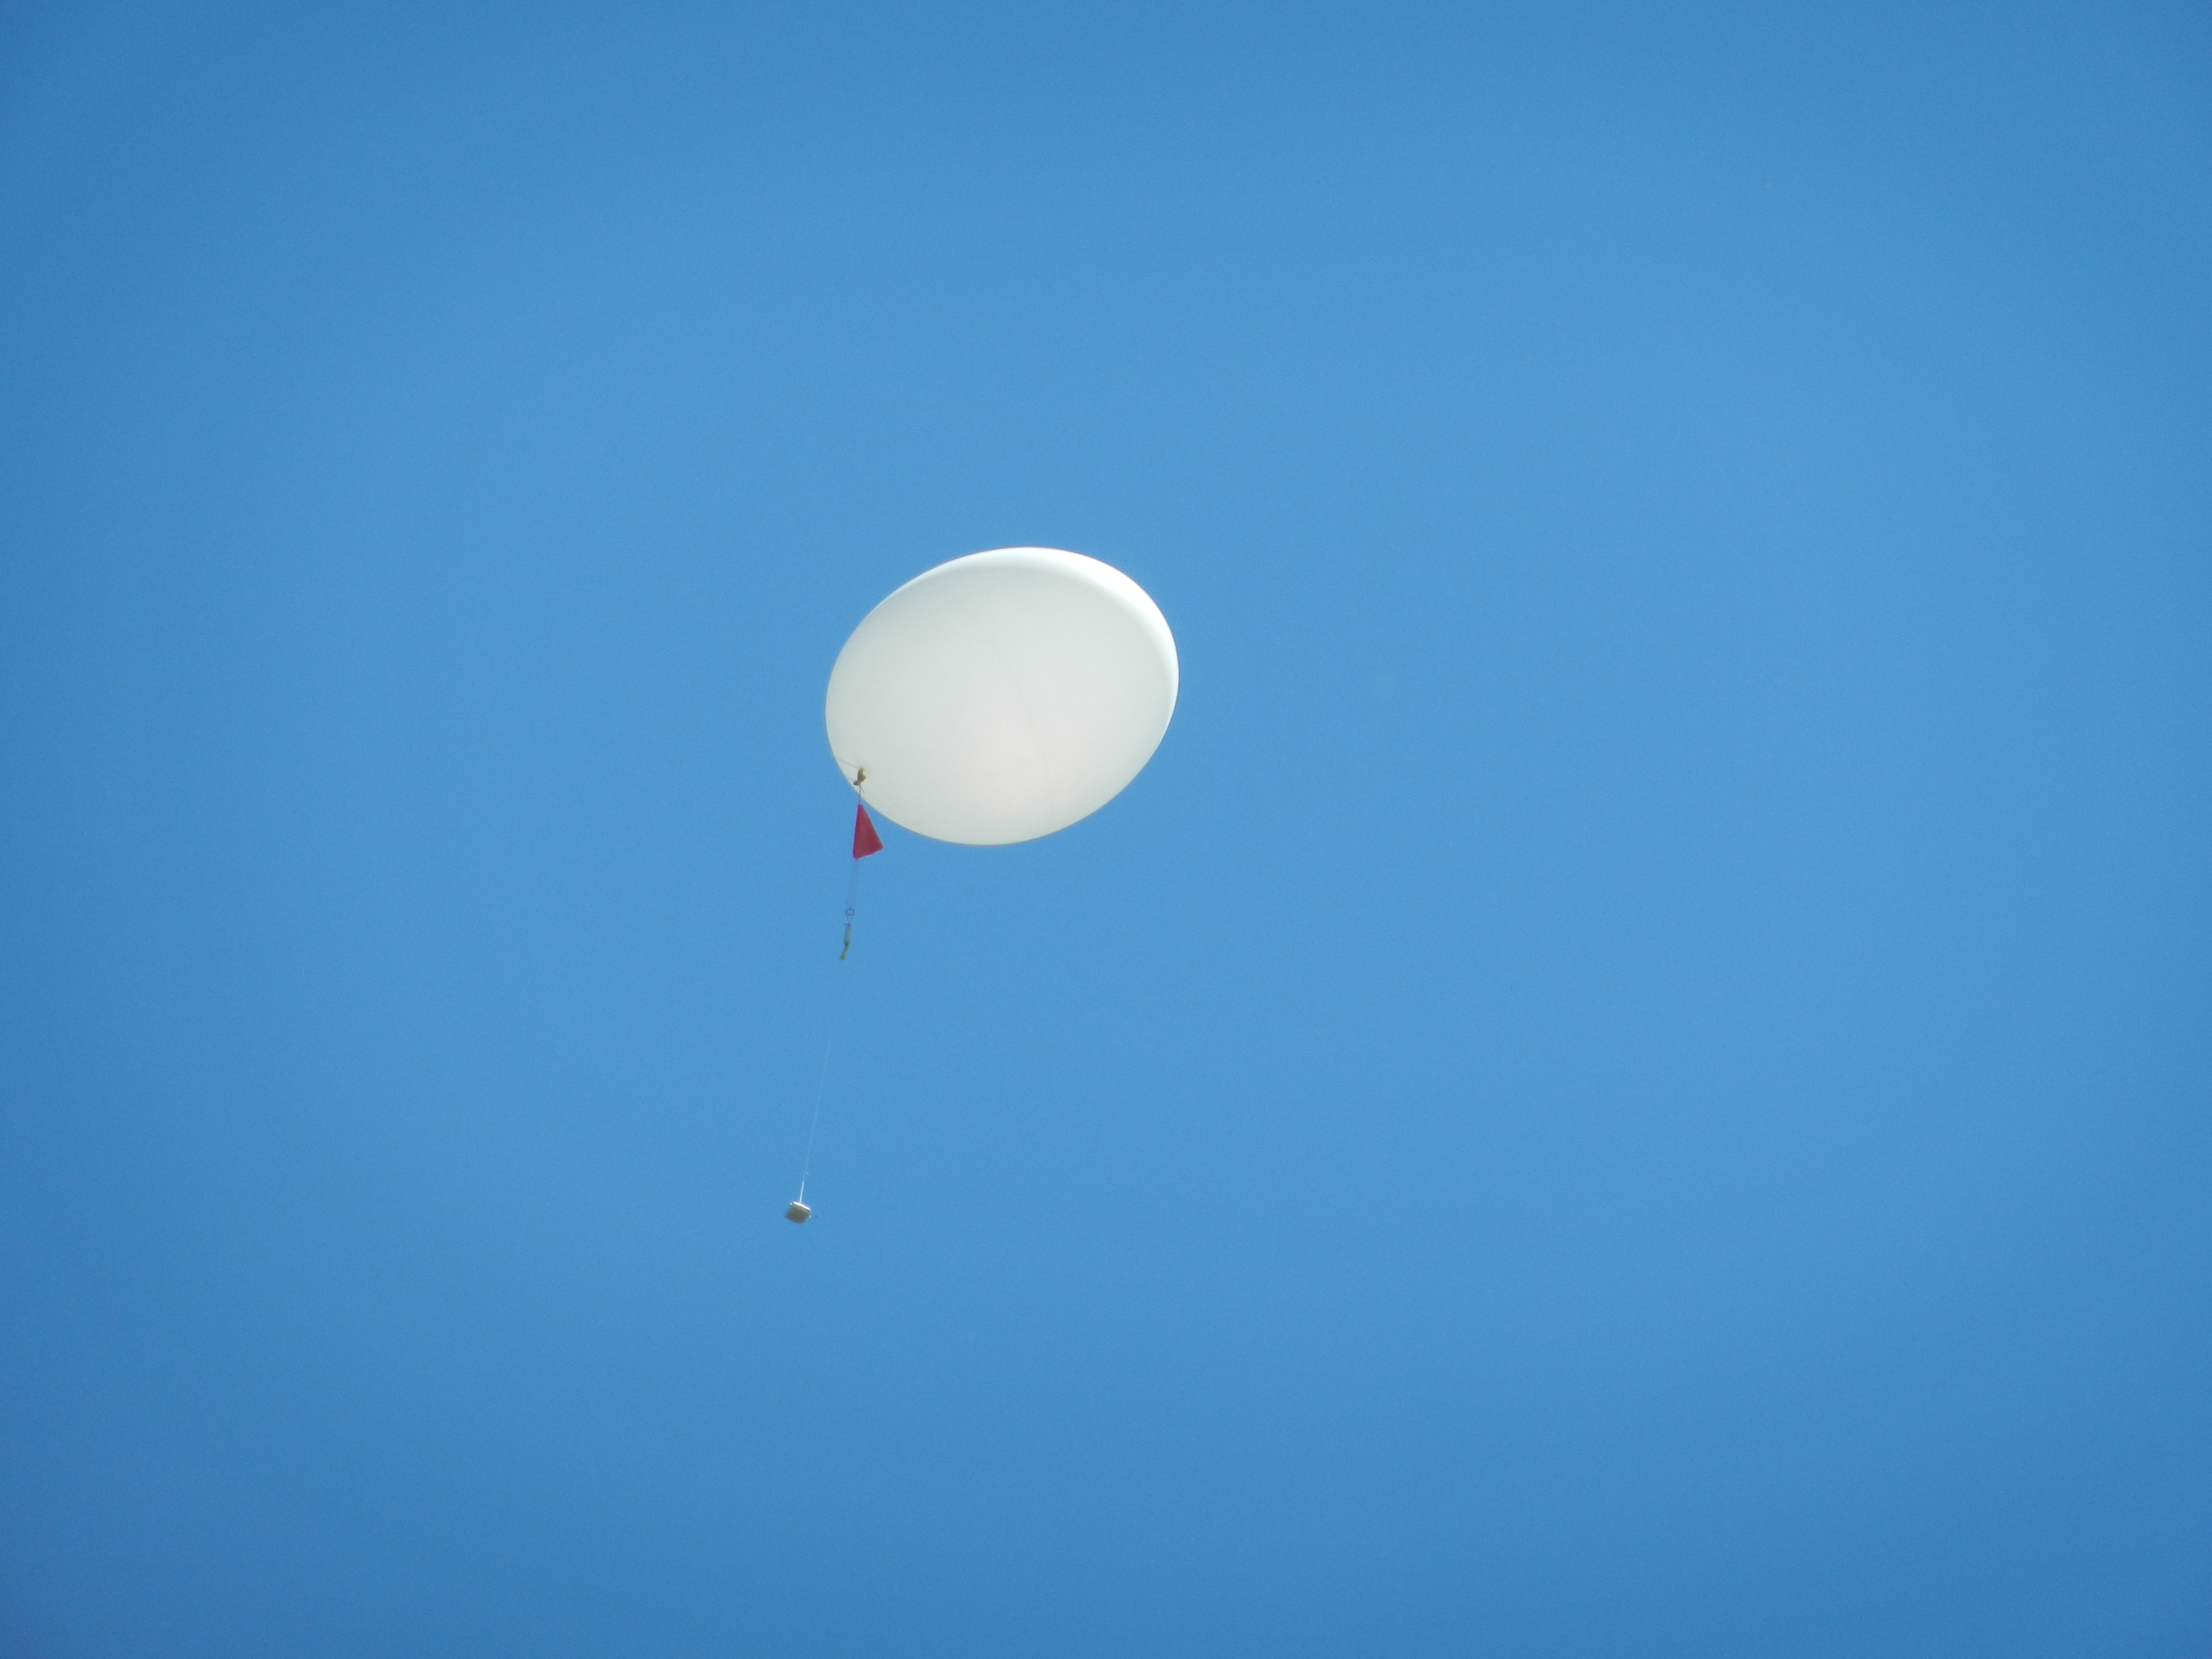
20120419TZ_WeatherBalloon4.jpg ( 2012-04-19 12:28:31 ) Full size: 4000x3000
Weather balloon launch at the oak woodland
16 sets found
No data found for TZ_Fenergy.
11 TZ_tmet graphs found
11 TZ_soilco2 graphs found
Can't check TZ_mixed
3 TZ_mixed graphs found
1 TZ_fflux graphs found
8 TZ_fmet graphs found
1 TZ_tram graphs found
3 TZ_co2prof graphs found
No data found for TZ_irt.
No data found for TZ_windprof.
1 TZ_tflux graphs found
2 TZ_sm graphs found
Can't check TZ_met
1 TZ_met graphs found
Can't check TZVR_mixed
8 TZ_osu graphs found
No data found for TZ_fd.
Tonzi Z-cam data