Field Notes
<--2012-04-05 09:30:00 | 2012-04-19 09:30:00-->Other sites visited today: Vaira | Tonzi
Phenocam link: Searching...
Tonzi: 2012-04-05 10:30:00 (DOY 96)
Author: Joe Verfaillie
Others: Siyan, Martin, Laurie, Sonia, Jessica et al
Summary: Sonia setting up Lidar profiler, new programs for soil co2 data loggers, new power line for soil co2 10x, tram reset and running, co2 profile solenoids failing and one line disconnected.
| Tonzi
2012-04-05 I arrived about 10:30PDT with Siyan and Martin. We dropped Laurie off earlier and Sonia and Jessica from Lawrence Livermore arrived about 9:30 as well. Sonia had some assistants that left about 10:30. Matthias arrived about 3pm as we were leaving. The grass is green, but the trees are still getting there leaves out. I’d guess the leaf out is still less than 50%. The ground is wet with water in the low spots. Sonia and Jessica were setting up a Lidar turbulence profiling system. They put a large solar system and much smaller Lidar in the south end on the soil CO2 cow fence. Their solar charge controller wasn’t working so they were waiting for Matthias to bring them a new one. I ran a new power wire to the third soil CO2 profile new Liukang’s (Jessica’s) tree. I put the part outside the cow fence in PVC conduit. I also put new programs on the soil CO2 23X and the new CR10X to allow the CR23x to collect the data from the CR10x. I ran a wire from the CR23X to the CR10X for the SDM connection. However, I could not get the communications to work to a grounding problem. I added some ground wires but that caused other problems. The data loggers are running on isolating DC-DC converters to drop the 24V needed by the Vaisala to 12V. I think I need to replace these isolating converters with non-isolating converters. I cycled the power on the tram and it ran a couple of times before we left. I removed one of the wind profile arms from the tower to explore its use on the new Delta towers. At least one of the CO2 profile solenoids is not working. I think they should all be replaced. One inlet lines (the top inlet I think) was left disconnected from the box from last time. I reconnected it. We cleaned the windows on the z-cams. Laurie took soil cores. Siyan did the standard field work Martin experimented with taking photos for leaf angle measurements, but not really enough leaves yet. |
Field Data
No tank data
Well Depth
| Date | Location | Depth (feet) |
|---|---|---|
| 2012-04-05 | TZ_floor | 26.9 |
| 2012-04-05 | TZ_road | 35.5 |
| 2012-04-05 | TZ_tower | 31.3 |
No TZ Moisture Point data found
No VR Moisture Point data found
No TZ grass heigth found
No VR grass heigth found
Tree DBH
| Date | Tag# | Reading (mm) |
|---|---|---|
| 2012-04-05 | 1 | 18.5 |
| 2012-04-05 | 102 | 10.8 |
| 2012-04-05 | 2 | 15.8 |
| 2012-04-05 | 245 | 8.5 |
| 2012-04-05 | 3 | 16 |
| 2012-04-05 | 7 | 15.1 |
| 2012-04-05 | 72 | 9.5 |
| 2012-04-05 | 79 | 8 |
| 2012-04-05 | 8 | 7.3 |
No water potential data found
No TZ Grass Biomass data found
No TZ OakLeaves Biomass data found
No TZ PineNeedles Biomass data found
3 photos found

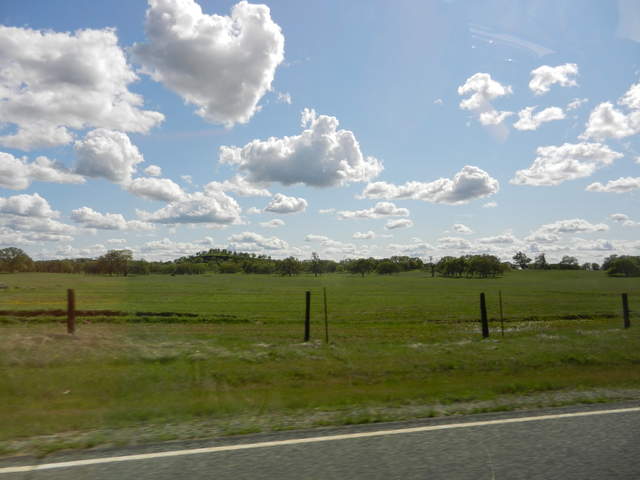
20120403TZ_CloudsGrass.jpg ( 2012-04-05 15:12:03 ) Full size: 4000x3000
Nice puffy clouds over green pasture

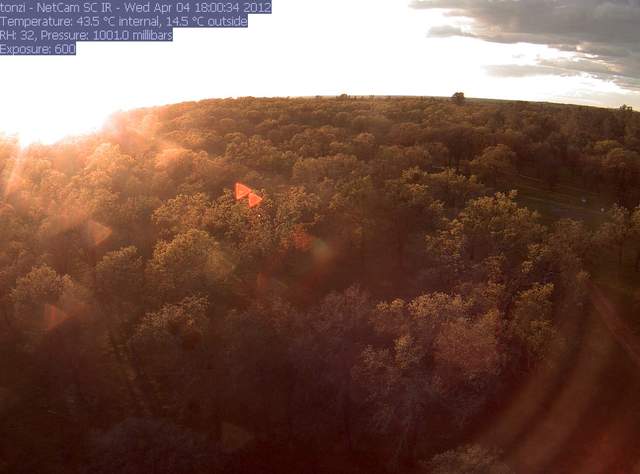
tonzi_2012_04_04_180102.jpg ( 2012-04-04 18:00:30 ) Full size: 1296x960
Nice light

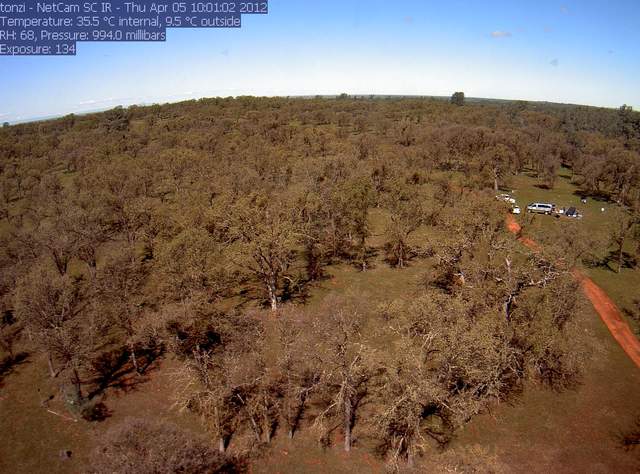
tonzi_2012_04_05_100102.jpg ( 2012-04-05 10:00:34 ) Full size: 1296x960
Fieldwork near Jessicas (liukangs) tree setting up Lidar profiler
16 sets found
No data found for TZ_Fenergy.
11 TZ_tmet graphs found
11 TZ_soilco2 graphs found
Can't check TZ_mixed
3 TZ_mixed graphs found
1 TZ_fflux graphs found
8 TZ_fmet graphs found
1 TZ_tram graphs found
3 TZ_co2prof graphs found
No data found for TZ_irt.
No data found for TZ_windprof.
1 TZ_tflux graphs found
2 TZ_sm graphs found
Can't check TZ_met
1 TZ_met graphs found
Can't check TZVR_mixed
8 TZ_osu graphs found
No data found for TZ_fd.
Tonzi Z-cam data

