
Field Notes
<--2025-01-22 11:20:00 | 2025-02-21 10:50:00-->Other sites visited today: Vaira | Gilbert Tract
Phenocam link: Searching...
Tonzi: 2025-02-07 11:10:00 (DOY 38)
Author: Joe Verfaillie
Others: Kuno, Will
Summary: Wet after rains, Floor 7700 lst line lock, flushed and refreshed optics desiccant, #3 TC on north bole temp tree not working, Under Moisture Point broken, updated RevBowen code.
| Tonzi 2025-02-07 Kuno, Will and I arrived at about 11:10 PST. Will is visiting from Rob Rhew's lab looking to make some static chamber measurements of hydrogen uptake. Partly this is to get a baseline before hydrogen is more widely used as a fuel and atmospheric hydrogen will likely rise due to leaks. Atmospheric hydrogen is about 530ppb. After three or four days of rain it is super wet here but mostly sunny with fluffy white clouds. The pond has come up some but not half way full yet. Puddles and running water everywhere. A herd of young cows followed me around for a bit. Kuno did his usual rounds of stem and soil fluxes. He said he was seeing higher fluxes than last time with sinks of CH4 and CO2. Moisture was much higher but still cold. I worked on the Floor site first. Kuno said the electric fence was off but I think the wire was just shorted to ground at one point. Just before going home I turned it on and it wasn't working but may have still been shorted with the gate leads on the ground, a second try without the gate lead on the ground seemed to work. It is using 24V instead of 12V though. The 7700 on the Floor tower was also having problems. Its optics RH has been high >30% for a few weeks and it had lost its line lock so wasn't reporting good CH4. A power cycle fixed its line lock. Then I also flushed its head space with dry N2 and replaced its desiccant bottle. Afterwards its optics RH was about 9%. Need to keep an eye on it - the O-ring on the TC fitting may not be sealing tightly enough. The wash reservoir was about half empty - refilled. The 7500 read: 424.6ppm CO2, 375.5mmol/m3 H2O, 13.3C, 99.7kPa, 102.2SS The 7700 read: 2.01ppm CH4, 65.1RSSI - 85.7 after cleaning Will did the soil moisture, well levels and serviced z-cams 2 and 3. There is a broken pin on the Under Moisture Point Probe - time to pull and dispose of it. I collected the Floor well, the tree bole temps, the FD data, read the dendrometers and service z-cam 1. We replaced the desiccant in all of the zcams. The #3 TC on the North tree bole temp set is not working - I should bring a new one to swap it out next time. I climbed the tower to collect the tower top data. The wash reservoir was about 1/4 low - refilled. The radiometers looked clean. The 7500 read: 431.0ppm CO2, 339mmol/m3 H2O, 13.6C, 99.6kPa, 100.3SS The 7700 read: 2.0ppm CH4, 64.2RSSI - 85.1 after cleaning I also took some spherical photos for Carlos. I hope to estimate the amount of space the tower takes up in the reflected radiometers FOV. I changed the Tower top met program to update the Rev-Bowen calculations again. I think it's correct now - might have been a factor of 1000 wrong before. We left about 14:30 PST |
Field Data
No tank data
Well Depth
| Date | Location | Depth (feet) |
|---|---|---|
| 2025-02-07 | TZ_floor | 29.5 |
| 2025-02-07 | TZ_road | 37.2 |
| 2025-02-07 | TZ_tower | 34.05 |
| 2025-02-07 | VR_well | 57.4 |
No TZ Moisture Point data found
No VR Moisture Point data found
No TZ grass heigth found
No VR grass heigth found
Tree DBH
| Date | Tag# | Reading (mm) |
|---|---|---|
| 2025-02-07 | 1 | 15.0 |
| 2025-02-07 | 102 | 8.8 |
| 2025-02-07 | 2 | 17.7 |
| 2025-02-07 | 245 | 13.9 |
| 2025-02-07 | 3 | 11.2 |
| 2025-02-07 | 4 | 14.0 |
| 2025-02-07 | 5 | 6.2 |
| 2025-02-07 | 6 | 10.1 |
| 2025-02-07 | 7 | 17.5 |
| 2025-02-07 | 72 | 10.7 |
| 2025-02-07 | 79 | 12.0 |
No water potential data found
No TZ Grass Biomass data found
No TZ OakLeaves Biomass data found
No TZ PineNeedles Biomass data found
1 photos found
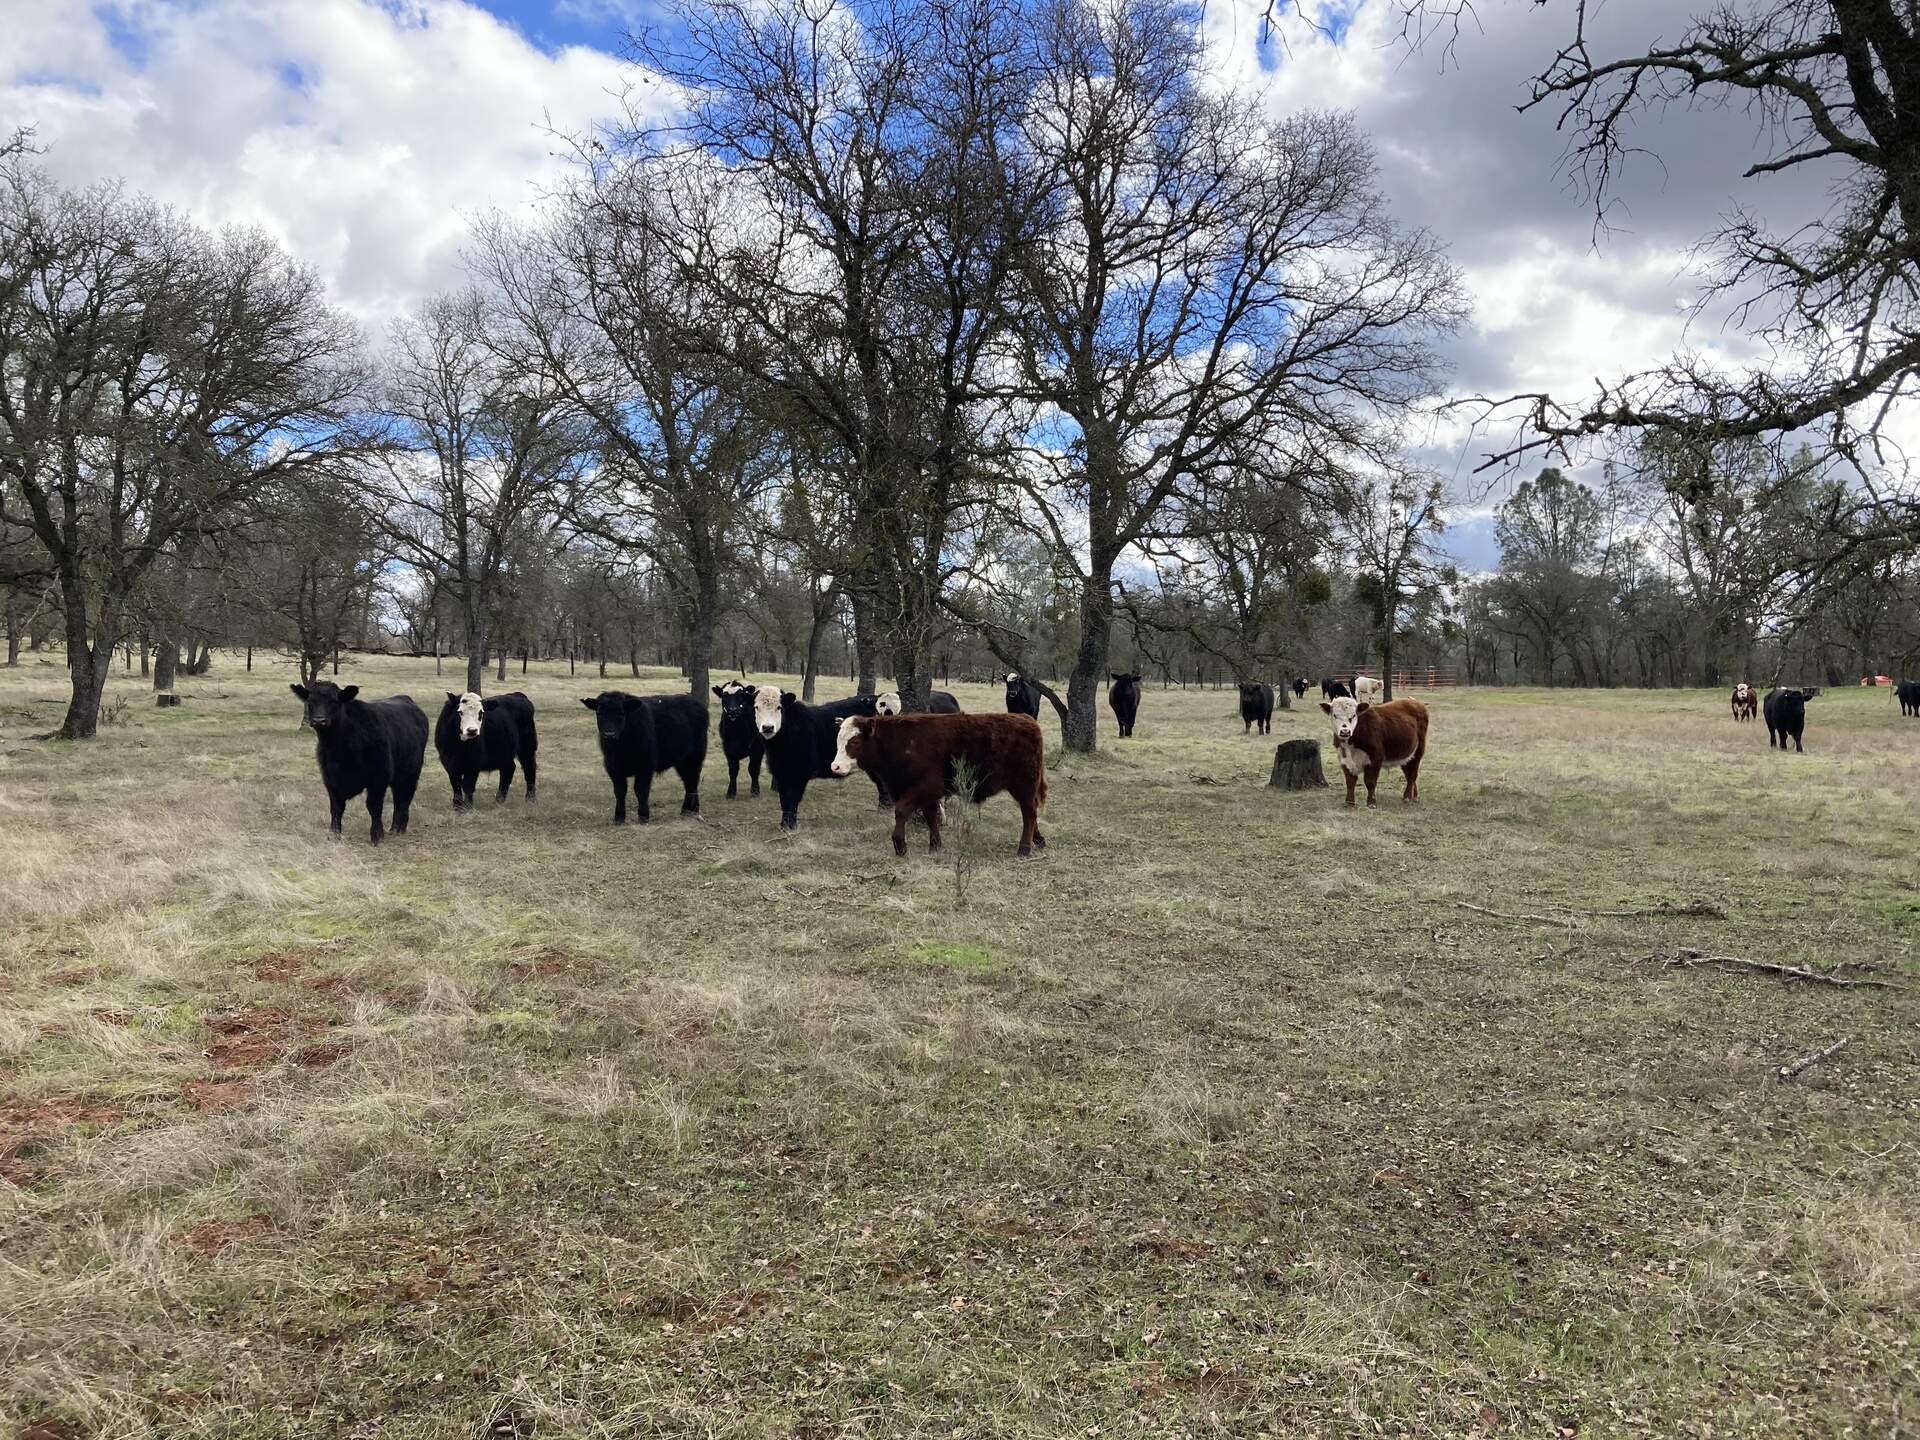
20250207TZ_PunkCows.jpg ( 2025-02-07 12:59:48 ) Full size: 1920x1440
A heard of young punk cows came to see what I was doing
16 sets found
No data found for TZ_Fenergy.
11 TZ_tmet graphs found
No data found for TZ_soilco2.
Can't check TZ_mixed
3 TZ_mixed graphs found
1 TZ_fflux graphs found
8 TZ_fmet graphs found
No data found for TZ_tram.
3 TZ_co2prof graphs found
1 TZ_irt graphs found
No data found for TZ_windprof.
1 TZ_tflux graphs found
8 TZ_sm graphs found
Can't check TZ_met
1 TZ_met graphs found
Can't check TZVR_mixed
8 TZ_osu graphs found
3 TZ_fd graphs found
Tonzi Z-cam data