
Field Notes
<--2012-02-01 09:00:00 | 2012-02-09 13:30:00-->Other sites visited today: Vaira | Tonzi
Phenocam link: Searching...
Tonzi: 2012-02-01 09:00:00 (DOY 32)
Author: Siyan Ma
Others: Joe
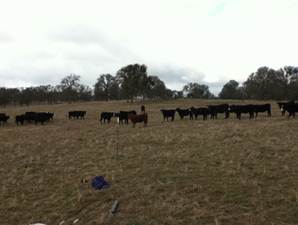
Summary: Standard field work, extended cow fence at Varia.
|
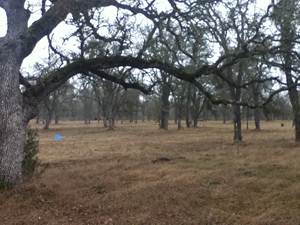
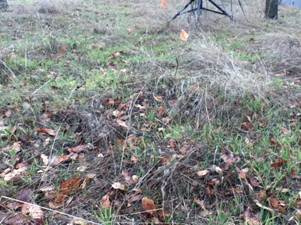
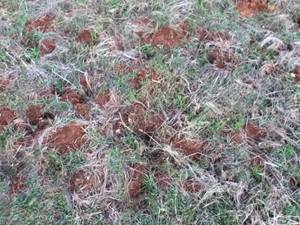
When: Date: 2/1/2012 , Day: 32 , Watch Time: 9:00 am . Where: Tonzi/Vaira Ranch Who: Siyan, Joe Weather: cloudy, wet ground Phenology: senescent grass leaves due to drought; oak leaf-off; cows at Vaira
Summary
Vaira_Grass Site
Tonzi_Tower Site
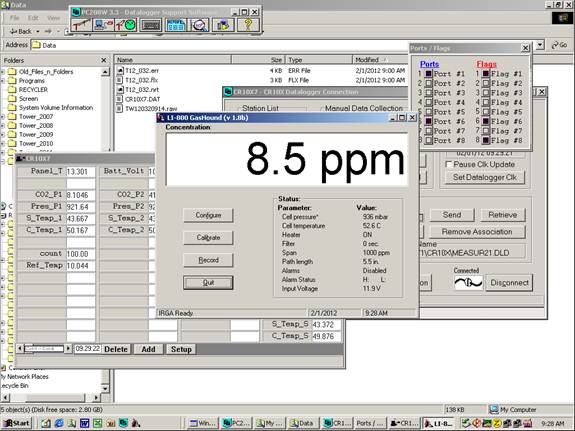
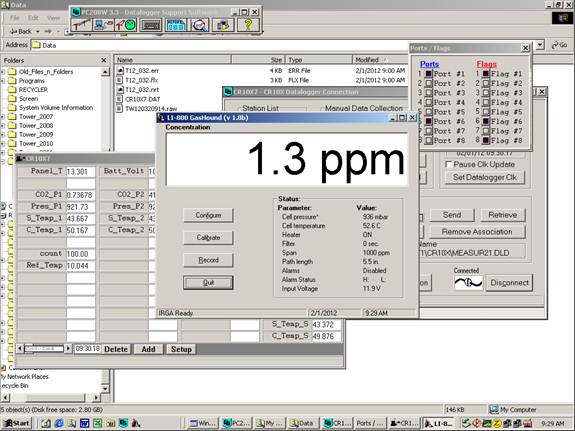
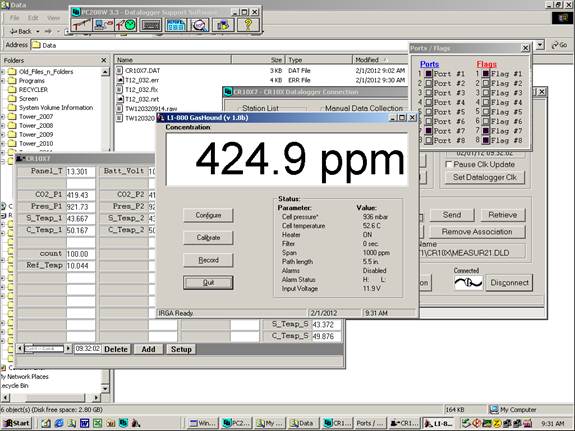
CO2 1800 psig; flow 20 psi; 421.63 ppm. N2 2000 psig; flow 20 psi. Manually calibrate Li-800. Following Ted’s instruction: H:IoneSavanna_2004Tower_2004CO2ProfileLI800_Calibration_Procedure_2Nov04.txt Is the pump running YES! 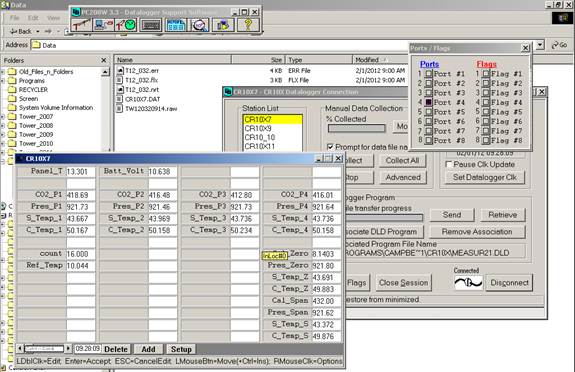
Toniz_Floor Site
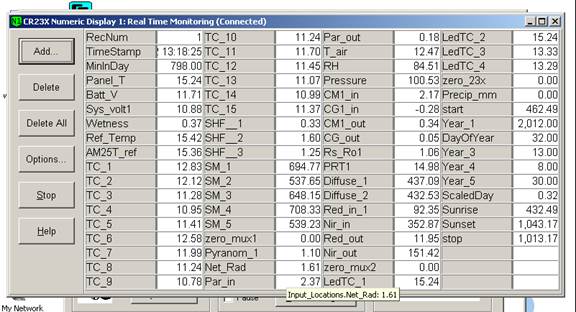
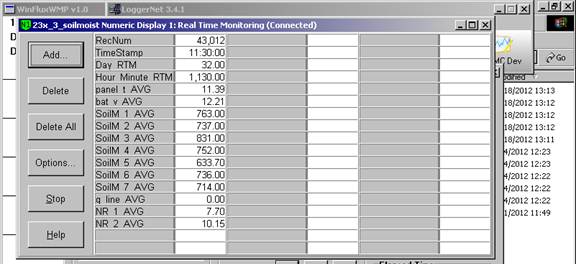
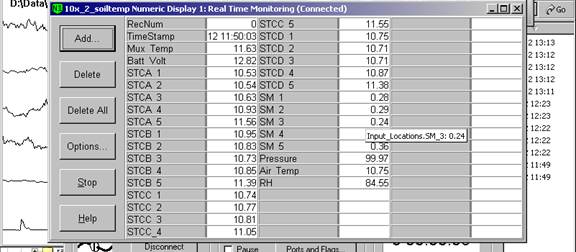
CR23X3 – floor-Met CR23X6 – tower-Met CR10X2 – floor-Met 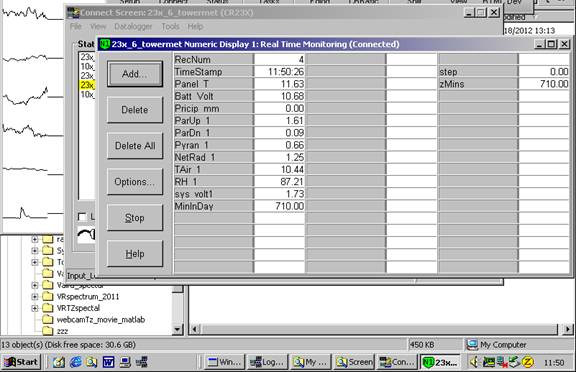
CR23X5 – soil CO2 profile: disconnected, bring the Vaisala CO2 probes back to the lab for calibration.
Notes: “X” means not working any more. Dendrometers installed by Gretchen group | ||||||||||||||||||||||||||||||||||||||||||||||||||||||||||||||||||||||||||||||||||||||||||||||||||||||||||||||||||||||||||||||||||||||||||||||||||||||||||||||||||||||||||||||||||||||||||||||||||||||||||||||||||||||||||||||||||||||||||||||||||||||||||||||||||||||||||||||||||||||||||||||||||||||||||||||||||||||||||||||||||||||||||||||||||||||||||||||||||||||||||

Field Data
No tank data
Well Depth
| Date | Location | Depth (feet) |
|---|---|---|
| 2012-02-01 | TZ_floor | 29.4 |
| 2012-02-01 | TZ_road | 38 |
| 2012-02-01 | TZ_tower | 34.3 |
No TZ Moisture Point data found
No VR Moisture Point data found
No TZ grass heigth found
No VR grass heigth found
Tree DBH
| Date | Tag# | Reading (mm) |
|---|---|---|
| 2012-02-01 | 1 | 17.4 |
| 2012-02-01 | 102 | 9.4 |
| 2012-02-01 | 2 | 16.4 |
| 2012-02-01 | 245 | 20.2 |
| 2012-02-01 | 3 | 14.8 |
| 2012-02-01 | 4 | 19.5 |
| 2012-02-01 | 7 | 15 |
| 2012-02-01 | 72 | 7.2 |
| 2012-02-01 | 79 | 6.7 |
| 2012-02-01 | 8 | 6.6 |
No water potential data found
No TZ Grass Biomass data found
No TZ OakLeaves Biomass data found
No TZ PineNeedles Biomass data found
3 photos found
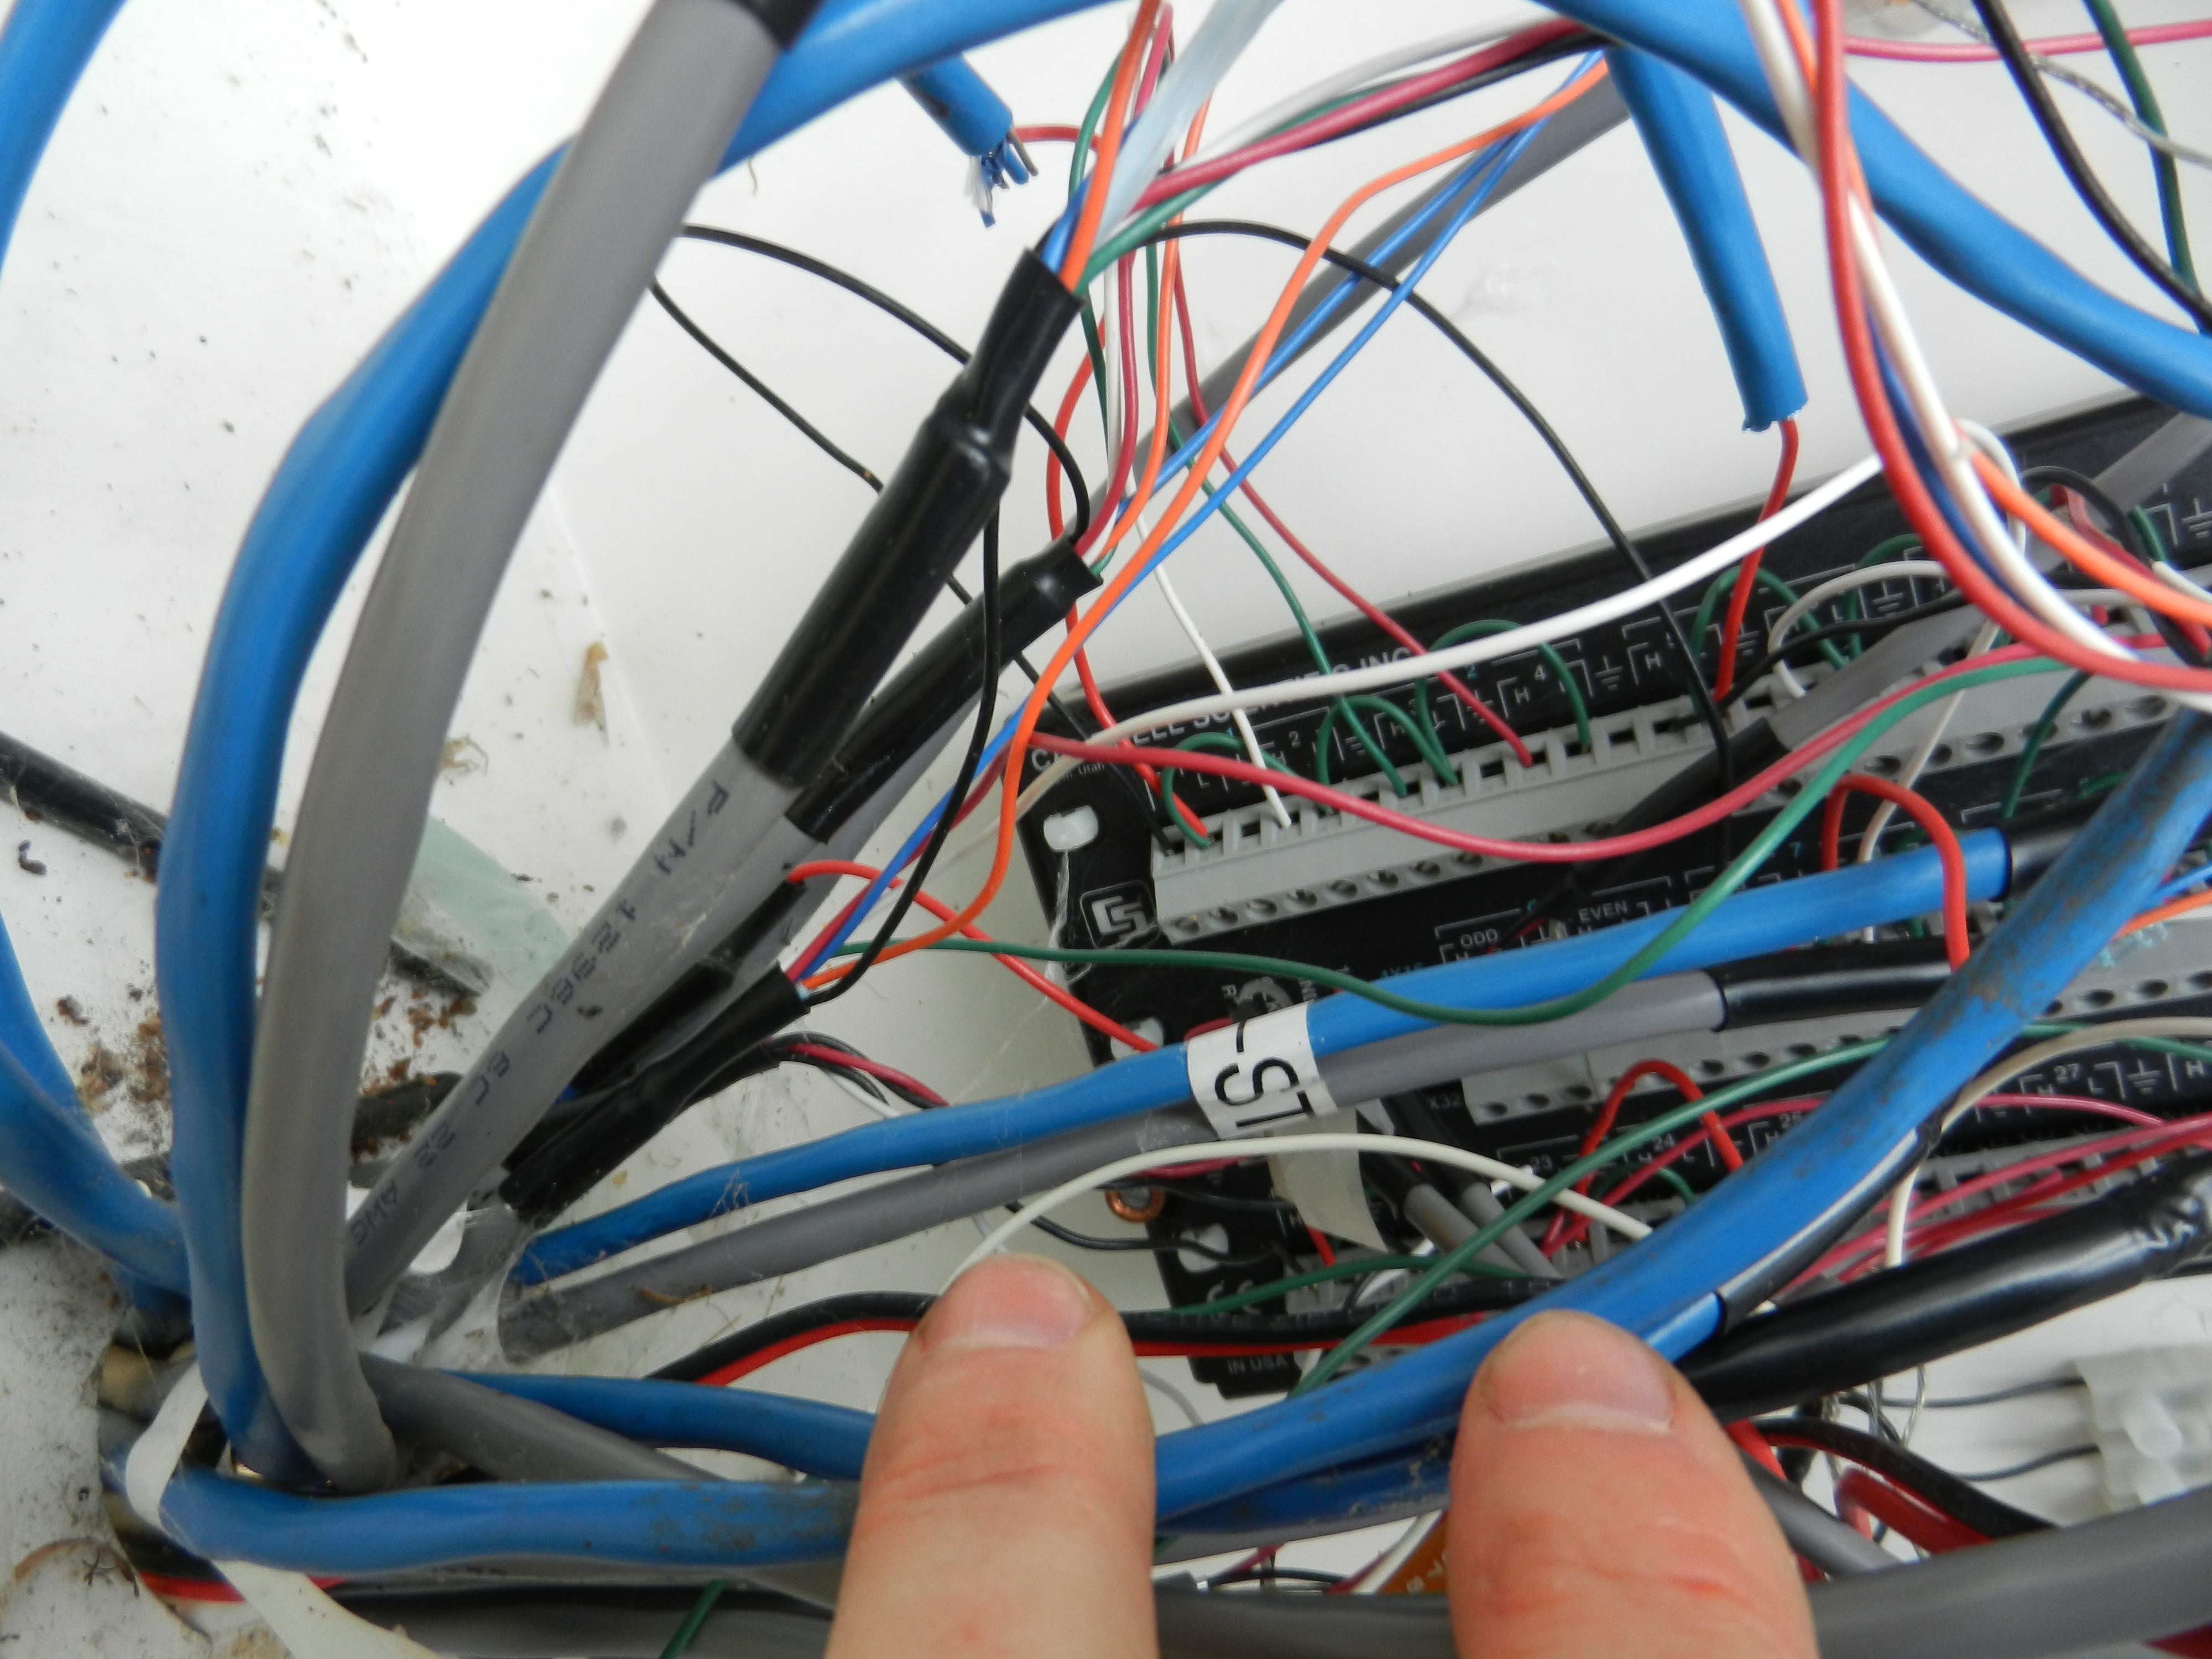
20120201TZ_NSapFlowWiring.jpg ( 2012-02-01 12:52:07 ) Full size: 4000x3000
Wiring inside sap flow data logger box
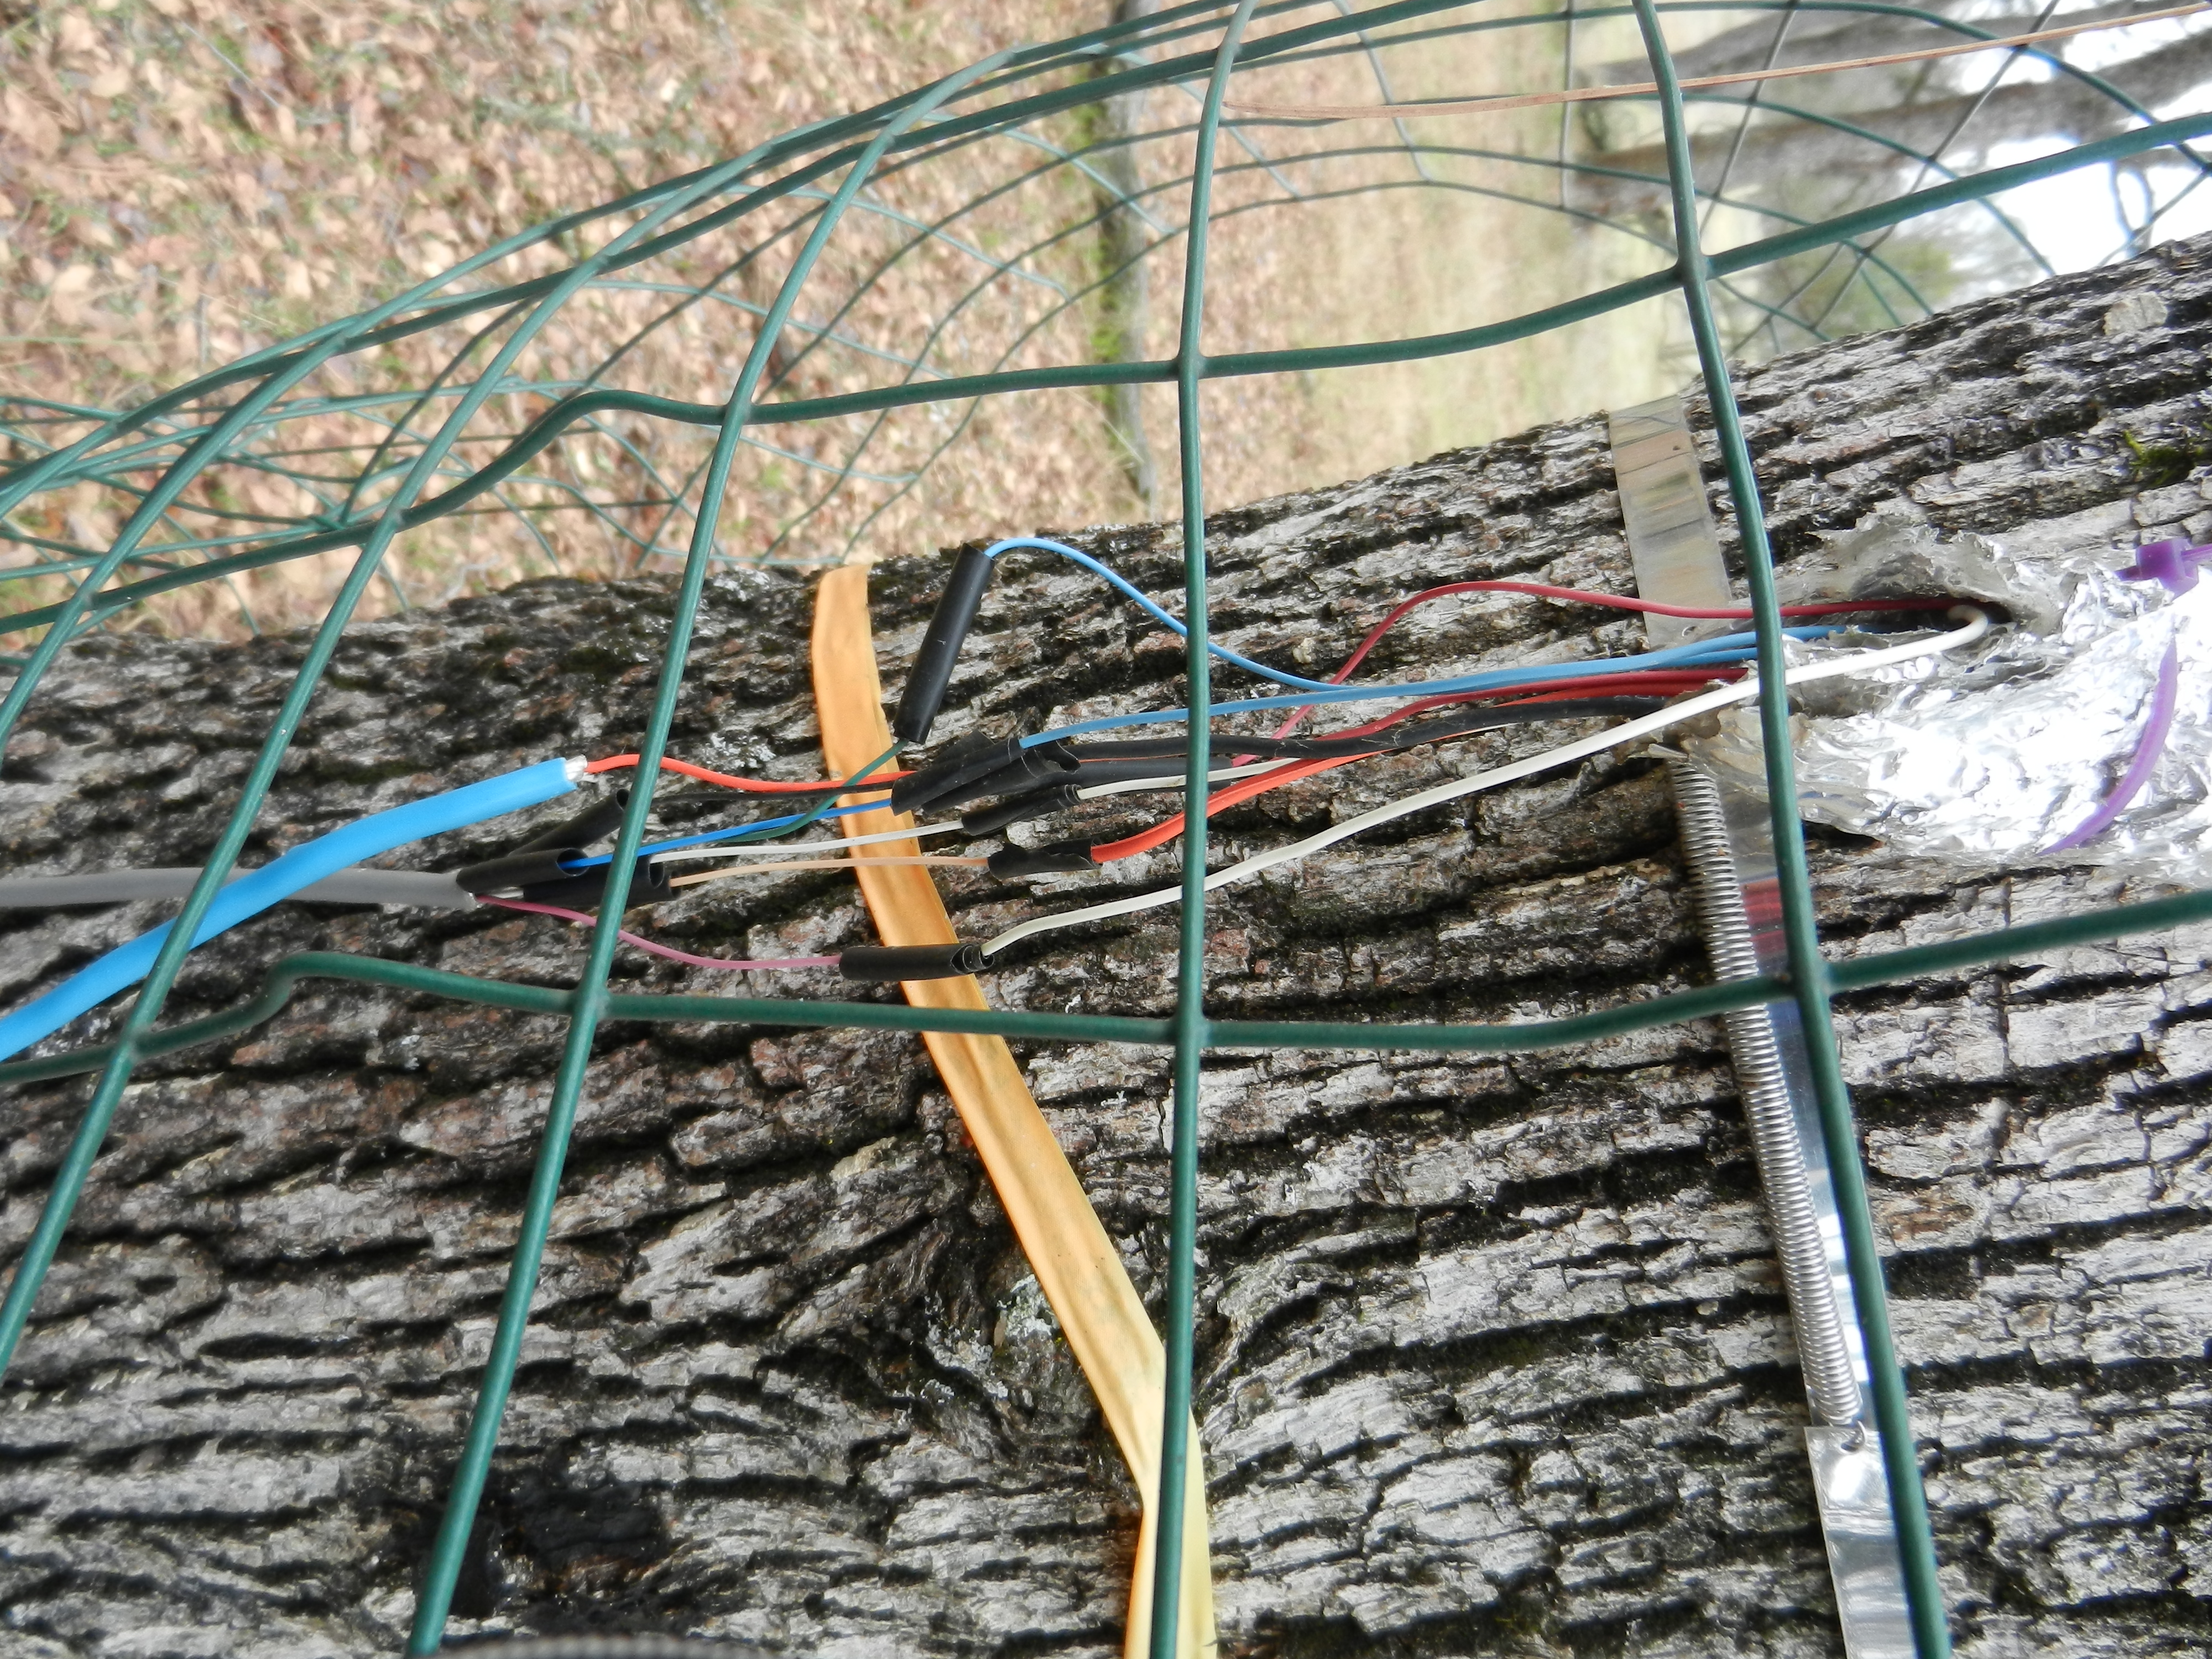
20120201TZ_SapFlowSensor.jpg ( 2012-02-01 12:54:51 ) Full size: 4000x3000
Sap flow sensor in oak trunk
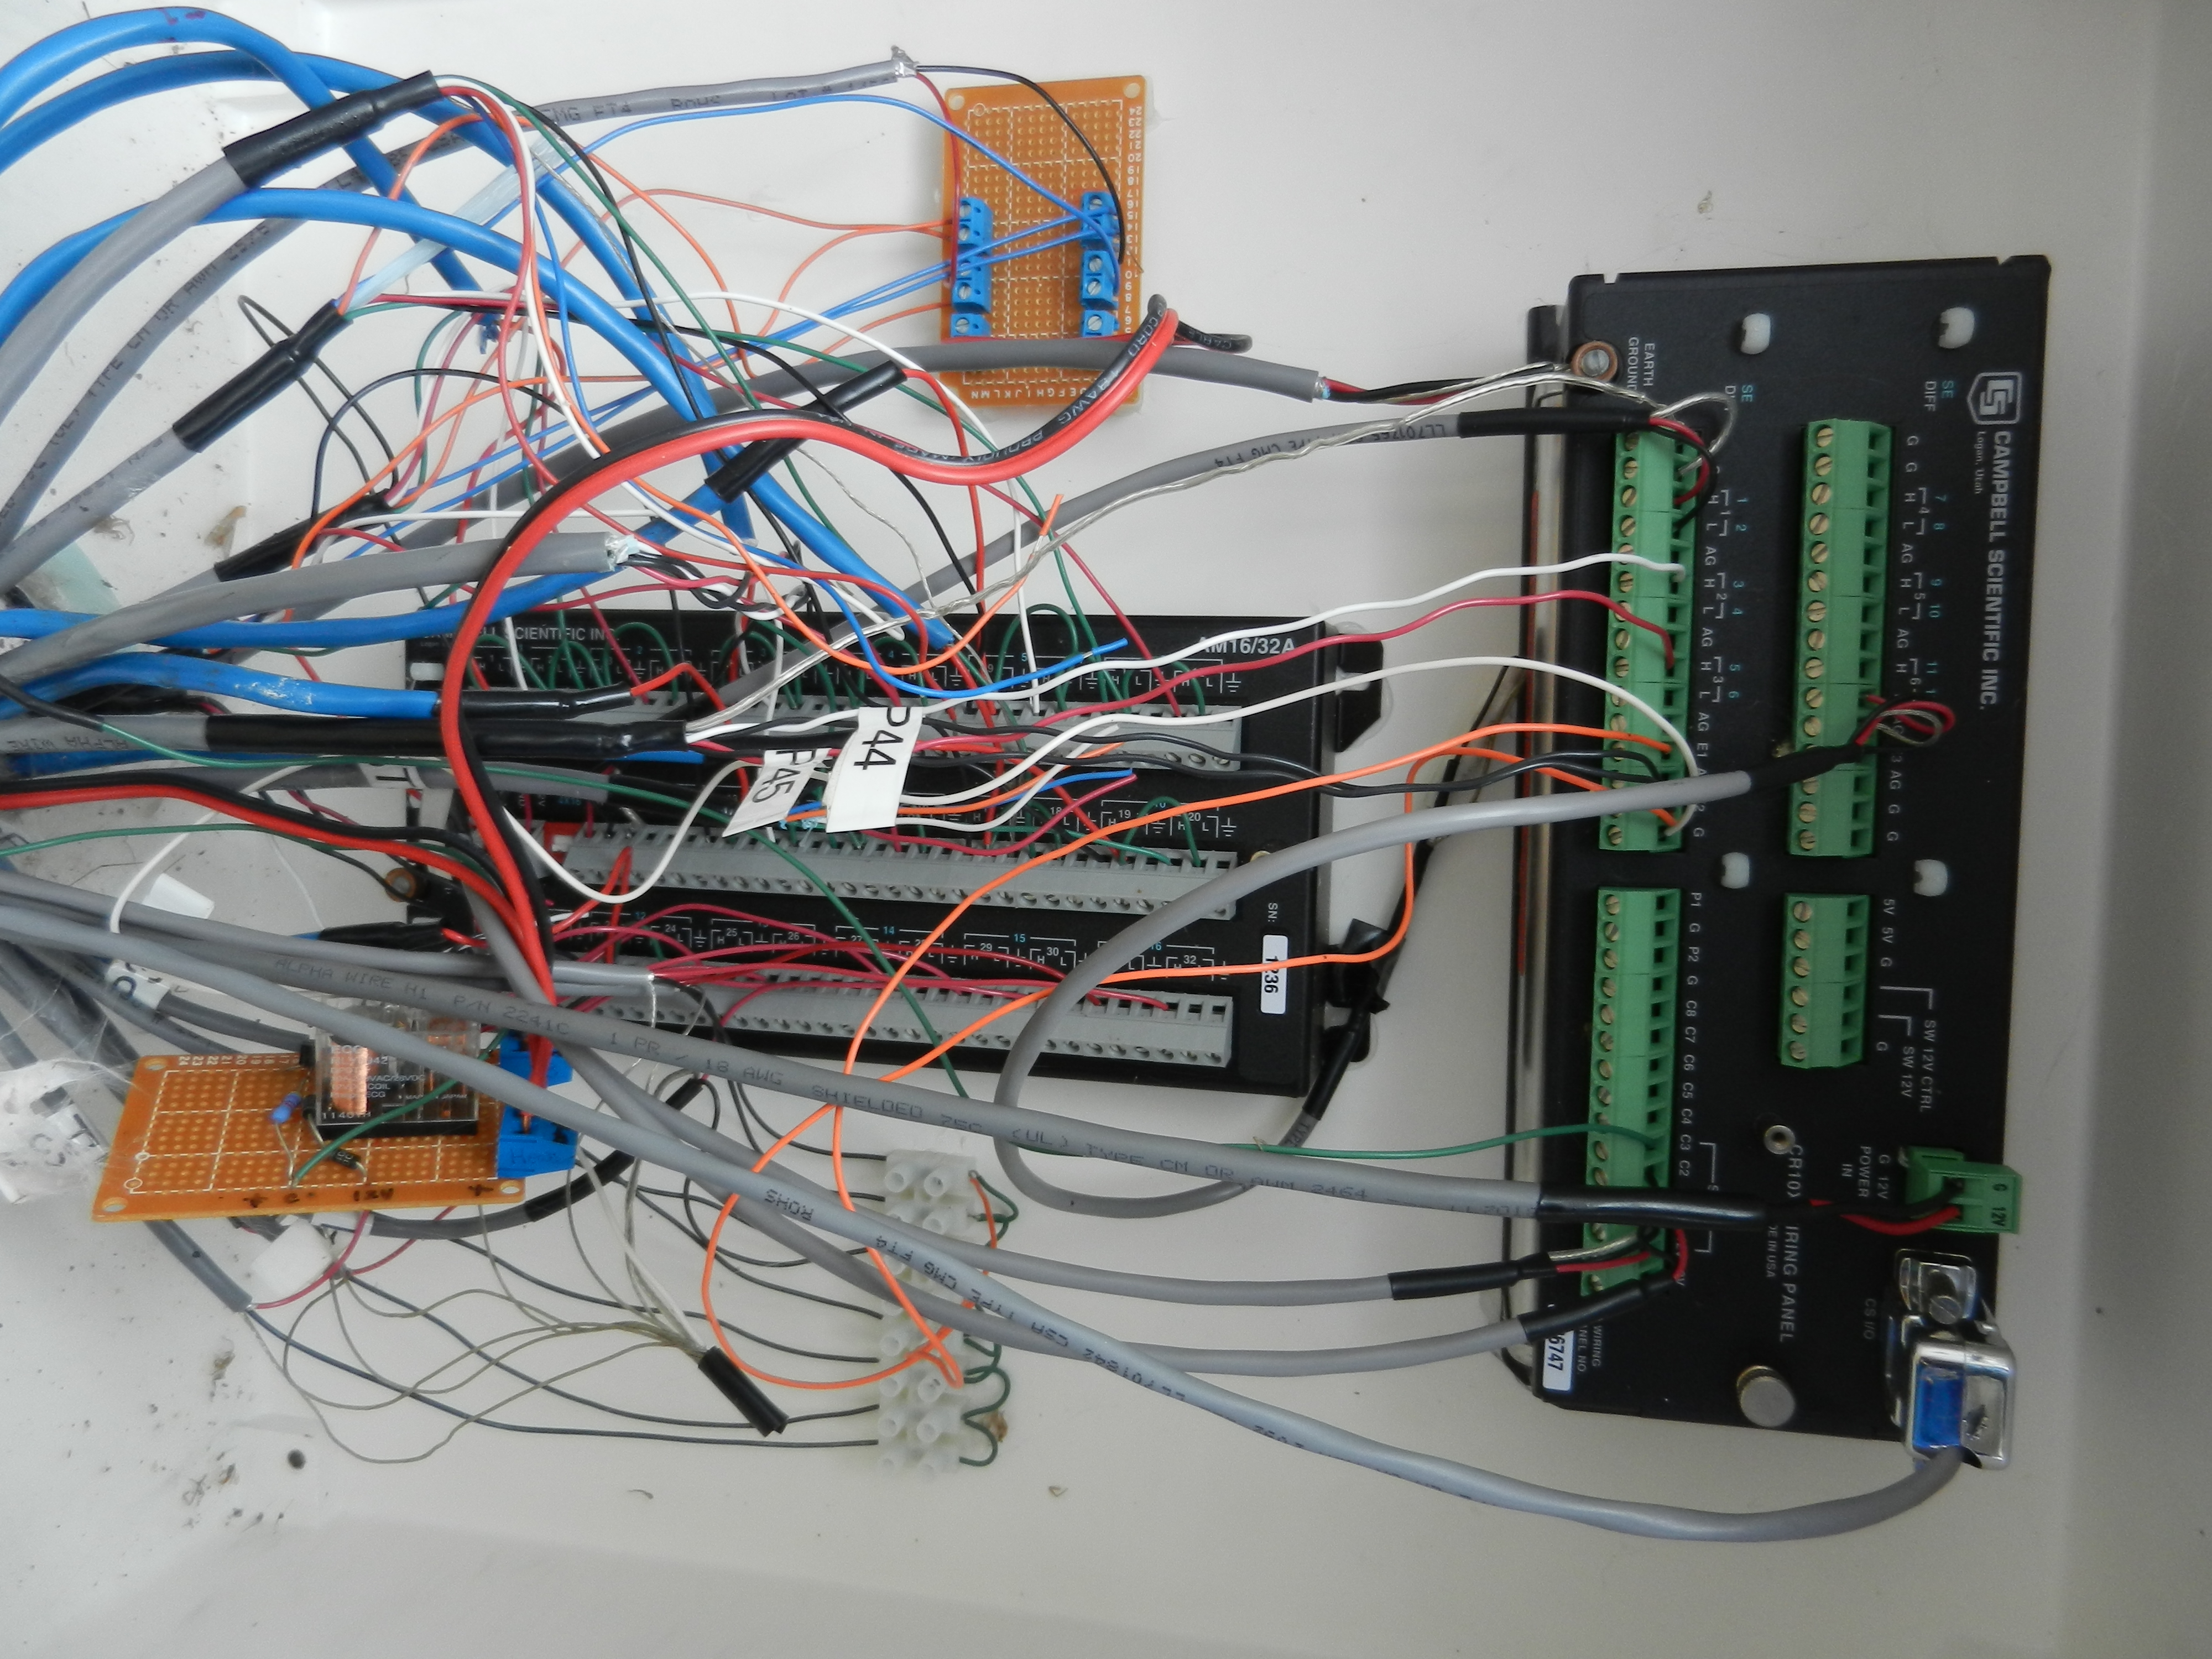
20120201TZ_NSapFlowBox.jpg ( 2012-02-01 12:51:40 ) Full size: 4000x3000
Wiring for sap flow system
16 sets found
No data found for TZ_Fenergy.
11 TZ_tmet graphs found
11 TZ_soilco2 graphs found
Can't check TZ_mixed
3 TZ_mixed graphs found
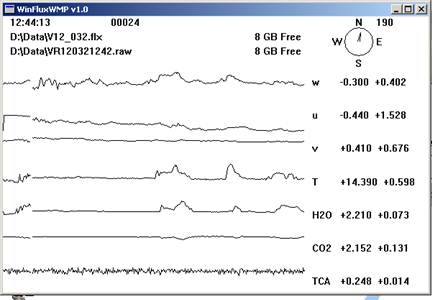
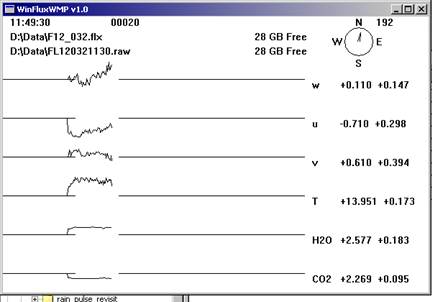
1 TZ_fflux graphs found
8 TZ_fmet graphs found
1 TZ_tram graphs found
3 TZ_co2prof graphs found
No data found for TZ_irt.
No data found for TZ_windprof.
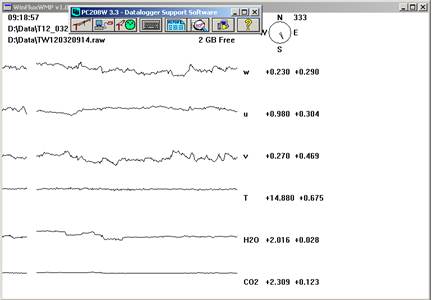
1 TZ_tflux graphs found
2 TZ_sm graphs found
Can't check TZ_met
1 TZ_met graphs found
Can't check TZVR_mixed
8 TZ_osu graphs found
No data found for TZ_fd.
Tonzi Z-cam data