
Field Notes
<--2012-02-01 09:00:00 | 2012-02-09 13:30:00-->Other sites visited today: Vaira | Tonzi
Phenocam link: Searching...
Tonzi: 2012-02-01 09:00:00 (DOY 32)
Author: Joe Verfaillie
Others: Siyan
Summary: Tram down - fixed, floor solar power low, reconnected north sap flow serial, other sap flow stations down.
| Tonzi
2012-02-01 I arrived about 9am with Siyan. It was overcast, wet and cold. There were puddles on the road on the way up. It was kind of misty and wet. The grass looks greener, but there is still a lot of damage from the long dry period. The tram was not running. Its battery was fine. I restarted the data logger and it seemed okay, but when tried to start up it couldn’t get away from the parking spot, I gave it a shove and it went down the track. But it got stuck again. I discovered that the cotter pin had broken and been lost out of the north drive wheel. I replaced the cotter pin with some wire and the tram ran correctly. I need to replace both cotter pins with new steel ones. The floor system was down. The solar system was reading less than 10V then cut off. The batteries jumped back up to better than 12V. I tested individual components of the system. The sonic and IRGA take about 0.7A, the computer 1.4A and the screen about 0.9A. When the screen is idle it pulls less than 0.1A. The power supply for the z-cam pulls about 0.1A. I should swap those out with the new ones. Later in the day there was a little more solar power and I restarted the system. The North sap flow station had been running okay - the serial cable was just loose inside the box. I uploaded a new program to just read the bole temps, soil temps and soil moistures every 10 secs and save 30 min averages. The first 6 soil temps are dead. I don’t understand the wiring for the bole temperatures. The South sap flow station had been reporting data this morning, but the battery was dead when I check on it. I brought the battery in. The west sap flow station also had a low battery. I brought that battery in too. We took some fence posts and insulators to Varia. |
Field Data
No tank data
Well Depth
| Date | Location | Depth (feet) |
|---|---|---|
| 2012-02-01 | TZ_floor | 29.4 |
| 2012-02-01 | TZ_road | 38 |
| 2012-02-01 | TZ_tower | 34.3 |
No TZ Moisture Point data found
No VR Moisture Point data found
No TZ grass heigth found
No VR grass heigth found
Tree DBH
| Date | Tag# | Reading (mm) |
|---|---|---|
| 2012-02-01 | 1 | 17.4 |
| 2012-02-01 | 102 | 9.4 |
| 2012-02-01 | 2 | 16.4 |
| 2012-02-01 | 245 | 20.2 |
| 2012-02-01 | 3 | 14.8 |
| 2012-02-01 | 4 | 19.5 |
| 2012-02-01 | 7 | 15 |
| 2012-02-01 | 72 | 7.2 |
| 2012-02-01 | 79 | 6.7 |
| 2012-02-01 | 8 | 6.6 |
No water potential data found
No TZ Grass Biomass data found
No TZ OakLeaves Biomass data found
No TZ PineNeedles Biomass data found
3 photos found
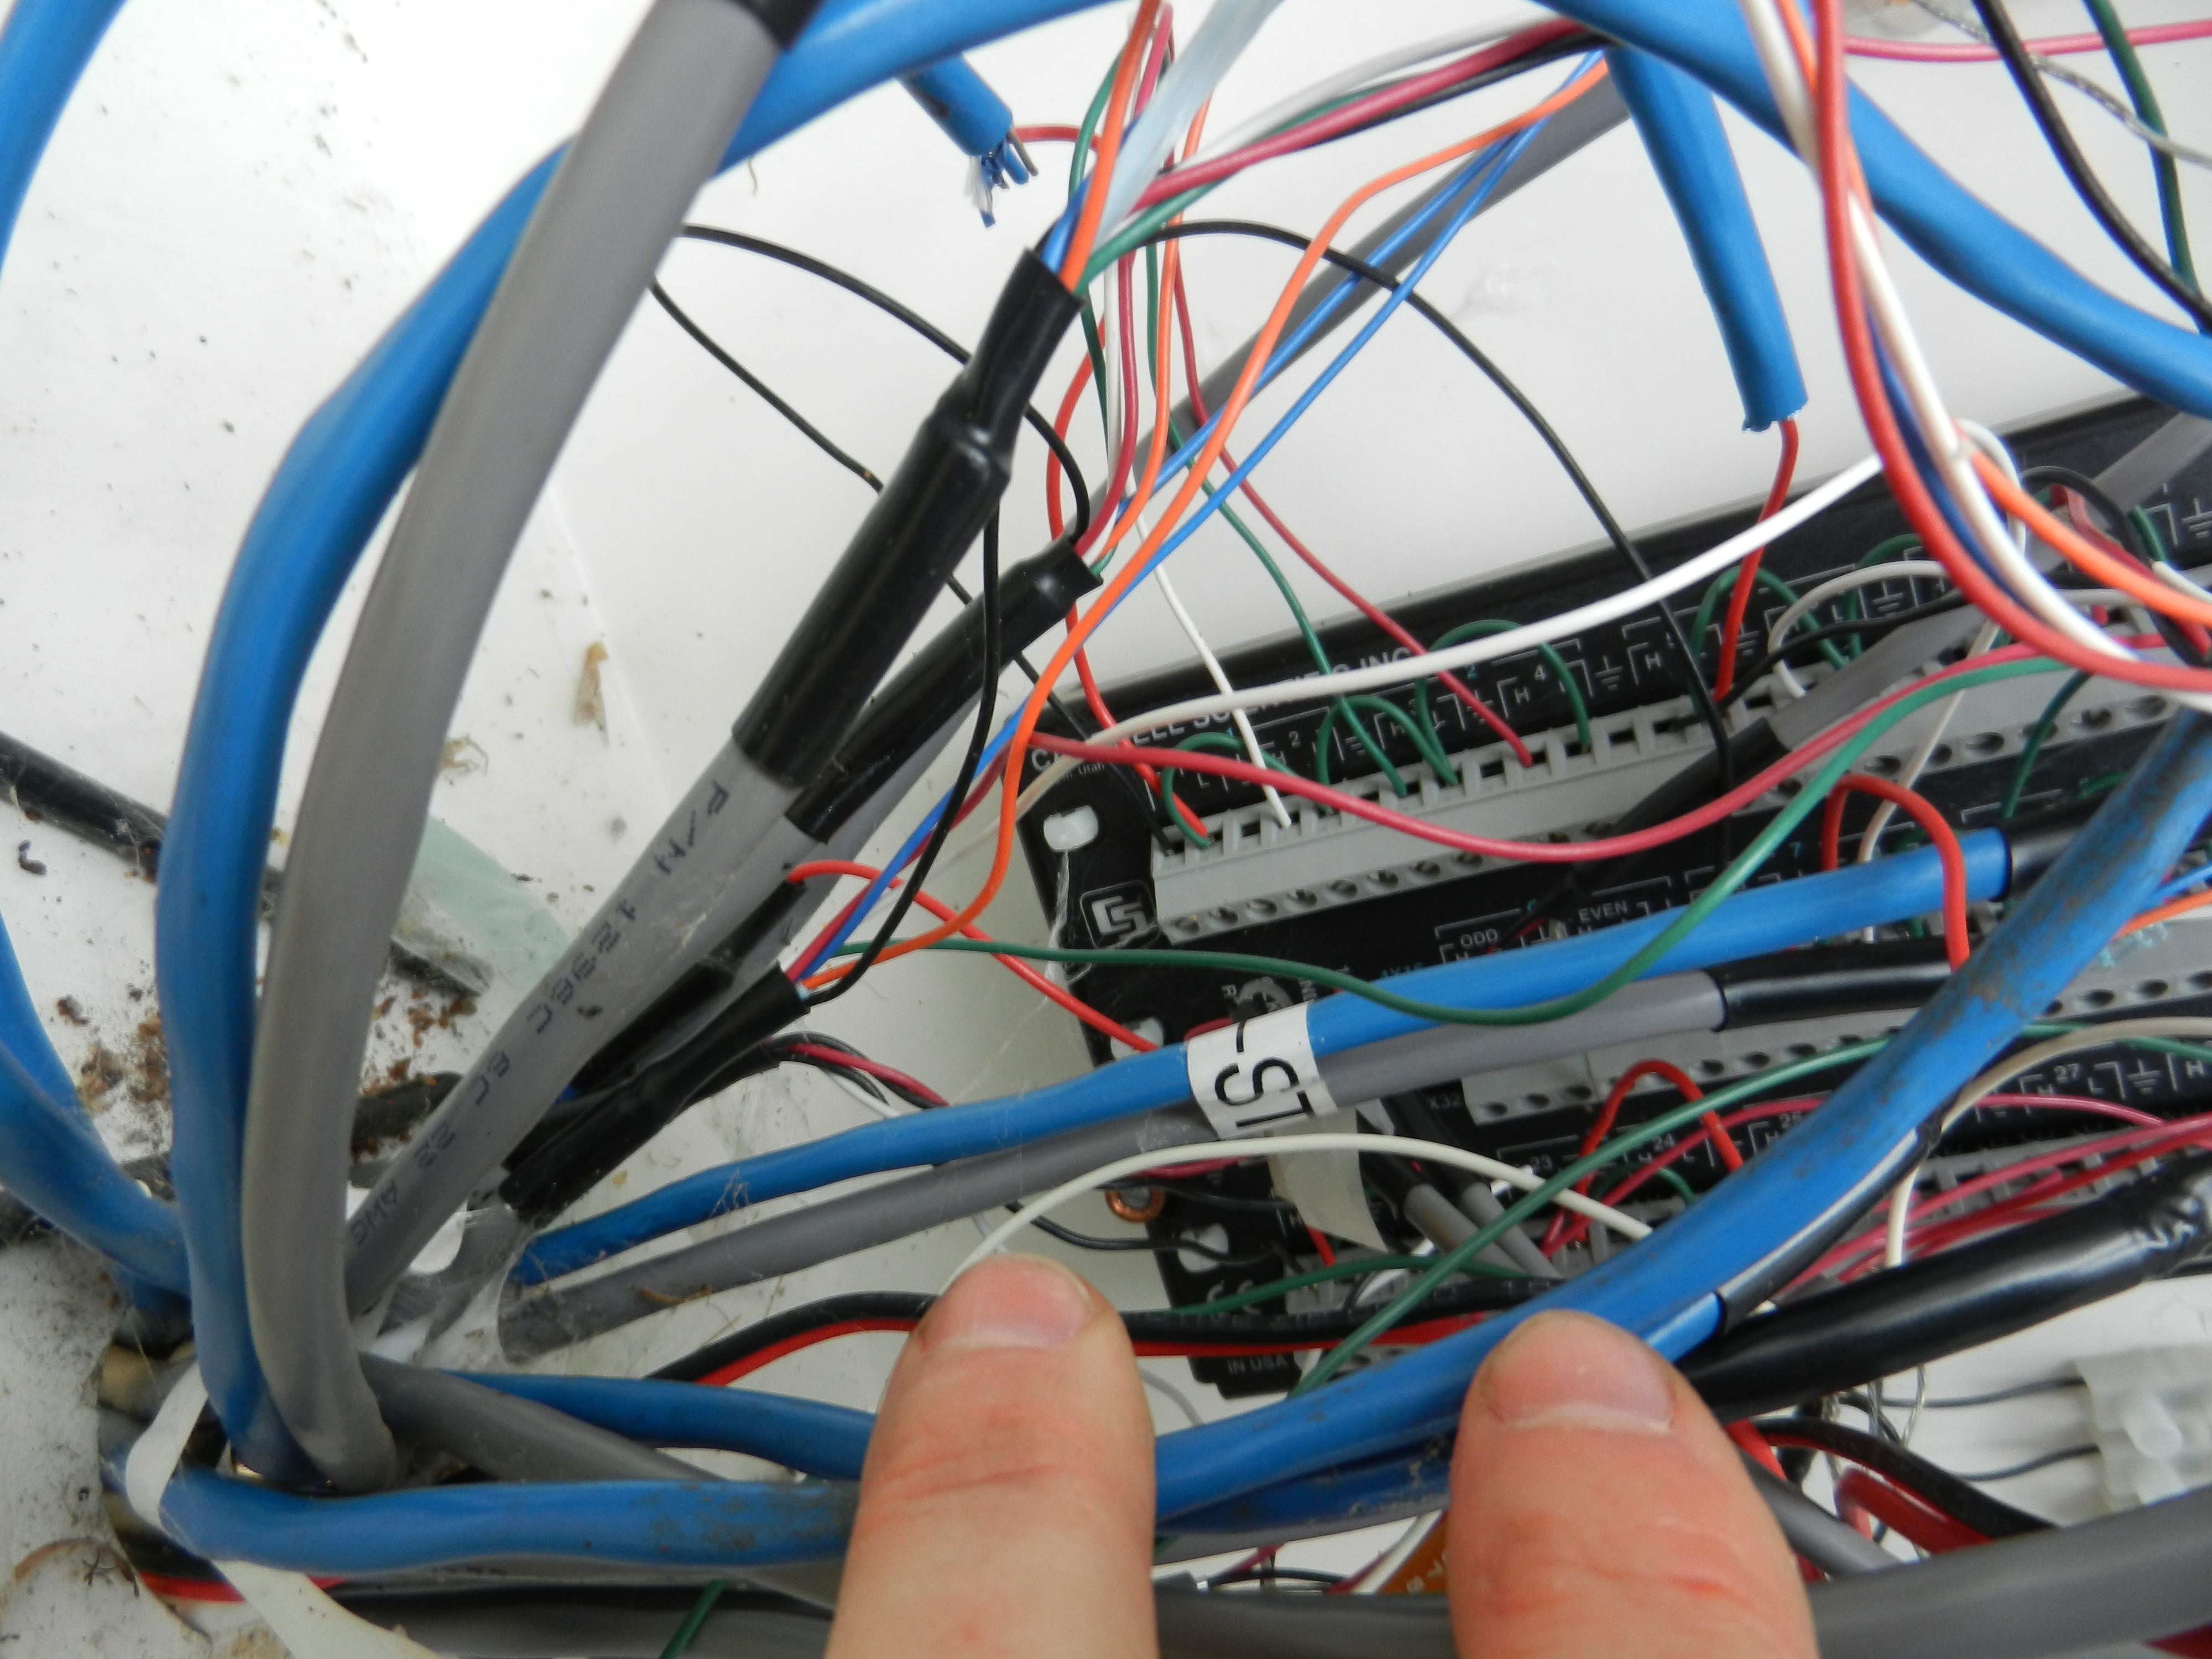
20120201TZ_NSapFlowWiring.jpg ( 2012-02-01 12:52:07 ) Full size: 4000x3000
Wiring inside sap flow data logger box
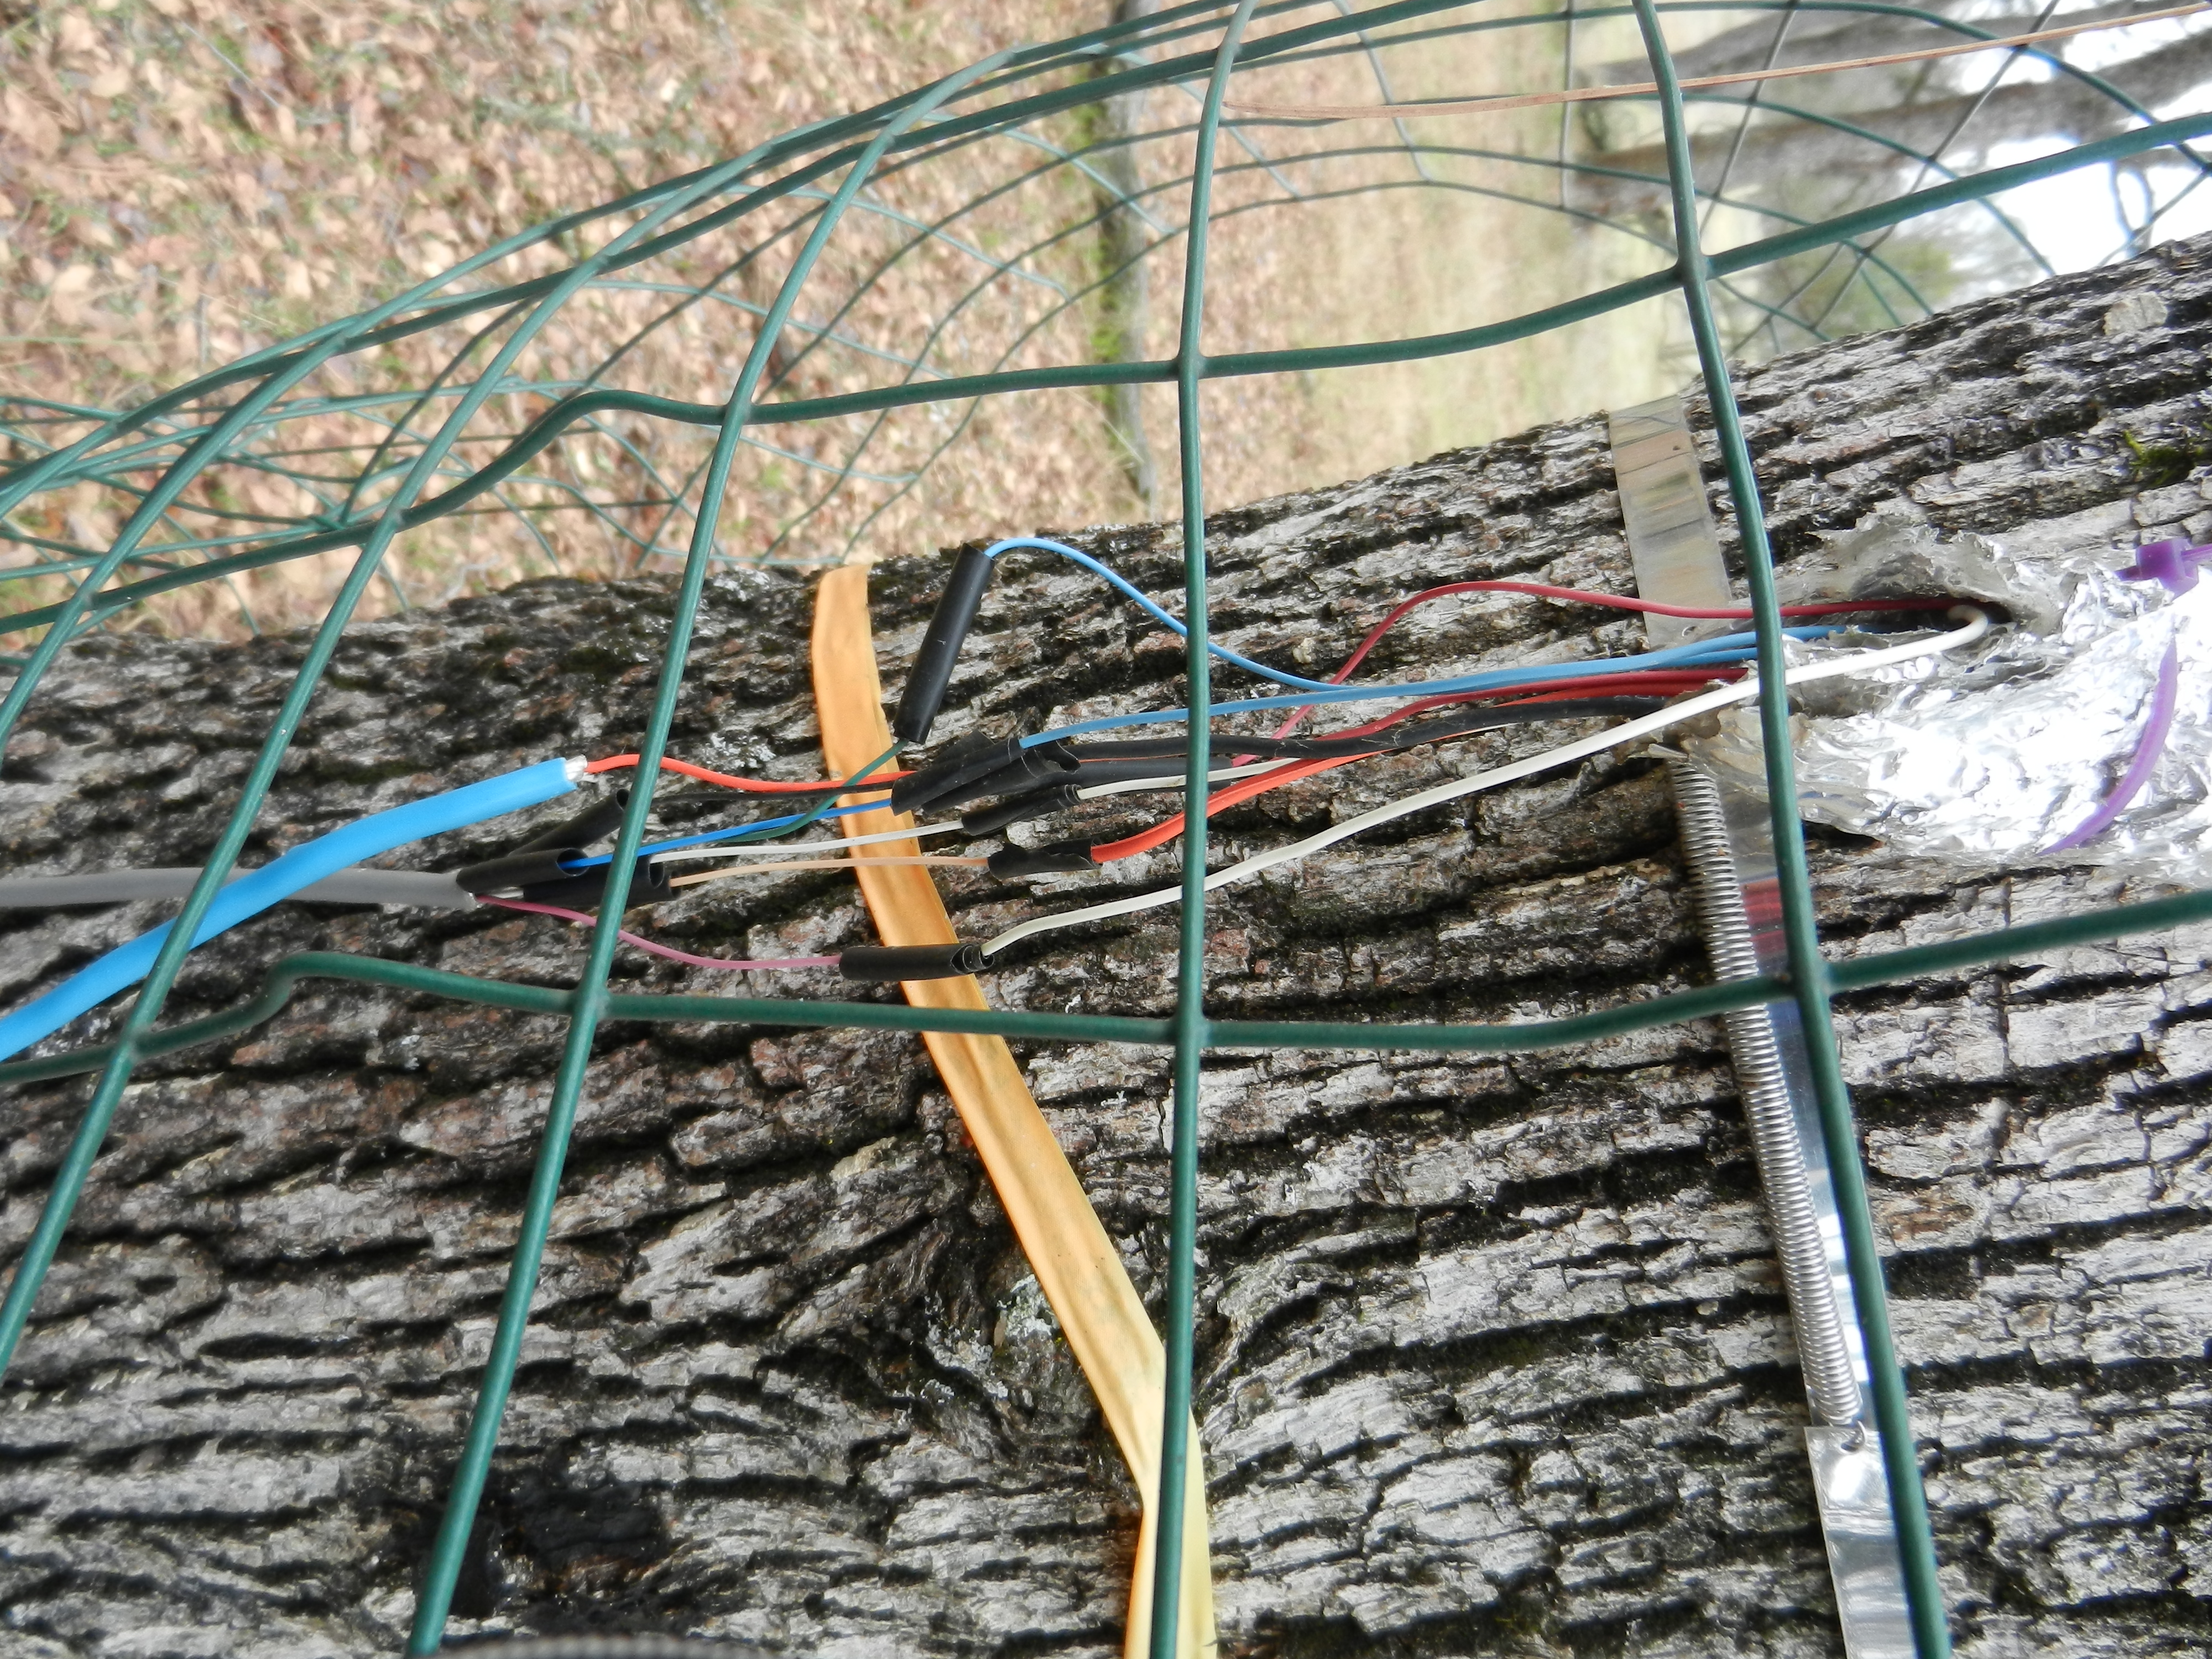
20120201TZ_SapFlowSensor.jpg ( 2012-02-01 12:54:51 ) Full size: 4000x3000
Sap flow sensor in oak trunk
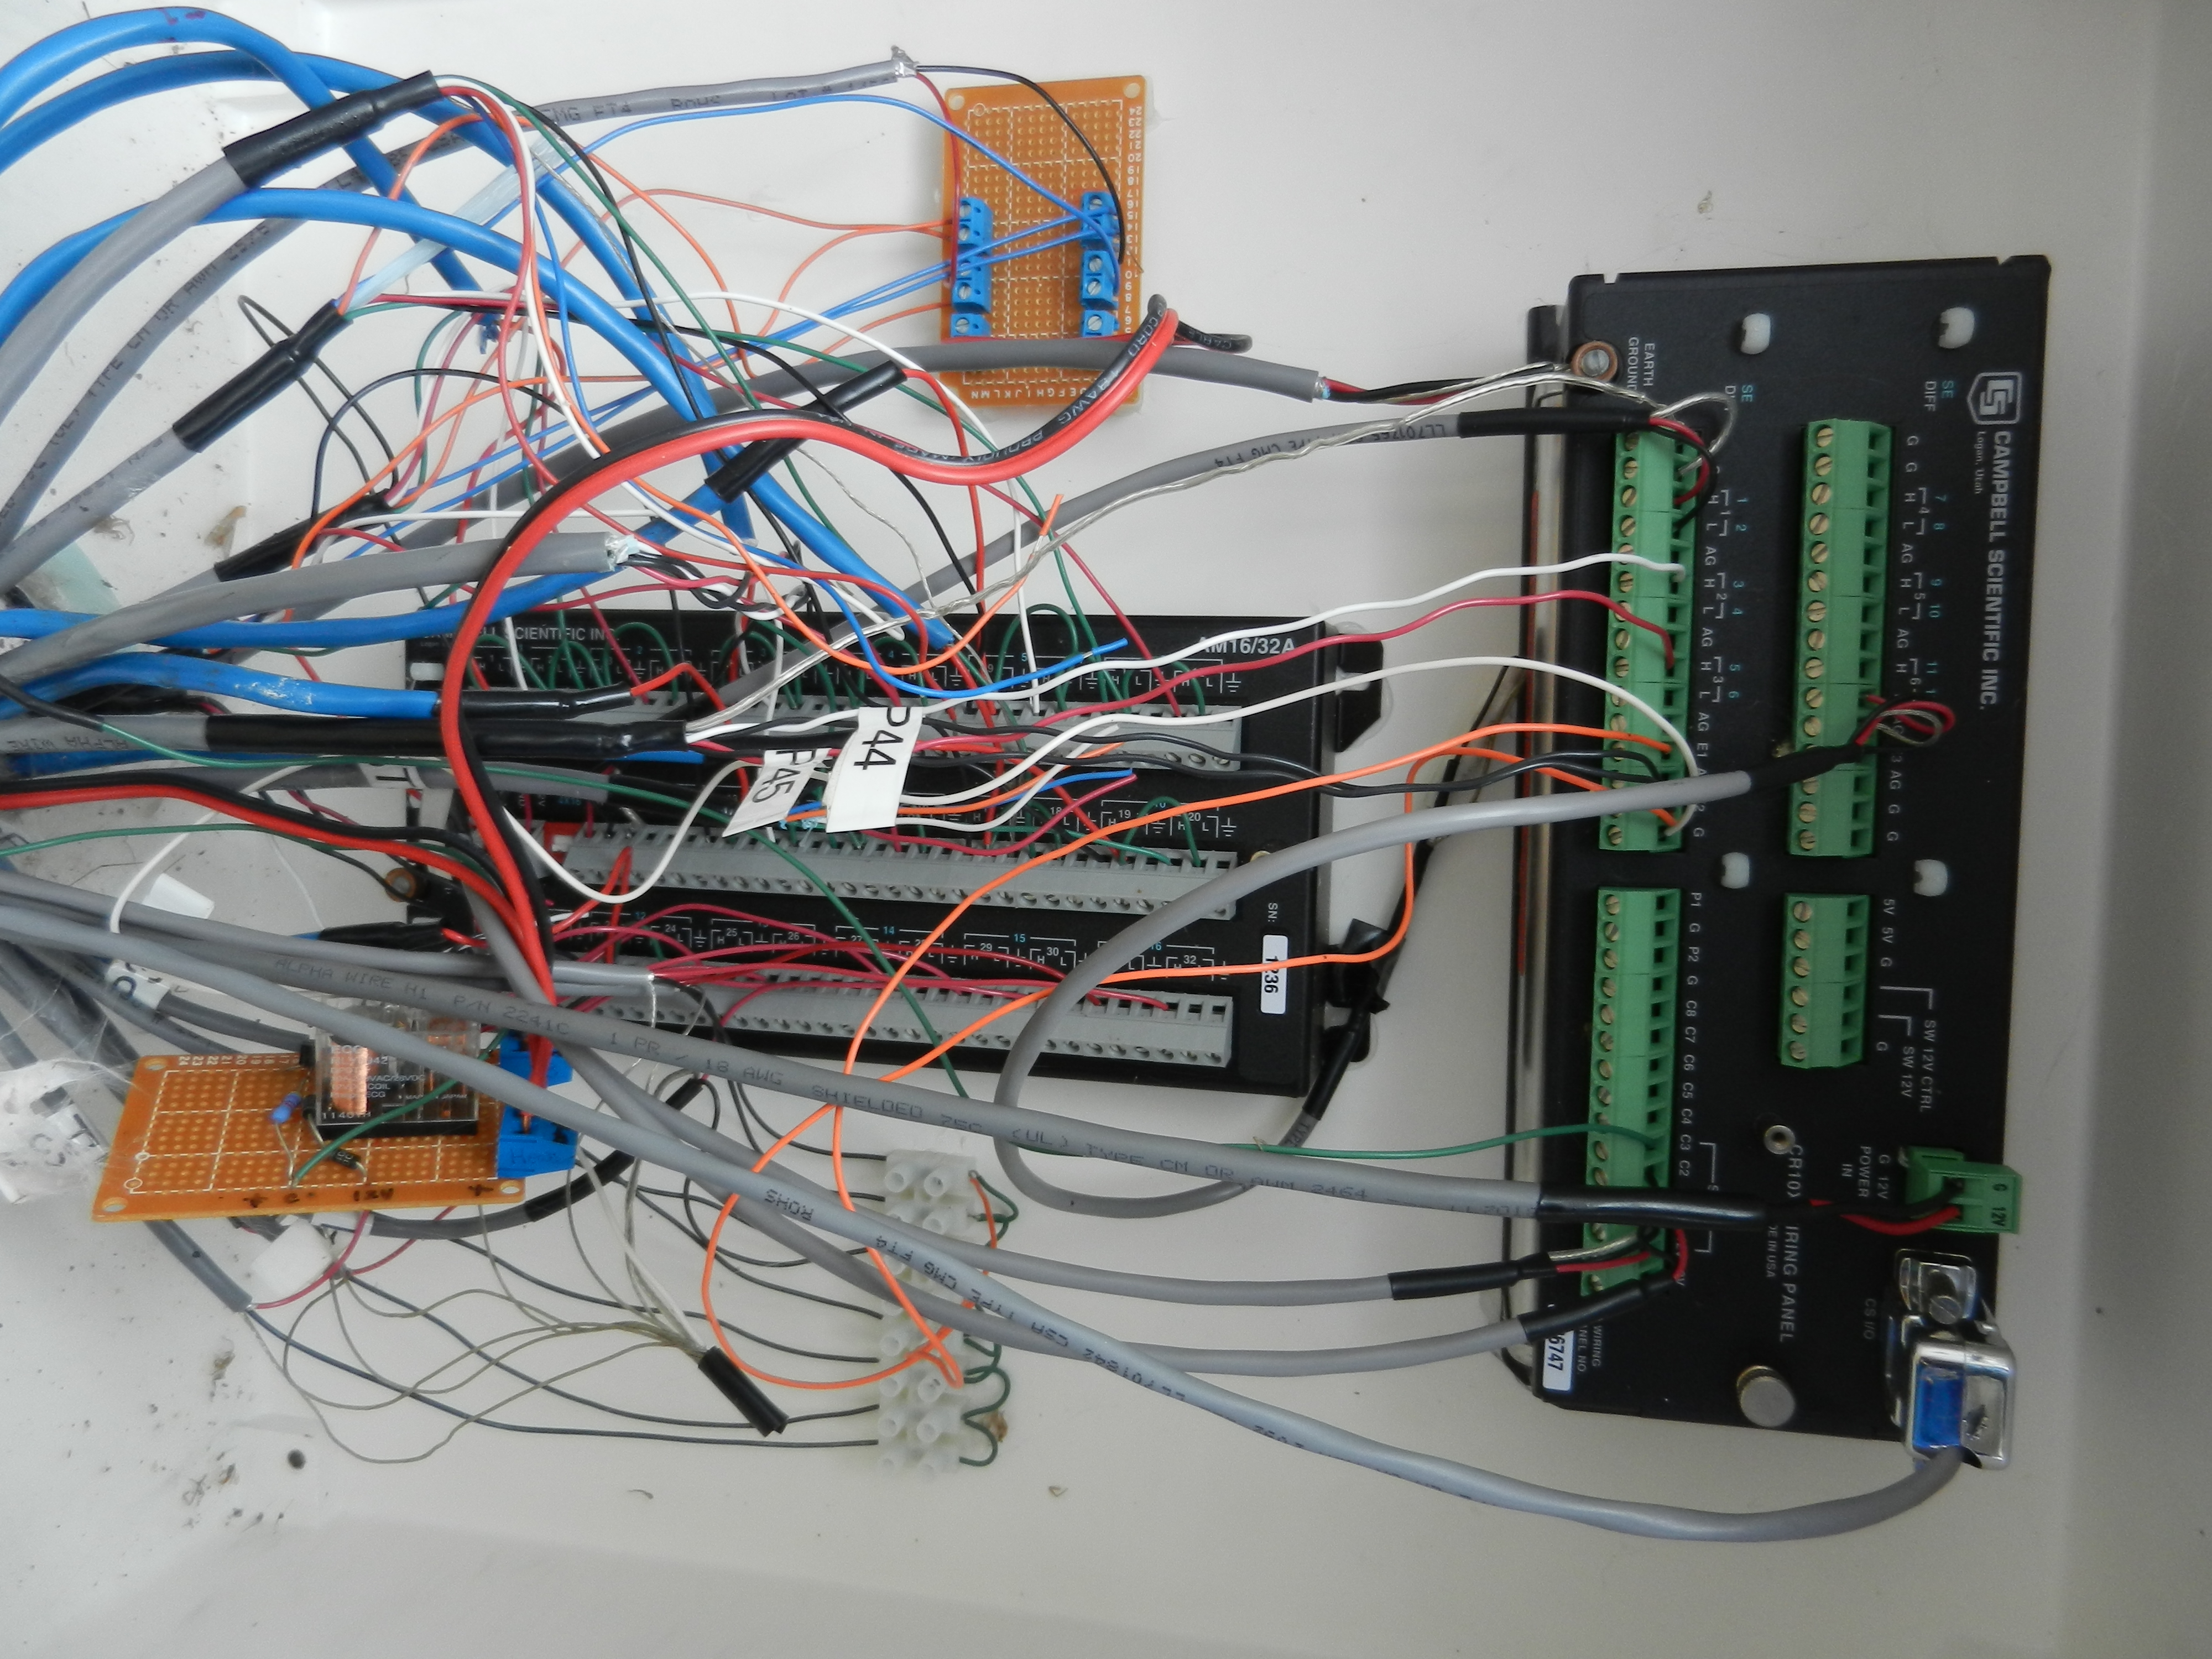
20120201TZ_NSapFlowBox.jpg ( 2012-02-01 12:51:40 ) Full size: 4000x3000
Wiring for sap flow system
16 sets found
No data found for TZ_Fenergy.
11 TZ_tmet graphs found
11 TZ_soilco2 graphs found
Can't check TZ_mixed
3 TZ_mixed graphs found
1 TZ_fflux graphs found
8 TZ_fmet graphs found
1 TZ_tram graphs found
3 TZ_co2prof graphs found
No data found for TZ_irt.
No data found for TZ_windprof.
1 TZ_tflux graphs found
2 TZ_sm graphs found
Can't check TZ_met
1 TZ_met graphs found
Can't check TZVR_mixed
8 TZ_osu graphs found
No data found for TZ_fd.
Tonzi Z-cam data