Field Notes
<--2011-03-22 10:30:00 | 2011-04-22 11:00:00-->Other sites visited today: Mayberry | Twitchell Rice
Phenocam link: Searching...
Sherman Island: 2011-04-13 11:00:00 (DOY 103)
Author: Joe Verfaillie
Others: Jaclyn, Gavin
Summary: Installed cow fence around power pole, swapped computer, standard field work.
| Sherman
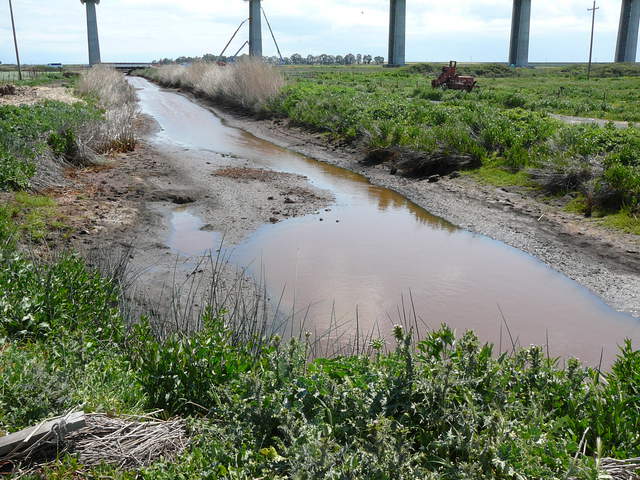
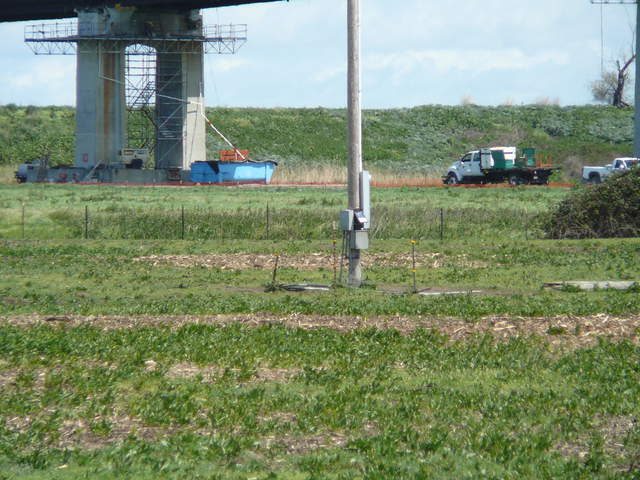
4/13/2011 I arrived about 10:30 with Jaclyn and Gavin. Scatter rain showers giving way to a sunny break in the clouds. The wind was from the southwest but shifting to the west. The water in the ditch along the road was as low as I have ever seen it. Peperweed in the field is 10 to 20cm high. Inside the cow fence it is about 50cm and the grass is almost as high. The computer seemed to be locked up. On restart it crashed again. I pulled it out and swapped in another. I got the web cam, the cr10x1_met and cr1000 setup on it, but I did not get the fast radiation setup. The diffuse is being pulled to the met data set so only missing data is the 2sec radiation. I setup a cow fence around the power pole using and old shocker from Kevin’s site at Tonzi. It still needs some work – a new battery and one fence post need to be pulled and replaced. We’ll see if it works next week. We pulled one of the Vaisala soil probes, but forgot the filter enclosure for more response testing in the lab. |
4 photos found

20110413SI_DitchByRoad.jpg ( 2011-04-13 10:46:52 ) Full size: 2560x1920
Low water level in the ditch at the edge of the cow pasture

20110413SI_PowerPole.jpg ( 2011-04-13 10:46:40 ) Full size: 2560x1920
Retrofitting of the bridge piers

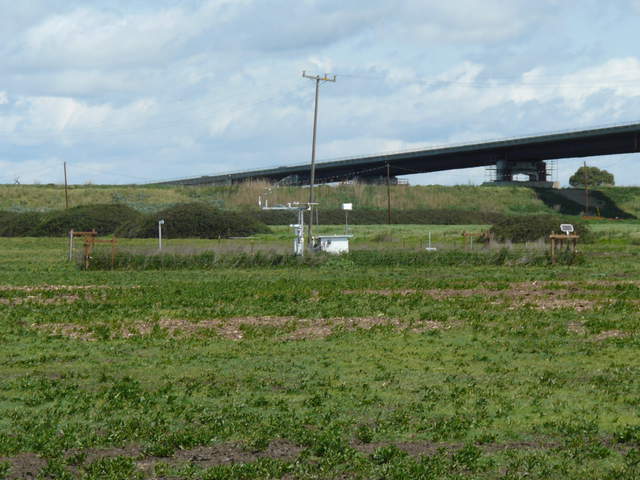
20110413SI_Tower.jpg ( 2011-04-13 10:46:34 ) Full size: 2560x1920
View of the Sherman Pasture site with green grass

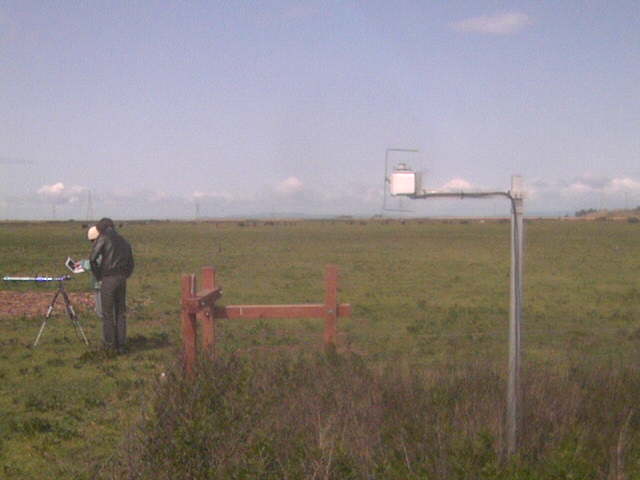
SI_webcam_20111031015.jpg ( 2011-04-13 10:15:04 ) Full size: 640x480
Jaclyn and Gavin with spectrometer
7 sets found
No data found for SI_mp.
11 SI_met graphs found
Can't check SI_mixed
2 SI_mixed graphs found
5 SI_flx graphs found
2 SI_soilco2 graphs found
Can't check TWSI_mixed
Can't check SIMBTWEE_met

