Field Notes
<--2024-11-19 10:10:00 | 2024-12-19 09:20:00-->Other sites visited today: Mayberry | East End | Bouldin Corn | Bouldin Alfalfa | Hill Slough | Rush Ranch
Phenocam link: Searching...
Gilbert Tract: 2024-12-04 07:05:00 (DOY 339)
Author: Daphne Szutu
Others: Carlos
Summary: Cold and foggy, removed one azolla decomposition replicate, lowered Campbell conductivity and CTD sensor, raised miniDOT height, EXO depth weird--power cycle seemed to fix it, lots of wildlife--otters, sea lion, birds galore
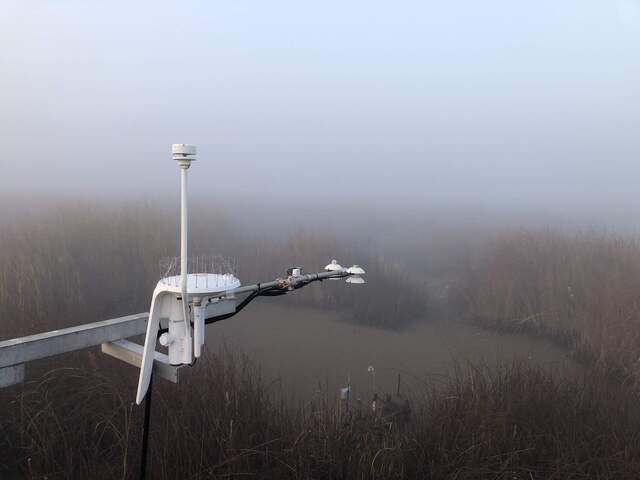
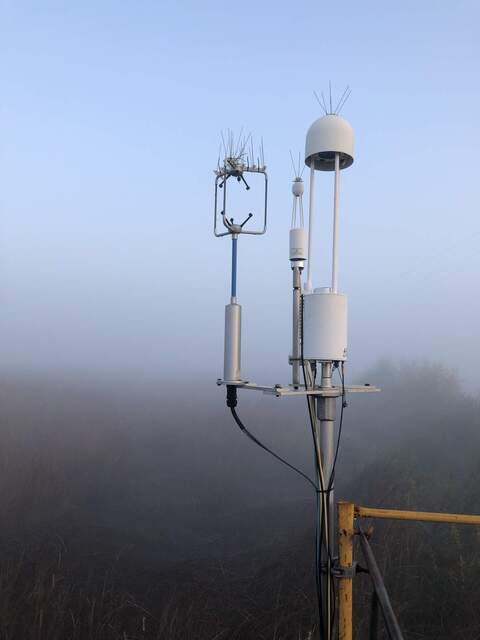
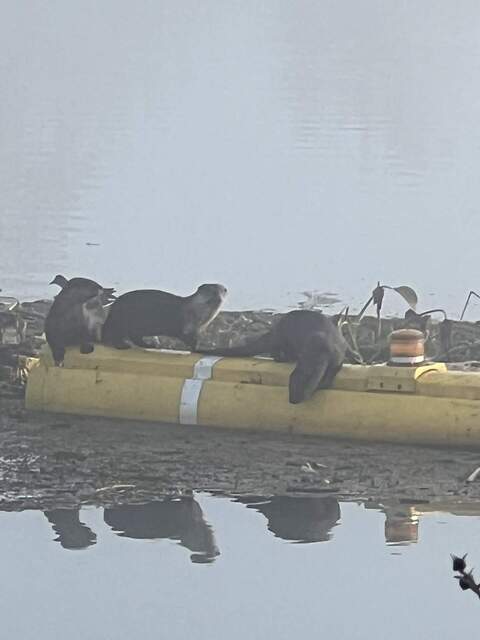
| 2024-12-04 Gilbert Tract Carlos and I arrived at 7:05 PST. It was cold and still with thick fog. The gate was wide open so we drove through. As we arrived to our parking spot, someone form River Partners drove by to check on who we are and what we were up to. While we were working, it sounded like they were mowing/trimming along the road, but later we didn’t see any debris on the side of the road, just passed by an ATV with a string trimmer sticking out of it. We replaced the upper boardwalk on the tower (it was removed last time for storm prep). I downloaded met, cam, and USB GHG data. Carlos cleaned flux and rad sensors. He reported lots of dew and spiderwebs on the radiometers. There was so much water vapor in the air that it was hard to get the RSSI and SS very high. Carlos said the precip bucket was clean. The reservoir was 2/3 full; we refilled it. I downloaded the Song Meter Micro data and swapped its desiccant. I connected via Bluetooth and it automatically synched its location and time. Its battery level was at 98%. I exported a few cold wasps out of the met enclosure. I don’t know if wasps are still coming in or these are the ones that have been hiding out behind the backing board. I think we can try stuffing the enclosure holes with steel wool instead of putty. 7500 read: 522ppm CO2, -176mmol/m3 H2O (low SS), 2.6C, 102.3kPa, 50SS (probably dew)--90 after cleaning 7700 read: 3.2ppm CH4, 10RSSI – 29 after cleaning I meant to write down the post-cleaning numbers but forgot. The staff gauge read 73cm at 7:35 PST. I measured the surface water conductivity. Surface, 954uS, 8.5C I downloaded the miniDOT, swapped its battery as part of the annual routine, swapped its desiccant, measured its height, and raised it because Kuno said it was mostly reading 0 so was probably buried in the mud. When the staff gauge read 74cm, I raised the miniDOT 10cm so it went from 66cm below the water to 56cm below the water. Carlos got in the water to retrieve one of Kuno’s azolla decomposition bags. The water was supposed to be warmer than the air (8.5C compared to 2.6C), but Carlos did not think so. After he dried his arm off and rolled down his sleeve, I remembered I also wanted him to to check the Campbell conductivity sensor—its data looks like its being exposed to air at low tide. When the staff gauge read 74cm, he moved the Campbell conductivity and CTD sensor (they’re tied together) so they went from 43cm below the water to 54cm below the water (that was as far as we could go without getting his shirt wet). Carlos dried off his arm again and got out of the wetland before I could think of another reason for him to plunge his arm into the water. The Campbell conductivity and CTD sensor were supposed to be tied to the fence post, so I’m not sure why it had moved up so much. Maybe an otter swam over the cables leading to the boardwalk. Joe thinks it’s the weight of the azolla slowly dragging the cable down with each tidal cycle. We got to the channel around 8:10 PST. At the breach, we saw a sea lion swimming around and eating a fish. We also saw three otters hanging out on the yellow plastic divider, then later swimming into the wetland past us (and one was eating a crayfish while swimming). I downloaded the ADCP and EXO data. The EXO depth looked weird (step change to negative noise) in the last few days, but it looked fine after a power cycle. The WipeV also looked weird (step change) during the same time frame, but it wasn’t 0 so I think it’s still working. Check again at the next site visit. We left at 8:35 PST. Looking at the data back in the lab, all of the EXO data got noisy starting 2024-11-30 and turbidity started increasing. We might need to pull it up next time to check the wiper. Hopefully this wiper did not start leaking... |
3 photos found

20241204GT_FoggyRadiometers.jpg ( 2024-12-04 07:39:27 ) Full size: 1920x1440
Foggy morning

20241204GT_FoggySensors.jpg ( 2024-12-04 07:39:42 ) Full size: 1440x1920
Foggy morning

20241204GT_Otters.jpg ( 2024-12-04 08:12:17 ) Full size: 1440x1920
Otters hanging out on the yellow divider at the channel
8 sets found
Can't check MBWPEESWGT_mixed
Can't check MBEEWPSWEPGT_cam
16 GT_met graphs found
4 GT_flux graphs found
3 GT_adcp graphs found
1 GT_cam graphs found
2 GT_usgs graphs found
2 GT_chanexo graphs found

