
Field Notes
<--2024-11-19 16:10:00 | 2024-12-18 09:15:00-->Other sites visited today: Gilbert Tract | Mayberry | East End | Bouldin Corn | Bouldin Alfalfa | Rush Ranch
Phenocam link: Searching...
Hill Slough: 2024-12-04 13:50:00 (DOY 339)
Author: Daphne Szutu
Others: Carlos
Summary: Regular data collection/cleaning, warm and mild, channel enclosure is missing its lower latch
| 2024-12-04 Hill Slough Carlos and I arrived at 13:50 PST. It was mild and sunny with a cool breeze. Much warmer than the morning now. The water level was relatively high. There was a Ducks Unlimited truck leaving through the gate by our parking spot when we arrived. I said hi but the driver was not interested in chatting. The staff gauge read 5.57ft at 14:02 PST. I downloaded met, cam, and USB GHG data and measured surface and porewater conductivity. Carlos cleaned flux and rad sensors and cleaned some fluff out of the rain bucket. The reservoir was 2/3 full and he refilled it. At the channel, I downloaded miniDOT data, swapped its desiccant, and swapped its batteries as part of the annual routine. Carlos changed the CTD desiccant (we had to trim this CTD cable in the past so it doesn’t have its usual Teflon-covered vent). The channel enclosure is missing its lower latch (Joe replaced the upper latch in the past). Surface, 6.06mS, 13.2C Porewater, 8.41mS, 14.6C The 7500 read: 452ppm CO2, 450mmol/m3 H2O, 19.3C, 102.4kPa, 99SS - 100 after cleaning The 7700 read: 2.2ppm CH4, 53RSSI - 88 after cleaning We need new wood for the lower boardwalk at the tower. Kyle also noticed the RSSI has been noisy this year compared to 2023. Joe suggested to turn up the heater settings next time. We left at 14:15 PST. |
1 photos found
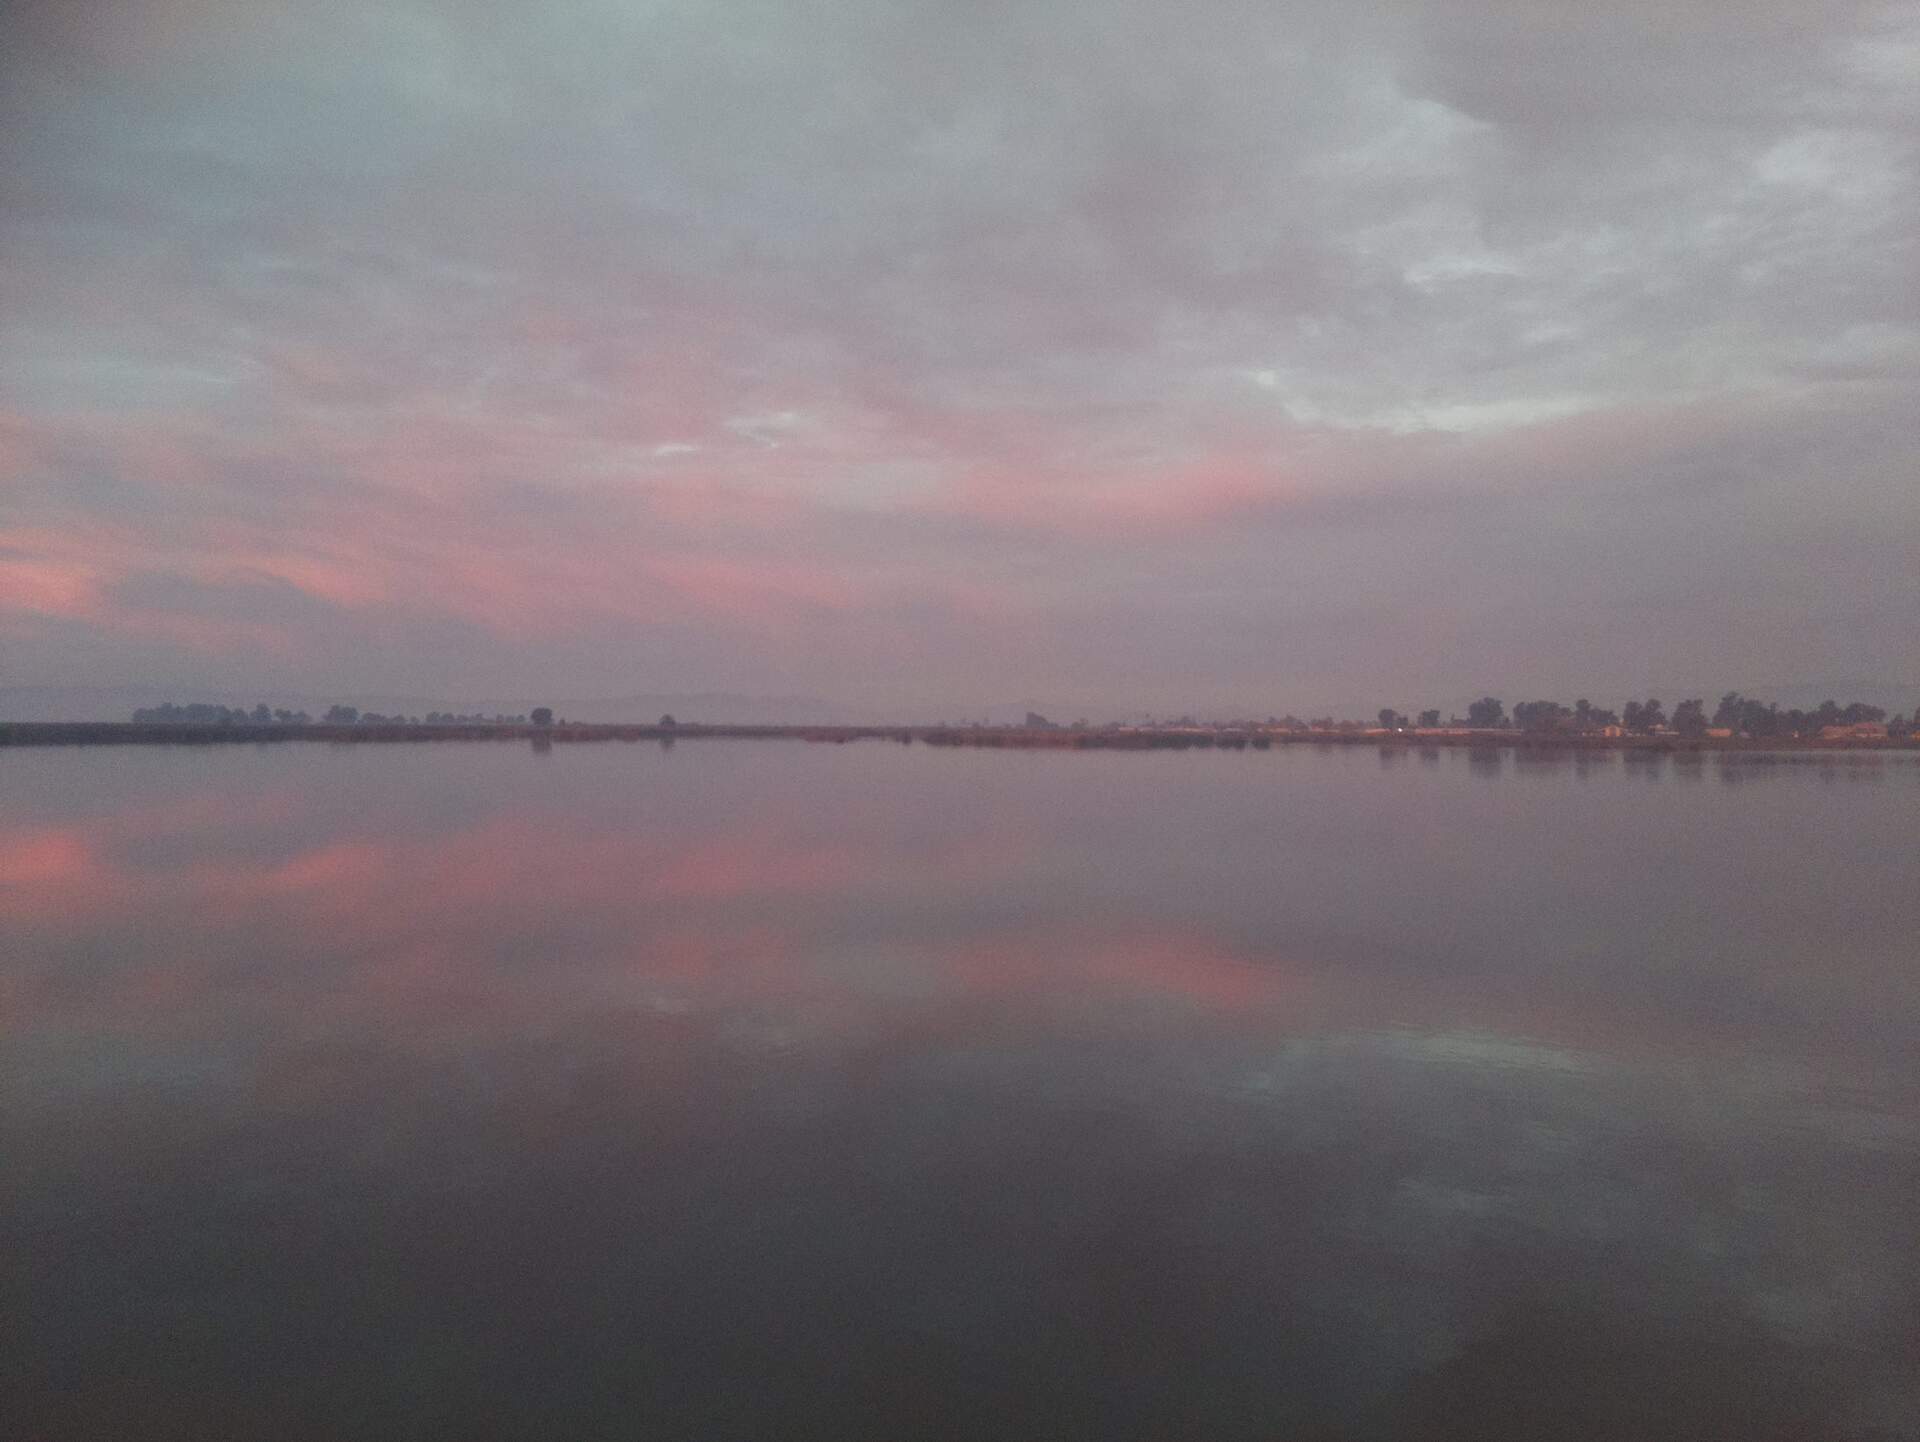
HS_picam_20241205_0715.jpg ( 2024-12-05 07:15:06 ) Full size: 1920x1442
Pink morning clouds reflected in the water
4 sets found
21 HS_met graphs found
4 HS_flux graphs found
1 HS_cam graphs found
Can't check HS_Processed
2 HS_Processed graphs found