
Field Notes
<--2024-01-11 11:35:00 | 2024-01-30 11:30:00-->Other sites visited today: Gilbert Tract | East End | Bouldin Corn | Bouldin Alfalfa | Hill Slough
Phenocam link: Searching...
Mayberry: 2024-01-18 12:25:00 (DOY 18)
Author: Daphne Szutu
Others: Arman
Summary: Water level still low, dfPAR data spotty--needs more work, PG&E working on power pole removal project
| 2024-01-18 Mayberry Arman and I arrived at 12:25 PST. It was cold, breezy, and overcast (less foggy than the morning). The main gate was open when we pulled up and there was a line of about a dozen trucks waiting to exit--one guy said they were all there to work on the PG&E power pole removal project. There was a mild mud pit underneath the Antioch bridge and the gate was tied closed. The water level is about the same and the staff gauge read 14cm. Kyle and I need to arrange a time to try installing the soil moisture sensors (as a proxy for porewater conductivity) before the water level starts going up. We did not try the porewater sipper today since the water level was the same and we didn't get any sample last time. We measured the surface water under the tower, where there was just enough water to get the whole probe in. Sample, temperature-compensated conductivity, temperature Surface, 5.96 mS, 11.2 degC I downloaded met, cam, and USB GHG data. The eddy clock was ok. Arman cleaned the flux and rad sensors, lowering and raising the eddy post for cleaning. Most of the diffuse PAR data was missing in the first week since the last visit, however the most recent week of data looked fine, so I left it as is for now. It's not a critical data stream and we still have 4 more sites to visit today. This met box could use a modern power strip with 8 plugs; the current strip has two different types of plugs and the two types are wired opposite from each other. The 7500 read: 441ppm CO2, 505mmol/m3 H2O, 11.9C, 101.1kPa, 102SS—103 after cleaning The 7700 read: 2.13ppm CH4, 56RSSI – 68 after cleaning We left at 12:55 PST. |
1 photos found
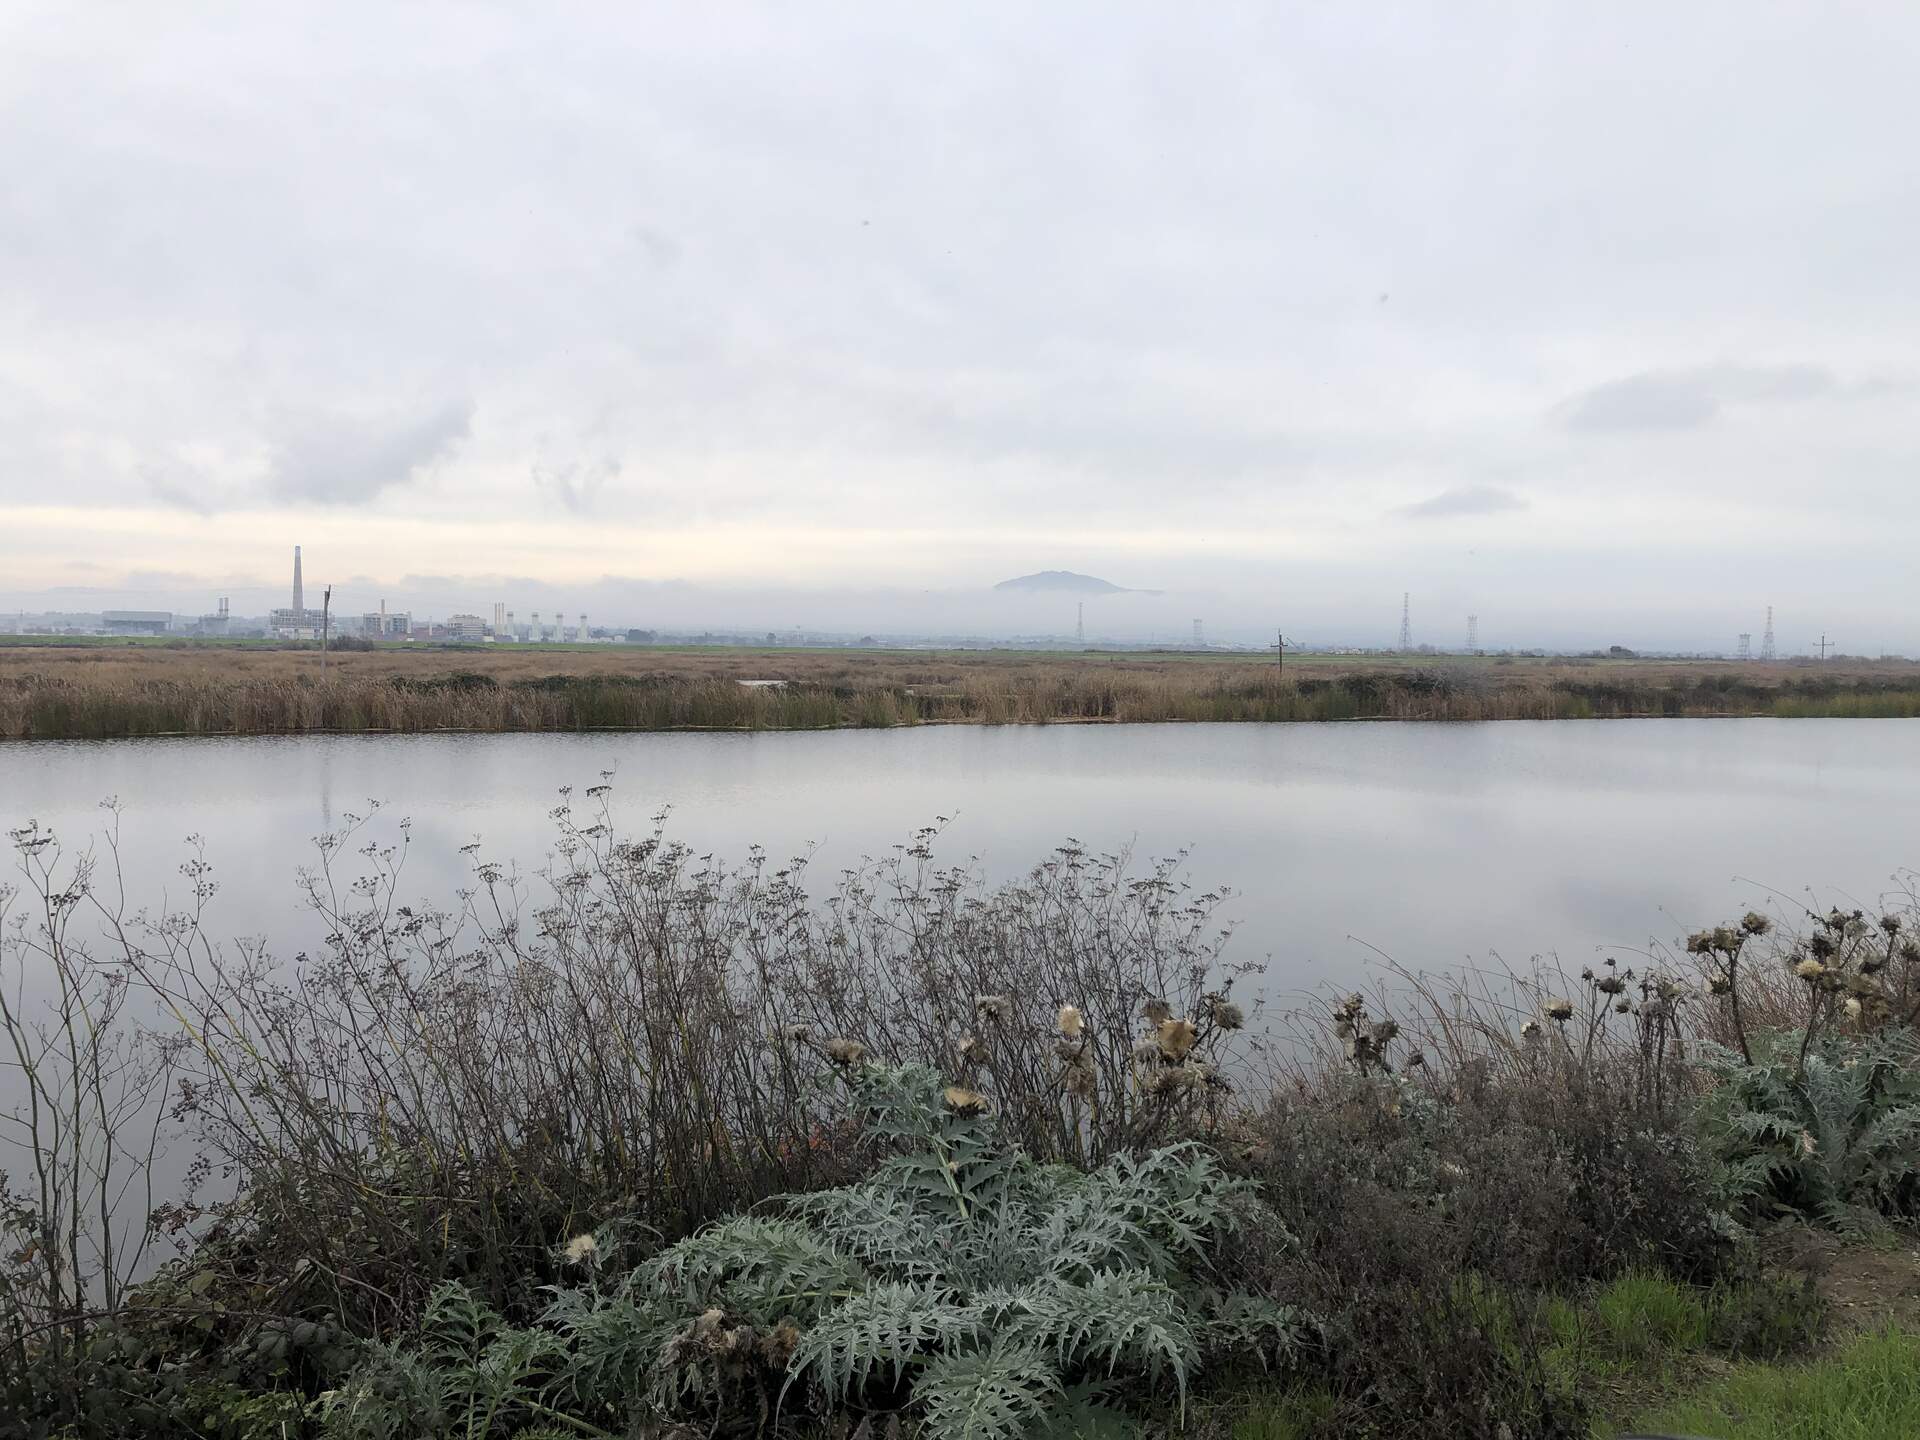
20240118MB_DiabloFog.jpg ( 2024-01-18 12:17:38 ) Full size: 1920x1440
Fog obscuring the bottom of Mt. Diablo
11 sets found
7 MB_flux graphs found
No data found for MB_met.
28 MB_tule graphs found
Can't check MBWPEESWGT_mixed
1 MB_cam graphs found
Can't check MBEEWPSWEPGT_cam
Can't check SIMBTWEE_met
1 MB_minidot graphs found
Can't check MBSWEEWPBCBA
1 MB_processed graphs found
Can't check MB_fd
1 MB_fd graphs found