Field Notes
<--2024-01-11 10:00:00 | 2024-01-30 10:00:00-->Other sites visited today: Mayberry | East End | Bouldin Corn | Bouldin Alfalfa | Hill Slough
Phenocam link: Searching...
Gilbert Tract: 2024-01-18 10:05:00 (DOY 18)
Author: Daphne Szutu
Others: Arman
Summary: Foggy, installed Song Meter Micro on tower, dfPAR not working--needs new prox sensor, installed miniDOT on ADCP mount
| 2024-01-18 Gilbert Tract Arman and I arrived at 10:05 PST. The whole area was socked in with fog as we crossed over the Diablo Range. At the site, it was chilly but relatively still and we could hear some hunting sounds nearby. It was near high tide and there was about 5cm of standing water under the tower. The staff gauge read 102cm at 10:25 PST (about 1 finger's width above the staff gauge). I checked the water conductivity off of the pier using the handheld YSI probe. Sample, Temperature-compensated conductivity, Temperature Surface, 950 uS, 8.7 degC We installed the Song Meter Micro sn SMM07514 with a ziptie on the north side of the tower. It’s powered by 3 lithium AA batteries and there’s a small desiccant pack inside. This is a wildlife recorder provided by one of Robert’s Google contact. It’s set to record audio for two hours around dawn and for two hours around dusk every day. I set the date and time yesterday via app. The location was set to UC Berkeley, but the sunrise and sunset times shouldn’t be too different at Gilbert Tract. The audio is stored on a microSD card which we’ll pull next time and send to Google for wildlife identification. I downloaded met, cam, and USB GHG data. I changed the eddy clock +2:30min from 10:16 to 10:18:30 to match the laptop time and restarted logging. Arman cleaned flux and rad sensors. It was hard to get the RSSI up because it was so foggy--too many water molecules blocking signal strength. He also refilled the 7700 wash reservoir from half full. The 7500 read: 503ppm CO2, 463mmol/m3 H2O, 8.1C, 101.9kPa, 101SS -- 101 after cleaning The 7700 read: 2.58ppm CH4, 20RSSI – 22 after cleaning Diffuse PAR only had intermittent data. The shadowband was spinning and all of the wiring was fine. I tried cycling the power but that didn't help. I used the terminal emulator from the CR1000 to confirm that the CR10X was responding on C5. I also downloaded data from the CR10x but it had the same sparse data as the CR1000. I had to associate the most recent dfPAR program with the CR10X to see the proper data column names. The CR10X clock was 19 minutes fast; I changed it from 10:49 to 10:30 PST (this shouldn't affect the data b/c the data is being recorded using the CR1000 clock). I called Joe and he figured that the proximity sensor was not working. Either the magnets on the band were too far from the sensor, or the switch inside the sensor itself was broken. I used the magnet from the level to test the proximity switch. There was no connectivity on the two switch wires, and there was no change in any of the "prox" real-time data on the CR10X, so it seemed like the switch itself was broken. Arman disconnected the power going to the dfPAR motor and I removed the small box w/ motor and shadowband from the tower to bring back to the lab. I secured the PAR sensor and power cable (not live) to the L-bracket. We went down to the channel to collect Flo's data at 11:15 PST. The tide is ebbing now and it was still very foggy. I set the ADCP clock, declined to calibrate its pressure, and downloaded the data. I restarted the data collection. We pulled the ADCP up out of the water to clean it and to install miniDOT sn 180871. We have been measuring the channel's dissolved oxygen with another miniDOT co-located with the USGS EXO, but its data has been bad since August. We are going to use this miniDOT instead to measure the channel's dissolved oxygen, and its data will be readily accessible since we can pull up the ADCP anytime and don't have to wait for low tide. I used two cable ties to attach the miniDOT to the back of the ADCP mount. I made sure the miniDOT was recording and put in a fresh desiccant pack. The real-time ADCP data looked reasonable. We left at 11:45 PST. |
6 photos found
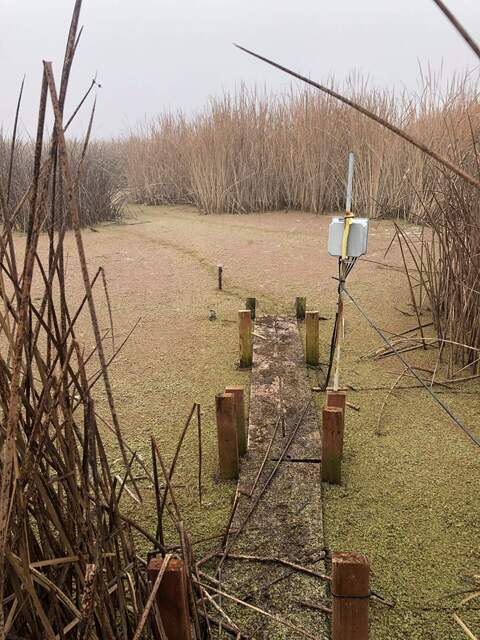
20240118GT_HighTide.jpg ( 2024-01-18 10:24:38 ) Full size: 1440x1920
High tide today is almost level with the pier
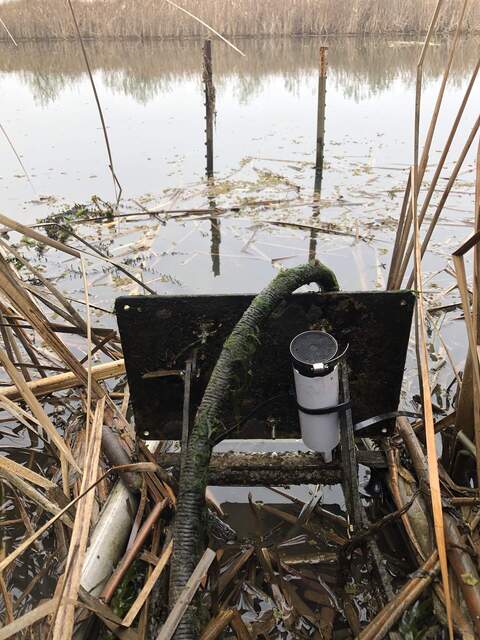
20240118GT_Minidot.jpg ( 2024-01-18 11:34:00 ) Full size: 1440x1920
Attaching the miniDOT on the back of the ADCP mount
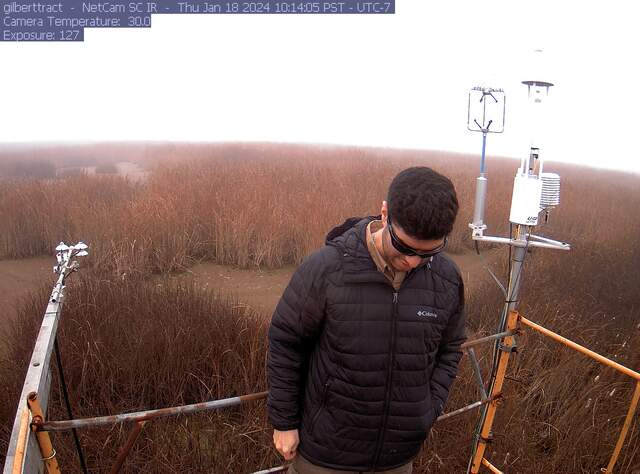
gilberttract_2024_01_18_101405.jpg ( 2024-01-18 18:19:44 ) Full size: 1296x960
Arman on site
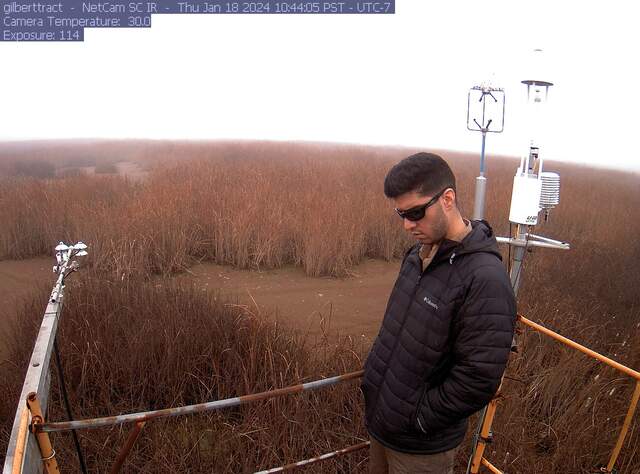
gilberttract_2024_01_18_104405.jpg ( 2024-01-18 18:49:42 ) Full size: 1296x960
Arman on site
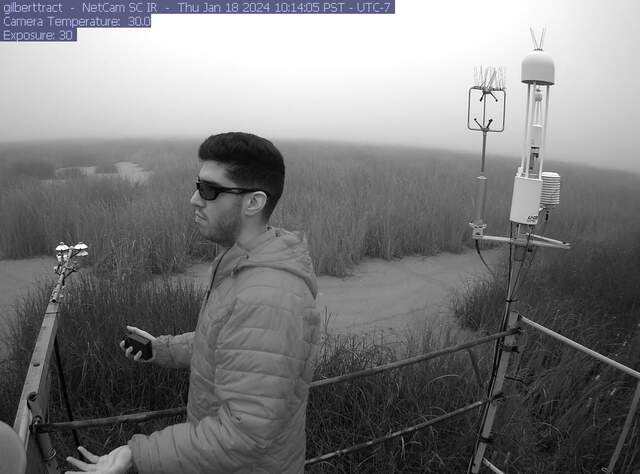
gilberttract_IR_2024_01_18_101405.jpg ( 2024-01-18 18:20:28 ) Full size: 1296x960
Arman on site in near IR
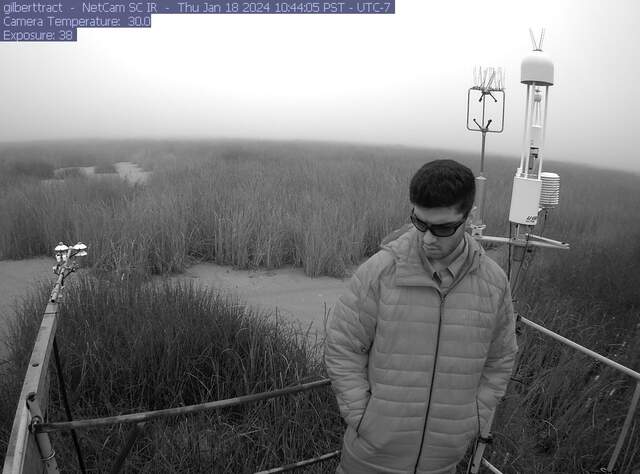
gilberttract_IR_2024_01_18_104405.jpg ( 2024-01-18 18:50:32 ) Full size: 1296x960
Arman on site in near IR
8 sets found
Can't check MBWPEESWGT_mixed
Can't check MBEEWPSWEPGT_cam
16 GT_met graphs found
4 GT_flux graphs found
3 GT_adcp graphs found
1 GT_cam graphs found
2 GT_usgs graphs found
No data found for GT_chanexo.

