Field Notes
<--2024-01-04 14:00:00 | 2024-01-18 12:25:00-->Other sites visited today: Gilbert Tract | West Pond | East End | Bouldin Corn | Hill Slough
Phenocam link: Searching...
Mayberry: 2024-01-11 11:35:00 (DOY 11)
Author: Daphne Szutu
Others: Joe
Summary: Calibrated 7700, dfPAR motor bad--swapped, removed water radiometers, not enough water for porewater conductivity
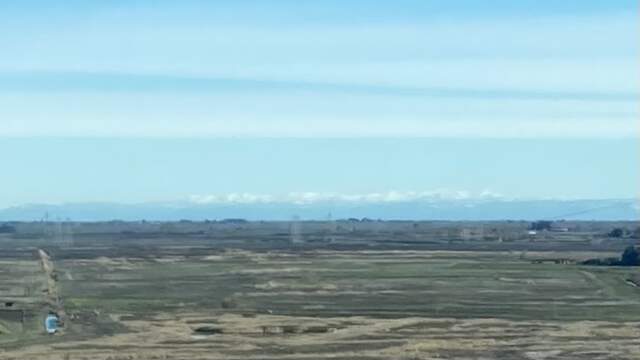
| 2024-01-11 Mayberry Joe and I arrived at 11:35 PST. This is an off-cycle visit to calibrate the 7700 and do some maintenance. It was a cool, breezy, sunny winter day. There are large mounds of mallow growing along the interior levee roads (Joe thinks they were previously outcompeted by the pepperweed. No pepperweed now!) We could see snow in the Sierras from the bridge. The water level is low and there’s barely any standing water under the tower. The staff gauge read 14cm. Joe bludgeoned off the 2 large barnacles on the staff gauge. We calibrated LI-7700 sn TG1-0211, which went smoothly despite the breeze. After the calibration, we returned the spiky hat and the wash sprayer to their proper locations. The optics RH was 3%, so we did not flush the headspace or swap drierite afterwards. I didn't download the data but checked that the real-time met data looked ok and the GHG logging status was ok. We removed the water radiometers and mounting hardware from the northeast corner of the tower. The area under those radiometers were filling in with cattails, so they’re not really measuring open water anymore. We removed NR-LITE sn 990351 and PAR sn 010161 and brought them back to the lab. Joe swapped the 2rpm motor for diffuse PAR. The real-time numbers looked ok afterwards. I checked on the wiring of TC18, Tul2_Ts2, which had some noise at the end of the last year. There were a lot of small flies clustered around this area of the AM25T. I cleared out the flies and re-did the wiring. The real-time temperature looked fine, and I’ll have to check on the time series next time I download data. We measured the surface water conductivity near the tower. I checked all of the sippers but they were mostly just sucking air. There were a few splats of mud from the blue sipper, but not enough to measure. Sample, temperature-compensated conductivity, temperature Surface, 6.35 mS, 9.2 degC The 7500 read: 434ppm CO2, 208mmol/m3 H2O, 13.4C, 101.5kPa, 102SS—102 after cleaning The 7700 read: 2.06ppm CH4, 62RSSI – 71 after cleaning We left at 12:45 PST. |
1 photos found

20240111MB_SnowySierras.jpg ( 2024-01-11 11:15:05 ) Full size: 685x385
Snow in the Sierras from the top of the Antioch Bridge
11 sets found
7 MB_flux graphs found
No data found for MB_met.
28 MB_tule graphs found
Can't check MBWPEESWGT_mixed
1 MB_cam graphs found
Can't check MBEEWPSWEPGT_cam
Can't check SIMBTWEE_met
1 MB_minidot graphs found
Can't check MBSWEEWPBCBA
1 MB_processed graphs found
Can't check MB_fd
1 MB_fd graphs found

