Field Notes
<--2024-01-11 14:50:00 | 2024-01-30 14:05:00-->Other sites visited today: Gilbert Tract | Mayberry | East End | Bouldin Alfalfa | Hill Slough
Phenocam link: Searching...
Bouldin Corn: 2024-01-18 14:45:00 (DOY 18)
Author: Daphne Szutu
Others: Arman
Summary: Water level has gone up slightly in the field, on-ramp to Hwy 12 is a muddy mess
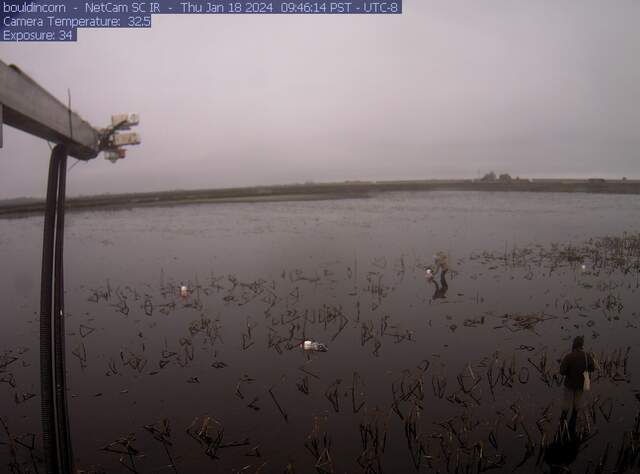
| 2024-01-18 Bouldin Corn Arman and I arrived at 14:45 PST. There was a brief slowdown on Hwy 12 on the western half of Bouldin Island because of lane line painting. It was cool, still, and overcast. The gate was locked again. The water level has come up a little and there is about 5cm of standing water under the tower. I downloaded met, cam, USB GHG, and PA data. The reservoir was 70% full. Arman refilled it and cleaned flux and rad sensors. The 7500 read: 455ppm CO2, 515mmol/m3 H2O, 13.4C, 101.8kPa, 99SS—100 after cleaning The 7700 read: 2.4ppm CH4, 45RSSI – 78 after cleaning We left at 15:00 PST. As Joe said in the previous field note, the on-ramp to Hwy 12-E is a muddy mess. We had a large truck but no 4WD today, so I sped through it all and skidded briefly at the end. "Slick as snot," as Dennis would say. We had to wait a while to actually merge onto the highway--the slowdown meant the vehicles were going more slowly and there were fewer gaps in the traffic. Another option is to go to alfalfa first next time, use the levee road to get back on Hwy 12 to access corn, and then leave Bouldin Island by merging onto westbound 12. That on-ramp on the north side of the highway seems to be in better shape. |
1 photos found

bouldincorn_2024_01_18_094506.jpg ( 2024-01-18 17:47:02 ) Full size: 1296x960
People checking on chambers
6 sets found
17 BC_met graphs found
5 BC_flux graphs found
Can't check TATWBABCSB_cam
Can't check MBSWEEWPBCBA
2 BC_pa graphs found
1 BC_arable graphs found

