Field Notes
<--2024-01-04 15:23:00 | 2024-01-18 10:05:00-->Other sites visited today: Mayberry | West Pond | East End | Bouldin Corn | Hill Slough
Phenocam link: Searching...
Gilbert Tract: 2024-01-11 10:00:00 (DOY 11)
Author: Daphne Szutu
Others: Joe
Summary: Calibrated 7700, miniDOT left on boardwalk--put back in water, moved water sensors deeper into water, measured surface water conductivity
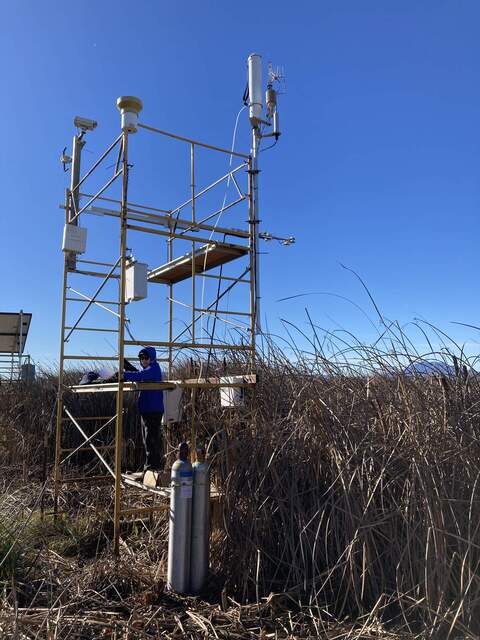
| 2024-01-11 Gilbert Tract Joe and I arrived at 10:00 PST. This is an off-cycle visit to calibrate the 7700 and do some maintenance. Katie and Molly were opening the main gate as we arrived to lead a field trip for the East Contra Costa County Habitat Conservancy, who did some of the restoration design work in the area. It was a sunny, chilly, and breezy winter day. It was near low tide when we arrived and the ground around the tower was still mucky--Joe suggested moving some of Vaira's surplus boardwalks here to help keep our feet dry. We calibrated LI-7700 sn TG1-0223, which went smoothly despite the breeze. After the calibration, we returned the spiky hat and the wash sprayer to their proper locations. The optics RH was 3%, so we did not flush the headspace or swap drierite afterwards. I didn't download the data but checked that the real-time met data looked ok and the GHG logging status was ok. The miniDOT was just laying on the boardwalk when we arrived, so the data since the last site visit is no good. We put it back in the water. The staff gauge read 51cm at 10:20 PST. Using the staff gauge reading as a reference, Joe moved the three water sensors down lower into the water column (Campbell conductivity sensor, eosGP dissolved CO2, and HYDROS21 CTD). The Campbell conductivity sensor and the eosGP were both 20cm below the water surface. The CTD was about 40cm below the water surface. All three sensors were lowered so they were about 45cm below the water surface and about 8cm above the ground (top of Joe's boot). We measured the conductivity with the handheld YSI probe. Sample, Temperature-compensated conductivity, Temperature Surface, 1168 uS/cm, 7.2 degC Joe then measured the uncompensated conductivity, 773 uS/cm. He realized he probably wrote down the uncompensated conductivity for the last two site visits at HS and MB. We'll have to manually correct that data before putting it in the database. The 7500 read: 432ppm CO2, 261mmol/m3 H2O, 10.1C, 102.2kPa, 100SS -- 101 after cleaning The 7700 read: 2.05ppm CH4, 68RSSI – 82 after cleaning We left around 11:00 PST. |
1 photos found

20240111GT_DaphneCalibrating.jpg ( 2024-01-11 10:40:12 ) Full size: 1440x1920
Daphne calibrating the 7700 CH4 analyzer.
8 sets found
Can't check MBWPEESWGT_mixed
Can't check MBEEWPSWEPGT_cam
16 GT_met graphs found
4 GT_flux graphs found
3 GT_adcp graphs found
1 GT_cam graphs found
2 GT_usgs graphs found
No data found for GT_chanexo.

