
Field Notes
<--2023-08-15 09:25:00 | 2023-09-12 17:40:00-->Other sites visited today: Bouldin Alfalfa | Bouldin Corn
Phenocam link: Searching...
Hill Slough: 2023-08-24 15:00:00 (DOY 236)
Author: Joe Verfaillie
Others: Daphne, Jiangong
Summary: Testing LI-7810 chamber system, Reinstalled EXO sonde, standard data collection
| Hill Slough 2023-08-24 Daphne, Jiangong and I arrived at about 15:00 PDT. It was hot and sunny but the usual wind kept it comfortable. It was near low tide, the staff gauge read 4.26ft at 14:27 PST. We are testing our new Licor LI-7810 (CO2/CH4/H2O) analyzer and LI-8100 Smart Chamber. We found a spot along the south side of the boardwalk where there were only a few centimeters of water next to some young cattails. We put the ladder down to the mud, set down the collar and put the chamber on top. Jiangong did five reps with his phone. Both CO2 and CH4 flux nearly tripled over the five measurements. CH4 was really high 100-300nmol/m2/s. We reinstalled the EXO that was removed for routine cleaning and calibration last week. The following parts were installed: sn 22C103416 EXO2 sn 22E106072 Turbidity sn 22E100649 fDOM sn 23D104030 Conductivity/Temperature sn 22D102641 pH/ORP At the Tower Daphne did the standard data collection of flux, met and camera data. The 7500 read: 409ppm CO2, 773mmol/m3 H2O, 27.4C, 101.2kPa, 100SS – 101 after cleaning The 7700 read: 1.98ppm CO2, 54RSSI – 80 after cleaning The wash reservoir was full, and radiometers were clean. We left at 15:40 PDT. |
2 photos found
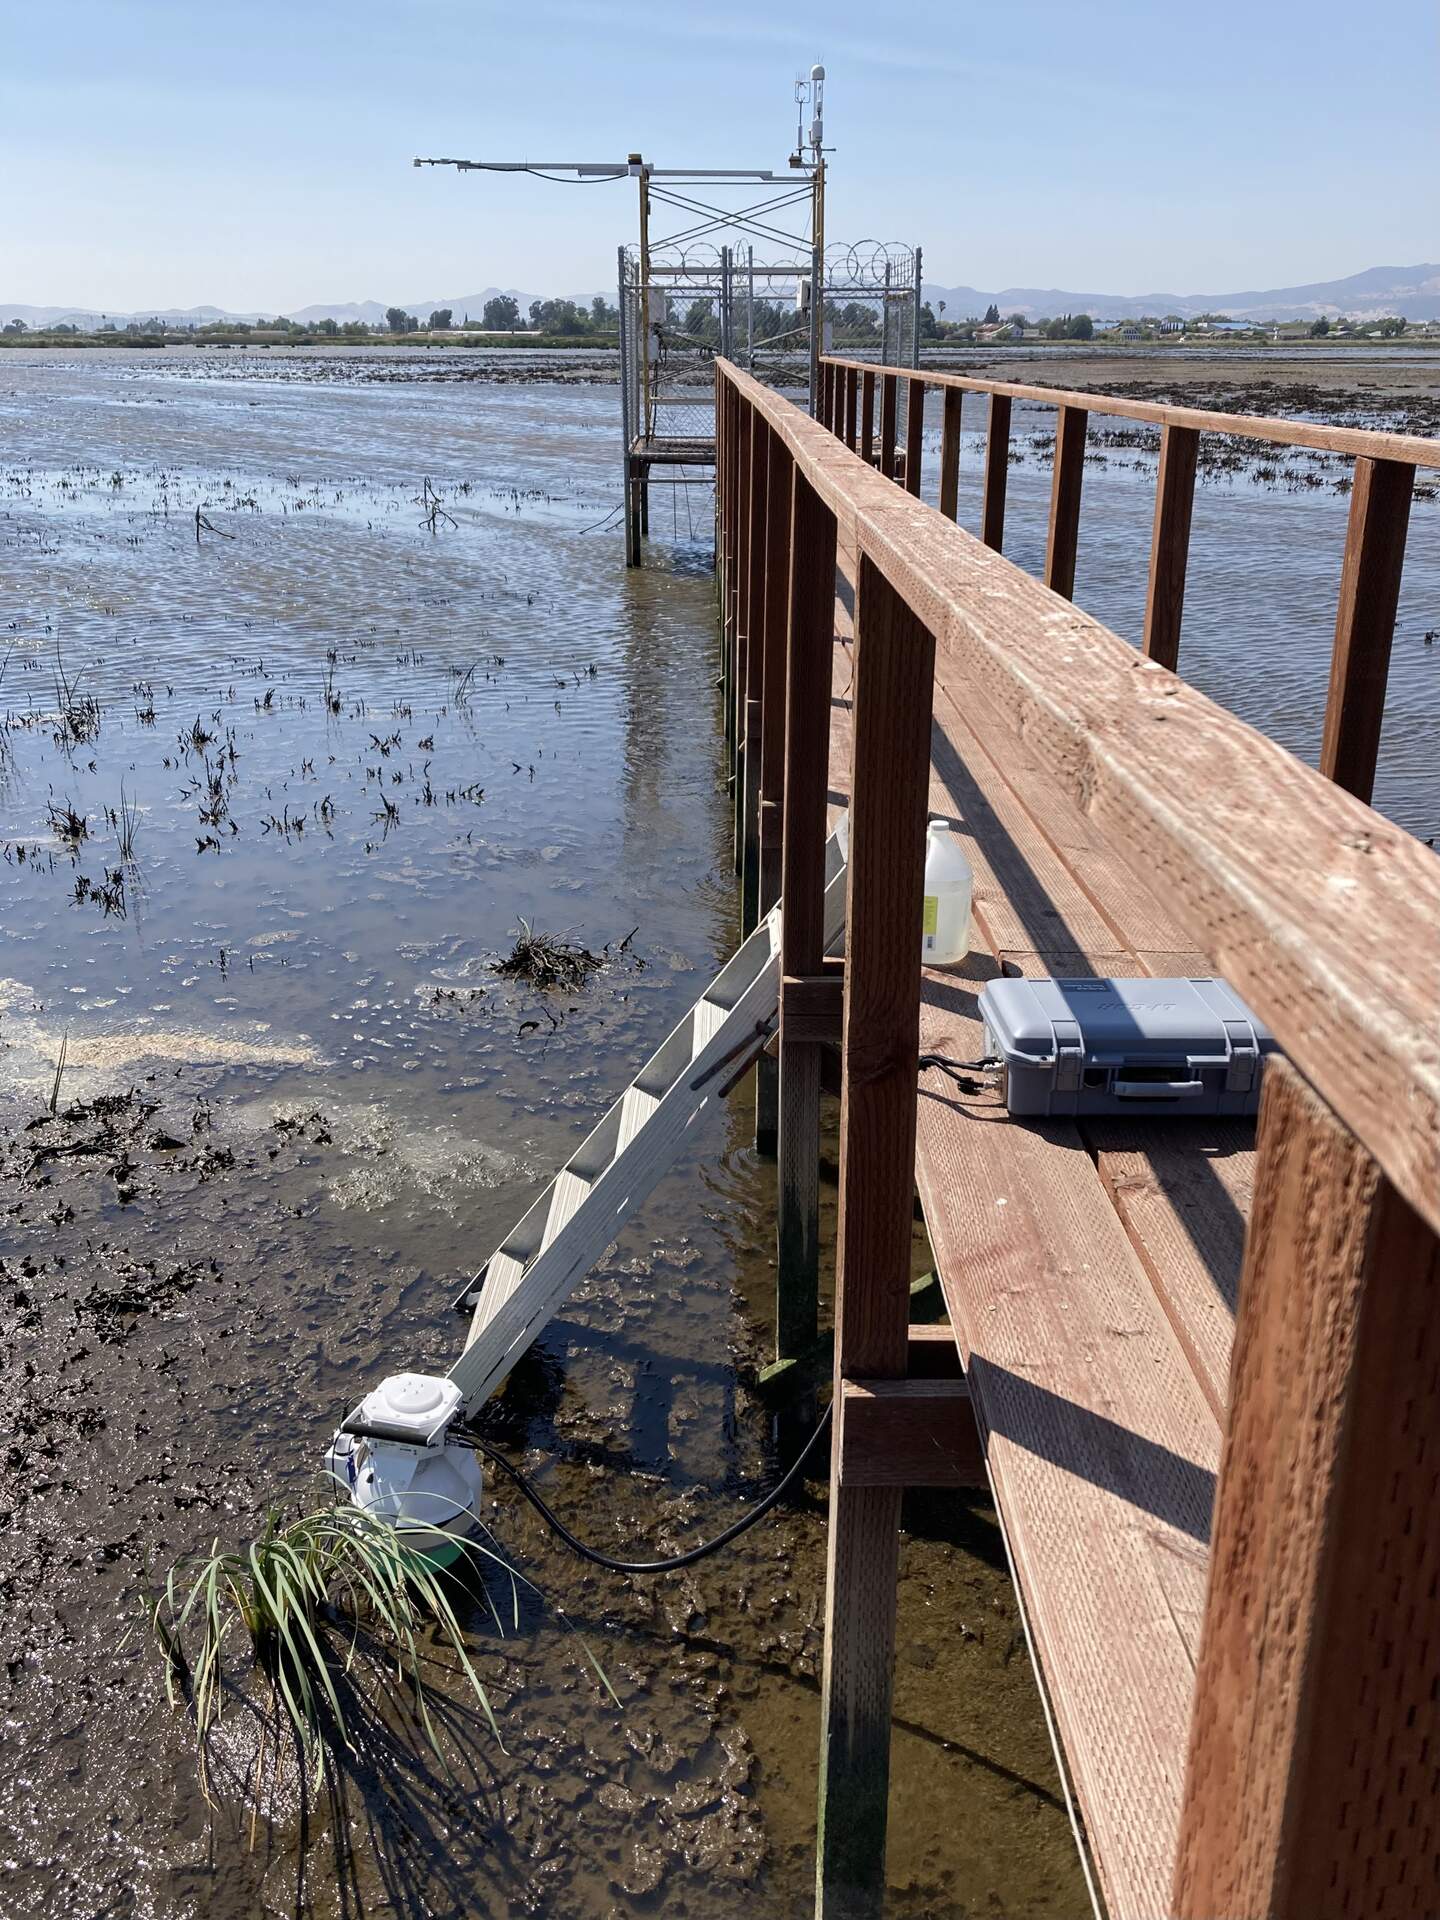
20230824HS_LicorChamberTest.jpg ( 2023-08-24 15:00:15 ) Full size: 1440x1920
Testing the Licor flux chamber

20230824HS_JoeDaphne.jpg ( 2023-08-24 00:00:00 ) Full size: 1920x1440
Joe and Daphne
4 sets found
21 HS_met graphs found
4 HS_flux graphs found
1 HS_cam graphs found
Can't check HS_Processed
2 HS_Processed graphs found