
Field Notes
<--2023-07-24 09:40:00 | 2023-08-24 15:00:00-->Other sites visited today: Vaira | Tonzi
Phenocam link: Searching...
Hill Slough: 2023-08-15 09:25:00 (DOY 227)
Author: Daphne Szutu
Others: Joe
Summary: Cattails coming in on north/east edge of wetland, Changed staff gauge orientation, pulled EXO for calibration
| 2023-08-15 Hill Slough Joe and I arrived at 9:25 PDT as a stop on the way to Tonzi/Vaira today. It’s been three weeks since the last visit. Today we are going to pull the EXO for calibration and deploy it again next week when we have the routine Delta visits. It was windy and partly cloudy. The car thermometer said it was 26C (80F), but it felt mild because of the cool breeze. There have been scattered showers in the region earlier this week because of tropical moisture remnants. It was near low tide and the staff gauge read 3.68ft at 8:55 PST. Vegetation is starting to fill in! There were a lot of cattails coming in on the north edge of the wetland, north of the tower. There are also some emergent cattails and tule around the boardwalk and solar enclosure. Looks like mostly cattail to the south of the boardwalk and tule to the north of the boardwalk. Joe got started with changing the orientation of our secondary staff gauge in the channel so it is easier to read from the boardwalk. Even though it was low tide, he was still thigh-deep in mud and got water in his waders (Lots of bubbles released in the mud). He used the shovel to knock off barnacles from the post. I downloaded met, cam, and USB GHG data and cleaned flux and rad sensors. I changed the eddy clock +45sec from 8:38 to 8:38:45 to match the laptop time and restarted logging. The reservoir was ½ full; I refilled it. The 7500 read: 411ppm CO2, 826mmol/m3 H2O, 24.9C, 101.6kPa, 99SS – 101 after cleaning The 7700 read: 2.13ppm CH4, 54RSSI – 79 after cleaning I took a porewater sample from the sipper under the tower. I forgot a vial so I stored the sample in the syringe for about 10min before measuring the sample back at the car. Sample, Temperature-compensated conductivity, Sample temperature, Time Porewater, 9.30mS, 25.3C, 8:50 PST Back at the channel, we removed the EXO for calibration. Sensors removed: sn 22C103416 EXO2 sn 22E106072 Turbidity sn 22E100649 fDOM sn 23D104030 Conductivity/Temperature sn 22D102641 pH/ORP I downloaded the miniDOT data and swapped the miniDOT pantyhose and desiccant. The old pantyhose had a few holes. The new pantyhose is a little short, so let’s see how well it stays on with the cable tie. We left at 10:10 PST. |
2 photos found

20230815HS_CattailPatch.jpg ( 2023-08-15 10:13:50 ) Full size: 1920x1440
A large patch of cattails at the northern end of tidal area
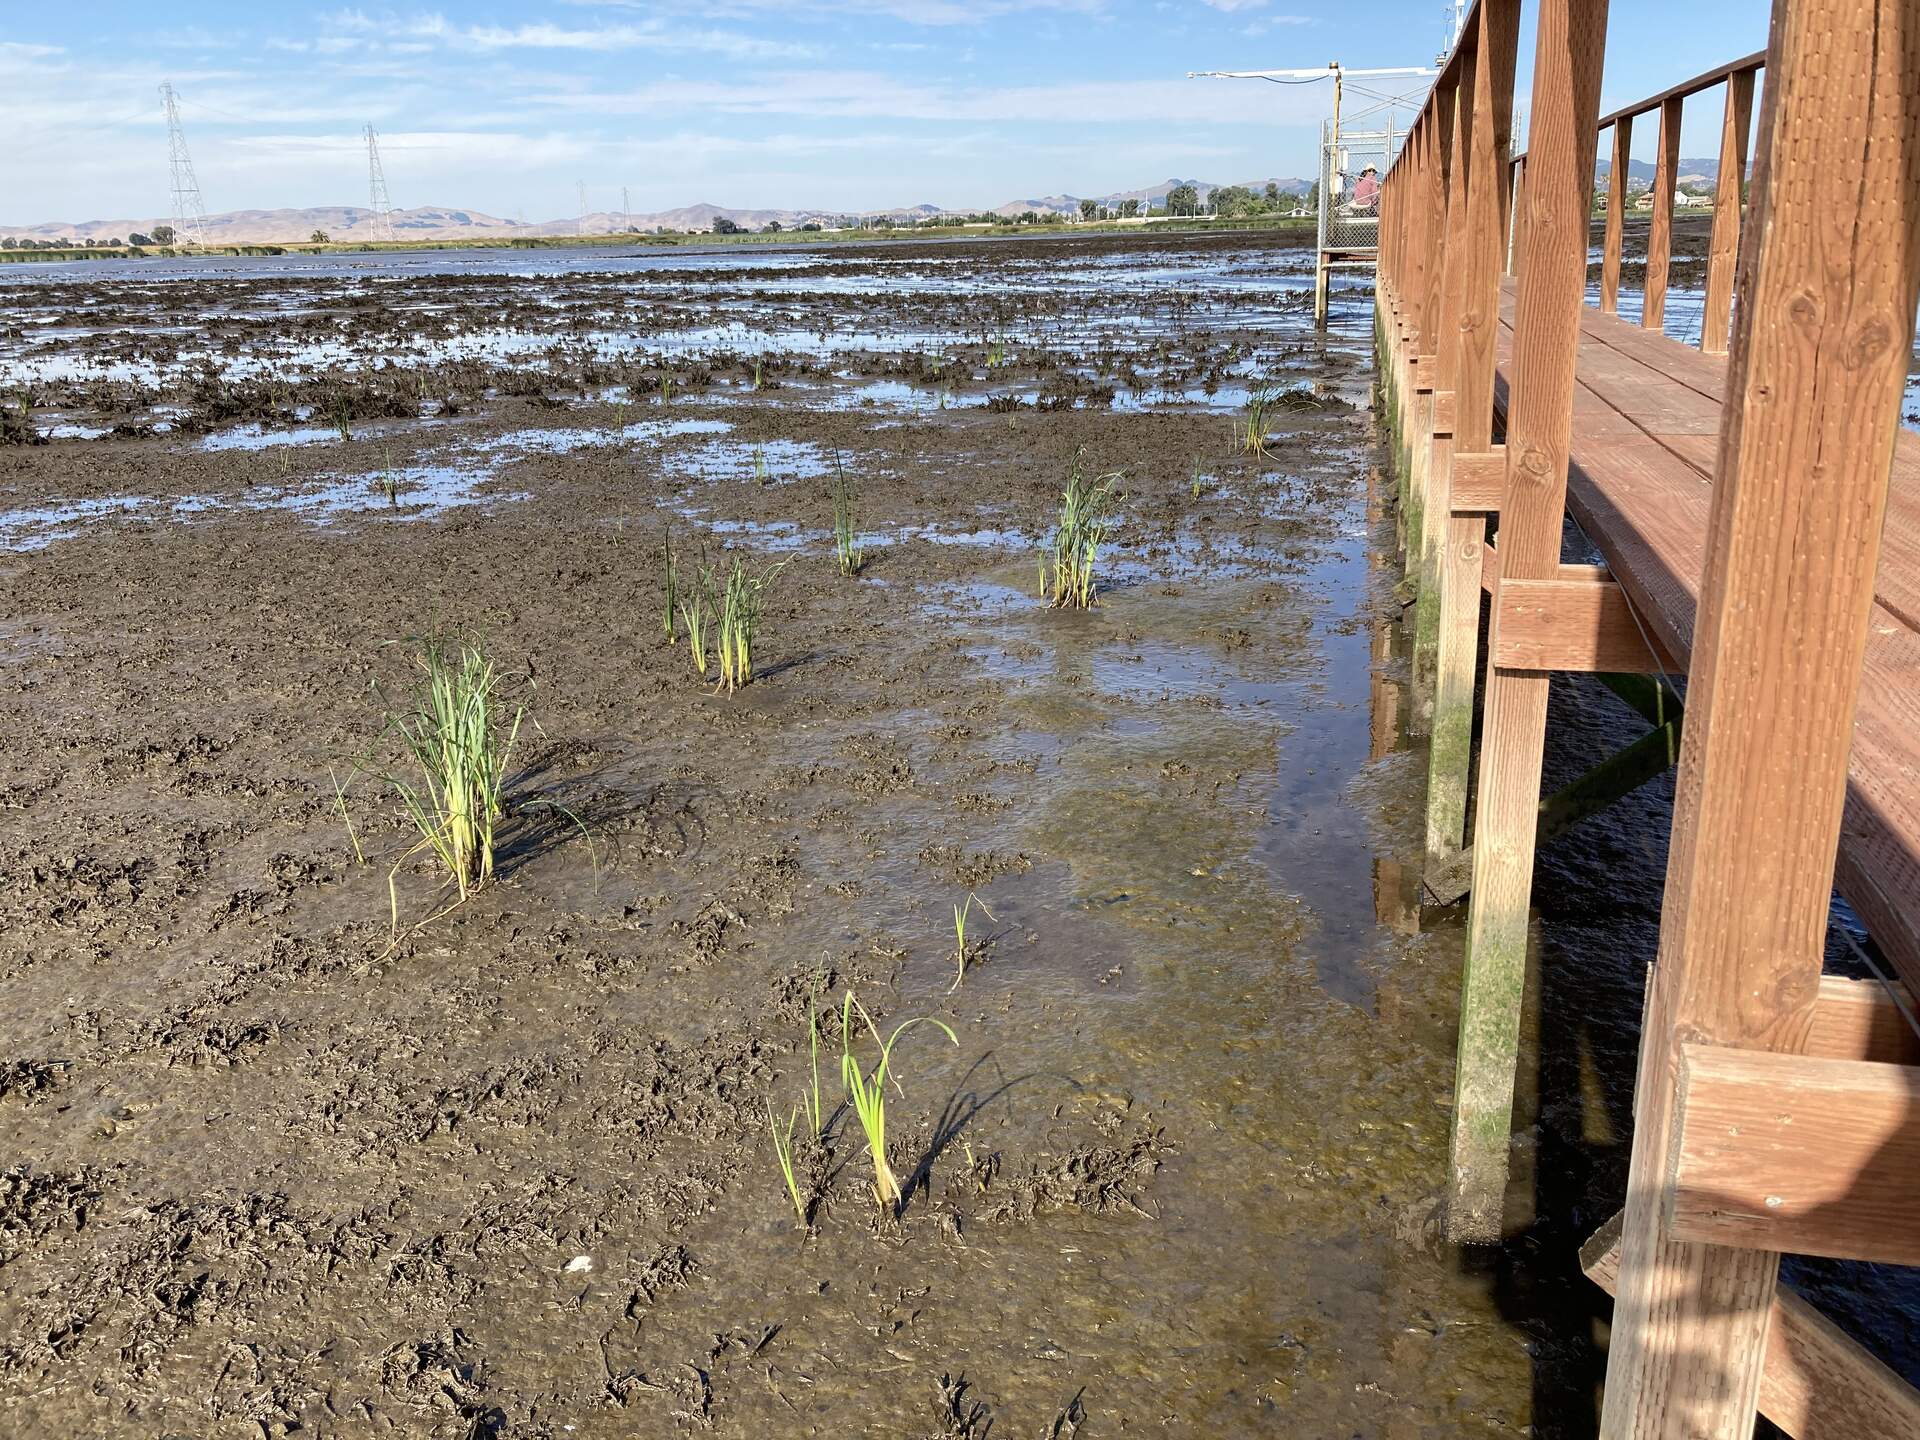
20230815HS_CattailsSprouting.jpg ( 2023-08-15 09:25:13 ) Full size: 1920x1440
A sprinkling of cattails and tules are coming up on either side of the boardwalk
4 sets found
21 HS_met graphs found
4 HS_flux graphs found
1 HS_cam graphs found
Can't check HS_Processed
2 HS_Processed graphs found