
Field Notes
<--2022-06-07 12:00:00 | 2022-08-05 11:10:00-->Other sites visited today: Vaira
Phenocam link: Searching...
Tonzi: 2022-07-19 10:45:00 (DOY 200)
Author: Daphne Szutu
Others: Dennis, Kanishka
Summary: First visit in 6 weeks, hot day, regular data collection/cleaning using sneakernet, early morning power outages in last few weeks, removed LattePanda/Global Water Logger/Open FD chamber for troubleshooting, LAI2200 measurements
| 2022-07-19 Tonzi Dennis, Kanishka, and I arrived at 10:45 PDT. This is the first site visit in 6 weeks. Joe is in Japan and my previous trip was canceled because of COVID quarantine. When we arrived, the car claimed it was still 28C (83F) but it was definitely warmer and getting hotter. The forecasted high today was 39C (102F). Standing in the shade felt ok. The grass was brown and crispy, but the trees still looked good at me. I don’t remember what they look like in past years. Dennis observed that the trees were still green at the tips, while last year there were a lot of dead twigs. We didn't see any cows today and left all of the electric fences off. Dennis and Kanishka got started with measuring the well water levels and manual soil moisture probes. I got started with data, starting from the LattePanda. It’s been getting hung up occasionally and needing a hard restart. When I arrived, the screen was black even after poking at the keyboard, mouse, and screen. I cycled its power but the screen remained black. The red LED on the back was solid on and the network cable LEDs showed activity. I texted Joe for help (it was 3am in Japan—thanks, Joe!). He tried to Remote Desktop in, but didn’t get any response. I disconnected the LattePanda and brought it back to the lab. I downloaded data from the individual dataloggers. There were some power outages in the early morning, starting 6/23 for the tower data and 7/12 for the floor data. Probably the battery banks need to attention. Kanishka and I walked up the tower together. The radiometers looked ok so I did not clean them or the 7500. Tower met CR1000 – ok Tower GHG – ok. I changed the eddy clock +1min from 13:10:10 to 13:11:10 to match the laptop time and restarted USB logging. The 7500 read: 385ppm CO2, 445mmol/m3 H2O, 35.0C, 98.9kPa, 94SS (did not clean) Tower phenocam – ok. The clock had reset back to 1999. When the clock read 2000-01-08 23:49:30, I changed it to 2022-07-19 13:04:00 to match the laptop time. Tower CO2prof CR6 – ok Floor met CR23X – ok, but accidentally only collected one table. The second table had soil moisture data that hopefully can wait until next time. Floor GHG – ok. Changed eddy clock +1:10 min from 11:18:10 to 11:19:20 to match the laptop time and restarted USB logging. The 7500 read: 411ppm CO2, 198mmol/m3 H2O, 35.9C, 99.1kPa, 97SS --> 101 after cleaning Floor well CR200 – ok Soil CO2 CR23x - ok OSU SP1 CR3000 – ok, but no data in the soilvue table. I consulted with Joe via text again and compared programs with VR met. I updated the CR3000 program so that the CallTable instruction was outside of the if loop. This fixed the issue. I downloaded data again at the end of the day and there were 2 lines in the soilvue data table. OSU SP2 CR1000– ok OSU SP3 CR1000- ok IRT CR1000 – ok. The lower IRT pointing at the grass was still pointing downwards, but the white plastic casing had fallen onto the ground and was almost directly under the IRT sensor. I put the casing back on but it could use some more work next time. One of the plastic set screws was busted. To connect, I had to change the Pakbus address from 1 because of some addressing conflict. I changed it to the Setup-recommended 49. I changed the Pakbus address back to 1 after downloading data. I set up the LAI2200 with Dennis so he could walk around and take some LAI transects. We set up the above wand on a tripod in an open area by the road, directly east of the tower and set it to autolog every 5 seconds. Both wands had their clocks synched to the console clock (it was around 11:00 PST when we set it up). Both wands had a 45deg view cap (the sensor is seeing a 45deg slice is open to the sky). The above wand pointed to the NW (parallel with the road) and the below wand was pointed in the same direction during logging. We took a 4A scattering sequence with the below wand before Dennis took off to measure LAI by the zcams, 2 transects in the footprint to the west, and 2 transects north of the tower to capture the wintertime footprint. Dennis suggested taking LAI2200 measurements a few times a year with canopy changes so we can start to compare the zcam and LAI2200 data. I also serviced the zcams and downloaded the FD chambers. FD chamber sn FD20190027 (in the sun by the soilCO2 CR23X) was reading mostly zeros (with large positive and negative spikes) in the last few weeks, so I removed it to bring it back to the lab. The stakes and reflective cover are still on site. I tried to disconnect the power, but I could not untwist it easily and it was getting hot so I left it as is. Dennis and I read the regular (Vernier) dendrometers. Dennis was also interested in the trees with the Battles’ lab dendrometers. He took the measuring tape (1mm resolution) and measured increments (distance between between notch and sliders), but would like us to measure again with a digital caliper for more precision. In the future, we can plan to measure the Battles’ lab dendrometers annually. I removed the Global Water logger and battery pack to download data in the lab. Datamule no longer has the required FTDI drivers for the USB cable. I’ll try to connect it using the white laptop + external screen in the lab. We didn’t do midday water potential today. I meant to bring a new gas tank for the measurements but forgot when I was making the car reservation, so our intermediate rental car was too small to fit 3 people + a full-sized gas tank. We left at 15:00 PDT. |
Field Data
No tank data
No TZ Well data found
No TZ Moisture Point data found
No VR Moisture Point data found
No TZ grass heigth found
No VR grass heigth found
No TZ Tree DBH found
No water potential data found
No TZ Grass Biomass data found
No TZ OakLeaves Biomass data found
No TZ PineNeedles Biomass data found
3 photos found

20220719TZ_Trees.jpg ( 2022-07-19 16:31:54 ) Full size: 841x631
Mix of pine and oak trees
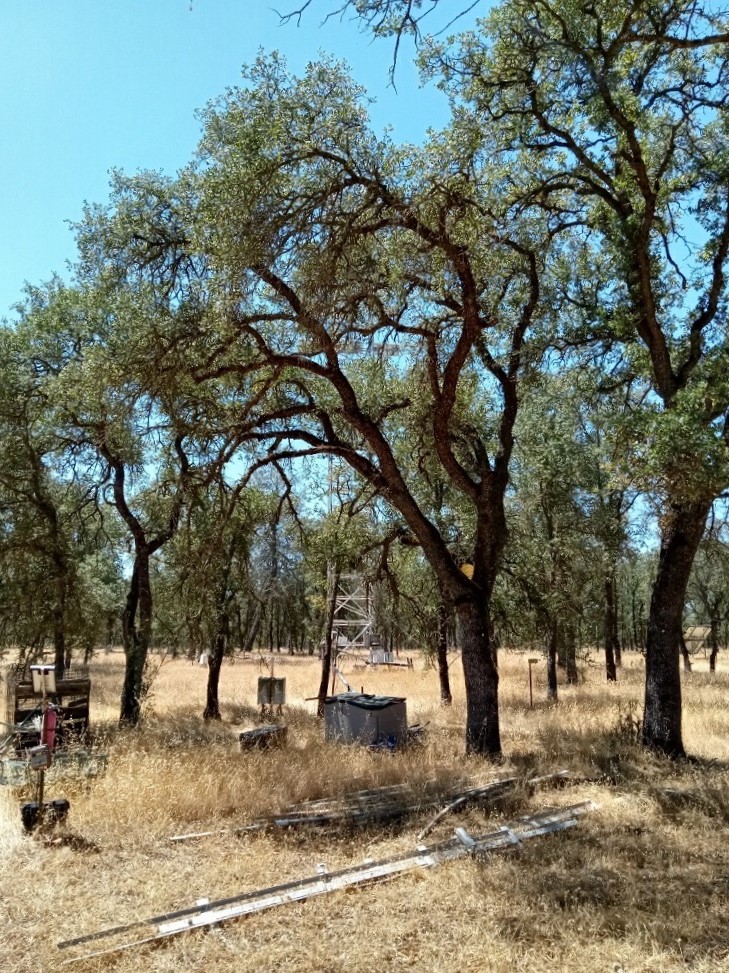
20220719TZ_Trees2.jpg ( 2022-07-19 16:32:03 ) Full size: 729x973
Larger oak trees inside the tower enclosure
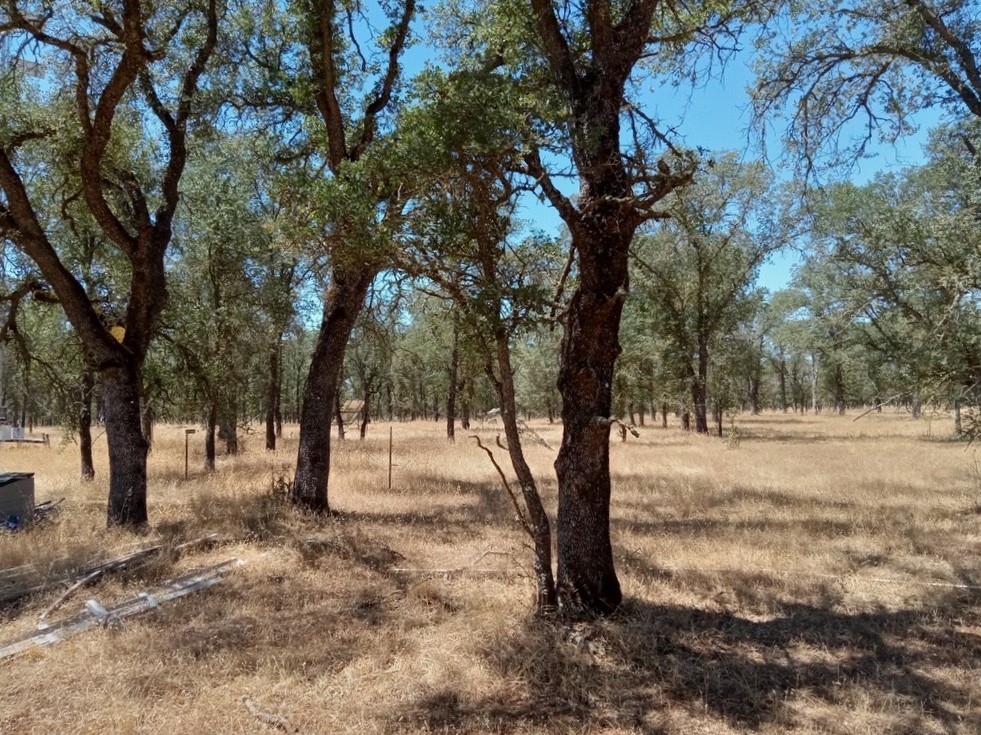
20220719TZ_Trees3.jpg ( 2022-07-19 16:32:04 ) Full size: 981x735
Mix of pine and oak trees
16 sets found
No data found for TZ_Fenergy.
11 TZ_tmet graphs found
11 TZ_soilco2 graphs found
Can't check TZ_mixed
3 TZ_mixed graphs found
1 TZ_fflux graphs found
8 TZ_fmet graphs found
No data found for TZ_tram.
3 TZ_co2prof graphs found
1 TZ_irt graphs found
No data found for TZ_windprof.
1 TZ_tflux graphs found
2 TZ_sm graphs found
Can't check TZ_met
1 TZ_met graphs found
Can't check TZVR_mixed
8 TZ_osu graphs found
3 TZ_fd graphs found
Tonzi Z-cam data