
Field Notes
<--2022-07-19 10:45:00 | 2022-08-18 13:30:00-->Other sites visited today: Vaira
Phenocam link: Searching...
Tonzi: 2022-08-05 11:10:00 (DOY 217)
Author: Joe Verfaillie
Others:
Summary: Maybe a little recent rain, power problems! - mostly fixed for the moment, midday water potential, missing z-cam 3 images, tree 1 dbh broken, reinstalled LattePand and Global Water logger
| Tonzi 2022-08-05 I arrive at about 11:10 PDT. It was partly overcast clearing to mostly sunny with some patchy high thin clouds. There has been a bit of rain – only enough to pock mark the dust on the road and make it humid. One tree where a branch of the pond reaches the road was full or acorns but I saw almost no acorns on any of the other trees. I didn’t see any cows but there were fresh seeming droppings. Also notice several piles of deer (I think) droppings. The Tower and Floor have been losing power in the early morning. When I got there the Tower had no power at all – the solar charge controller was off. I disconnected all the batteries sn BB-TT and they all individually read 6 to 10V. I decided to go check the Floor system before figuring out what to do about the Tower. At the Floor the system was running. I shut it down and disconnected the batteries sn BB-TF. They all tested good with the load tester, but they were all way low on water. These batteries have the screw on fill caps and they were all tight – not sure where all the water goes. I put about three gallons of DI in the four batteries. In reconnecting the batteries I accidently welded a lead between the two southern most batteries. The lead actually stuck to the threaded post before I yanked it loose. I tested those two batteries again and they seemed okay – fingers crossed. After getting it all wired up and turned back on the system was only getting about 4A at 24V. The panels should have been able to supply almost 12A. I noticed that woodpeckers had abraded three wires on the top solar panel. When I opened the terminal box a pile of acorns fell out. I cut the ends off the abraded wires, reran them through a hole on the lower side of the box and taped up the more accessible hole on the upper side of the box. Afterwards the batteries were still only getting about 4A from the panels but they were also at about 26V so the solar controller might have been throttling the charge. The load was only 0.5A. While working on the Floor I had the epiphany that I could use the batteries from the mostly defunct soil co2 system to run the Tower. I took the soil co2 battery bank sn BB-TZ_soilco2 apart. These batteries are relatively new (Sept 2019) and their water levels were just a little low – took less than a gallon to top all four up. I moved four of the old tower batteries off to the side and wired these up. The tower was running again and with the LattePanda reinstalled it was pulling about 2A at 24V. The four batteries should give us about 200Ahr at 24V. A 50% draw down (2A * 24hr) is about 100Ah. So one day without sun is okay. There are lots of panels too so recharge should be fast. I think part of what killed the old batteries is that the Low Voltage Disconnect (LVD) was not working. One bad thing about the Midnite Kid controllers is that the LVD (they call it Low Battery Disconnect (LBD)!) is not enable by default and is buried in their menu tree. After downloading the manual on my phone I found the setting and enabled it. I have not looked at the data closely yet but oddly there seems to be about the right number of files and the StarDot had not reset its clock, so I have some hope that we didn’t lose a huge amount of data. At soil co2, the FD chamber, a tipping bucket and two soil heat flux plates will not be collected. In the middle of all this battery swapping and maintenance I did midday water potential. I brought a new large air tank. Water potential was about -45bar. I did Moisture Point measurements. Some of the probes that don’t have broken pins but still give bad numbers might just be loose in the ground. Maybe pulling them and reinstalling them when the ground is wet will solve the problem. I read the dendrometers and measured the wells. The dendrometer on Tree 1 is broken. Looks like the tree has grown so much since it was attached that it broke the metal hinge holding it to the tree. At the Tower I reinstalled the LattePanda that Daphne could not get to boot last time. There are two tiny power and reset switches on the side of the circuit board that I pushed in the lab and got it to boot. Here it booted up and collected all the data it had missed. It even got the new soilvue table from OSU-SP1 but put it in the wrong directory. I fixed that file path. I cleaned both IRGAs and the radiometers – dried spotty rain. The Tower read: 369./ppm CO2, 1046.8mmol/m3 H2O, 28.2C, 98.8kPa, 85.9SS TT After cleaning: 398.5ppm CO2, 825.8mmol/m3 H2O, 27.9C, 98.8kPa, 96.2SS The Floor read: 413.7ppm CO2, 636.8mmol/m3 H2O, 32.1C, 98.9kPa, 101.9SS after cleaning I serviced the z-cams – dried spotty rain on the windows. The z-cam 3 card had the previous batch of photos on it. I’m not sure how that happened – I’m pretty sure I swapped that card and tested the camera. The lower IRT was pushed to the east and its solar shroud was hanging a little low because the plastic set screws have all rotted in the sun. I fixed it as best I could and pushed it back to the south. I reinstalled the Global Water logger at the Road well. The reinstalled serial driver on the laptop works! There is a driver on the laptop that works but you have to reboot the laptop in troubleshooting advance start up mode and disable driver signing to get Windows to let you install it. I left at about 16:50 PDT |
Field Data
No tank data
Well Depth
| Date | Location | Depth (feet) |
|---|---|---|
| 2022-08-05 | VR_well | 57.85 |
| 2022-08-05 | TZ_floor | 28.5 |
| 2022-08-05 | TZ_road | 37.25 |
| 2022-08-05 | TZ_tower | 35 |
mode = both
Moisture Point Probes TZ
Array
(
[0] => Tower_1
[1] => Soil_Transect_3_1
[2] => Soil_Transect_2_1
[3] => Soil_Transect_1_1
[4] => SoilCO2_West_A_1
[5] => SoilCO2_West_C_1
[6] => Tower_2
[7] => Soil_Transect_3_2
[8] => Soil_Transect_2_2
[9] => Soil_Transect_1_2
[10] => SoilCO2_West_A_2
[11] => SoilCO2_West_C_2
[12] => Tower_3
[13] => Soil_Transect_4_3
[14] => Soil_Transect_3_3
[15] => Soil_Transect_2_3
[16] => Soil_Transect_1_3
[17] => SoilCO2_West_A_3
[18] => SoilCO2_West_C_3
[19] => Tower_4
[20] => Soil_Transect_4_4
[21] => Soil_Transect_3_4
[22] => Soil_Transect_2_4
[23] => Soil_Transect_1_4
[24] => SoilCO2_West_C_4
[25] => SoilCO2_West_A_4
)
| Date | DOY | Rep | Depth | Tower_1 |
Soil_Transect_3_1 |
Soil_Transect_2_1 |
Soil_Transect_1_1 |
SoilCO2_West_A_1 |
SoilCO2_West_C_1 |
Tower_2 |
Soil_Transect_3_2 |
Soil_Transect_2_2 |
Soil_Transect_1_2 |
SoilCO2_West_A_2 |
SoilCO2_West_C_2 |
Tower_3 |
Soil_Transect_4_3 |
Soil_Transect_3_3 |
Soil_Transect_2_3 |
Soil_Transect_1_3 |
SoilCO2_West_A_3 |
SoilCO2_West_C_3 |
Tower_4 |
Soil_Transect_4_4 |
Soil_Transect_3_4 |
Soil_Transect_2_4 |
Soil_Transect_1_4 |
SoilCO2_West_C_4 |
SoilCO2_West_A_4 |
Avg | Spacial Count |
Measurement Count |
|---|---|---|---|---|---|---|---|---|---|---|---|---|---|---|---|---|---|---|---|---|---|---|---|---|---|---|---|---|---|---|---|---|
| 2022-08-05 | 217 | 0 | nan | 4.2 | 0.6 | 2.7 | 0.3 | 6.5 | 2.7 | 10.6 | 12.4 | 11.2 | 4.5 | 6.3 | 11.2 | 14.3 | 9.8 | 12.3 | 15.9 | 12.9 | 14.5 | 11.7 | 26.8 | 11.6 | 20.5 | 28.5 | 14.5 | 14.5 | ||||
| 2022-08-05 | 217 | 1 | nan | 4.5 | 1.2 | 2.7 | 0.3 | 6.2 | 1.8 | 11.5 | 13 | 12.4 | 3.9 | 6.3 | 11.2 | 14.3 | 9.5 | 12.3 | 15.4 | 12.9 | 14.5 | 11.7 | 27.1 | 11.9 | 20.2 | 28.2 | 13.6 | 13.6 | 10.2 | |||
| 2022-08-05 | 217 | Avg | 0-15cm | 0 | 0 | |||||||||||||||||||||||||||
| 2022-08-05 | 217 | Avg | 15-30cm | 0 | 0 | |||||||||||||||||||||||||||
| 2022-08-05 | 217 | Avg | 30-45cm | 0 | 0 | |||||||||||||||||||||||||||
| 2022-08-05 | 217 | Avg | 45-60cm | 0 | 0 |
No VR Moisture Point data found
No TZ grass heigth found
No VR grass heigth found
Tree DBH
| Date | Tag# | Reading (mm) |
|---|---|---|
| 2022-08-05 | 102 | 15.5 |
| 2022-08-05 | 2 | 17.9 |
| 2022-08-05 | 245 | 4.2 |
| 2022-08-05 | 3 | 21.0 |
| 2022-08-05 | 4 | 18.2 |
| 2022-08-05 | 5 | 10.9 |
| 2022-08-05 | 6 | 21.3 |
| 2022-08-05 | 7 | 12.1 |
| 2022-08-05 | 72 | 15.8 |
| 2022-08-05 | 79 | 13.7 |
Water Potential - mode: raw
| Time | Species | Tree | readings (bar) | ||
|---|---|---|---|---|---|
| 2022-08-05 13:07:00 | OAK | 102 | -45 | -48 | -48 |
| 2022-08-05 13:07:00 | OAK | 92 | -43 | -42 | -43 |
No TZ Grass Biomass data found
No TZ OakLeaves Biomass data found
No TZ PineNeedles Biomass data found
2 photos found
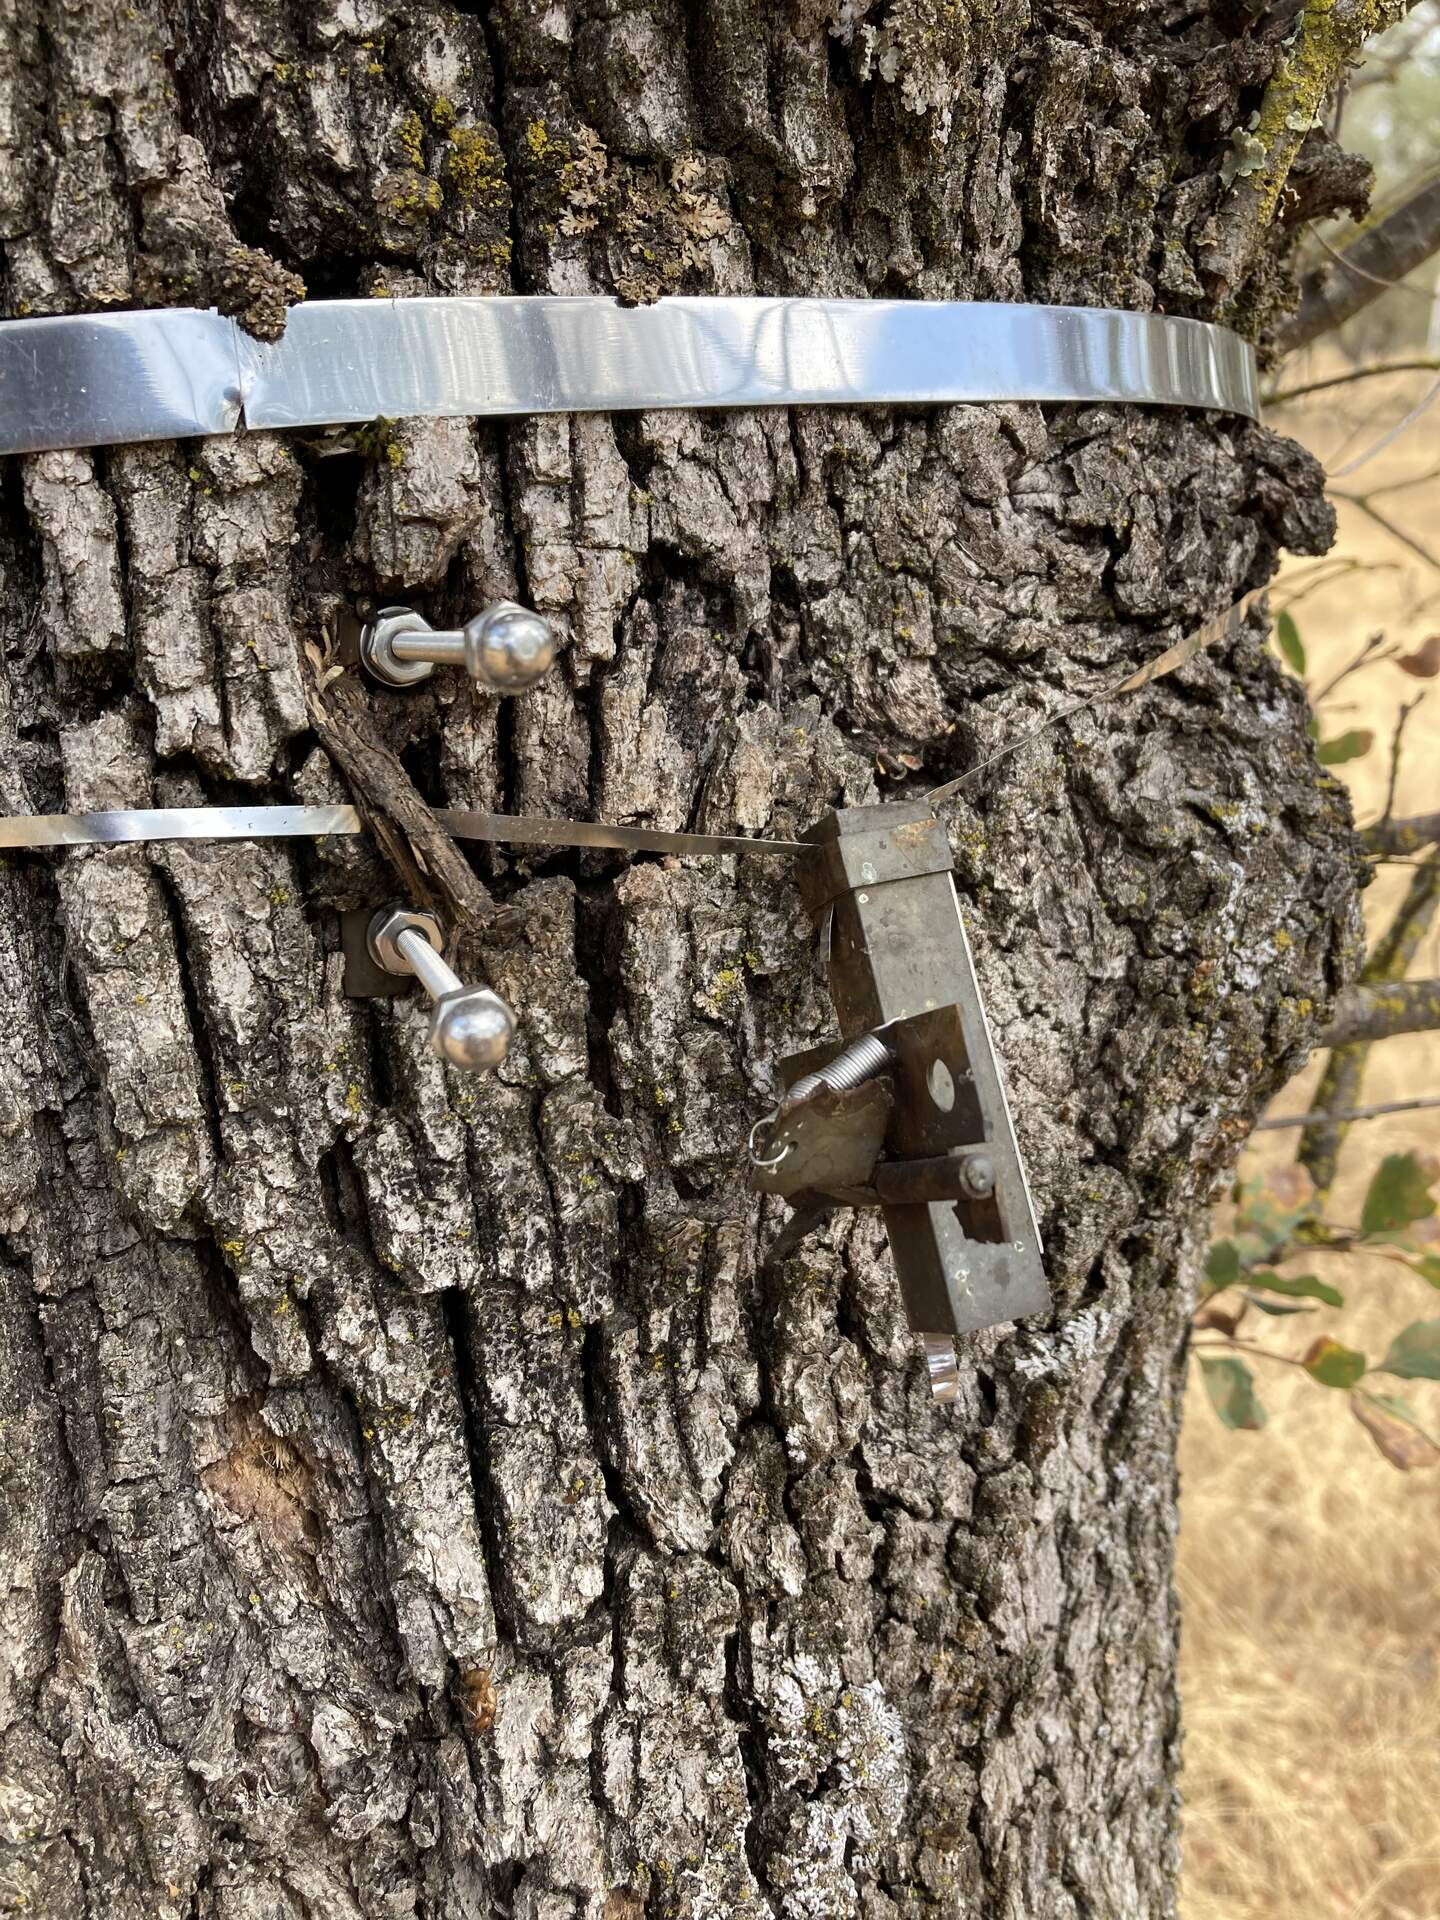
20220805TZ_BrokenDendrometer.jpg ( 2022-08-05 16:01:30 ) Full size: 1440x1920
Tree 1 has been broken the metal mounting plate of its dendrometer with its growth
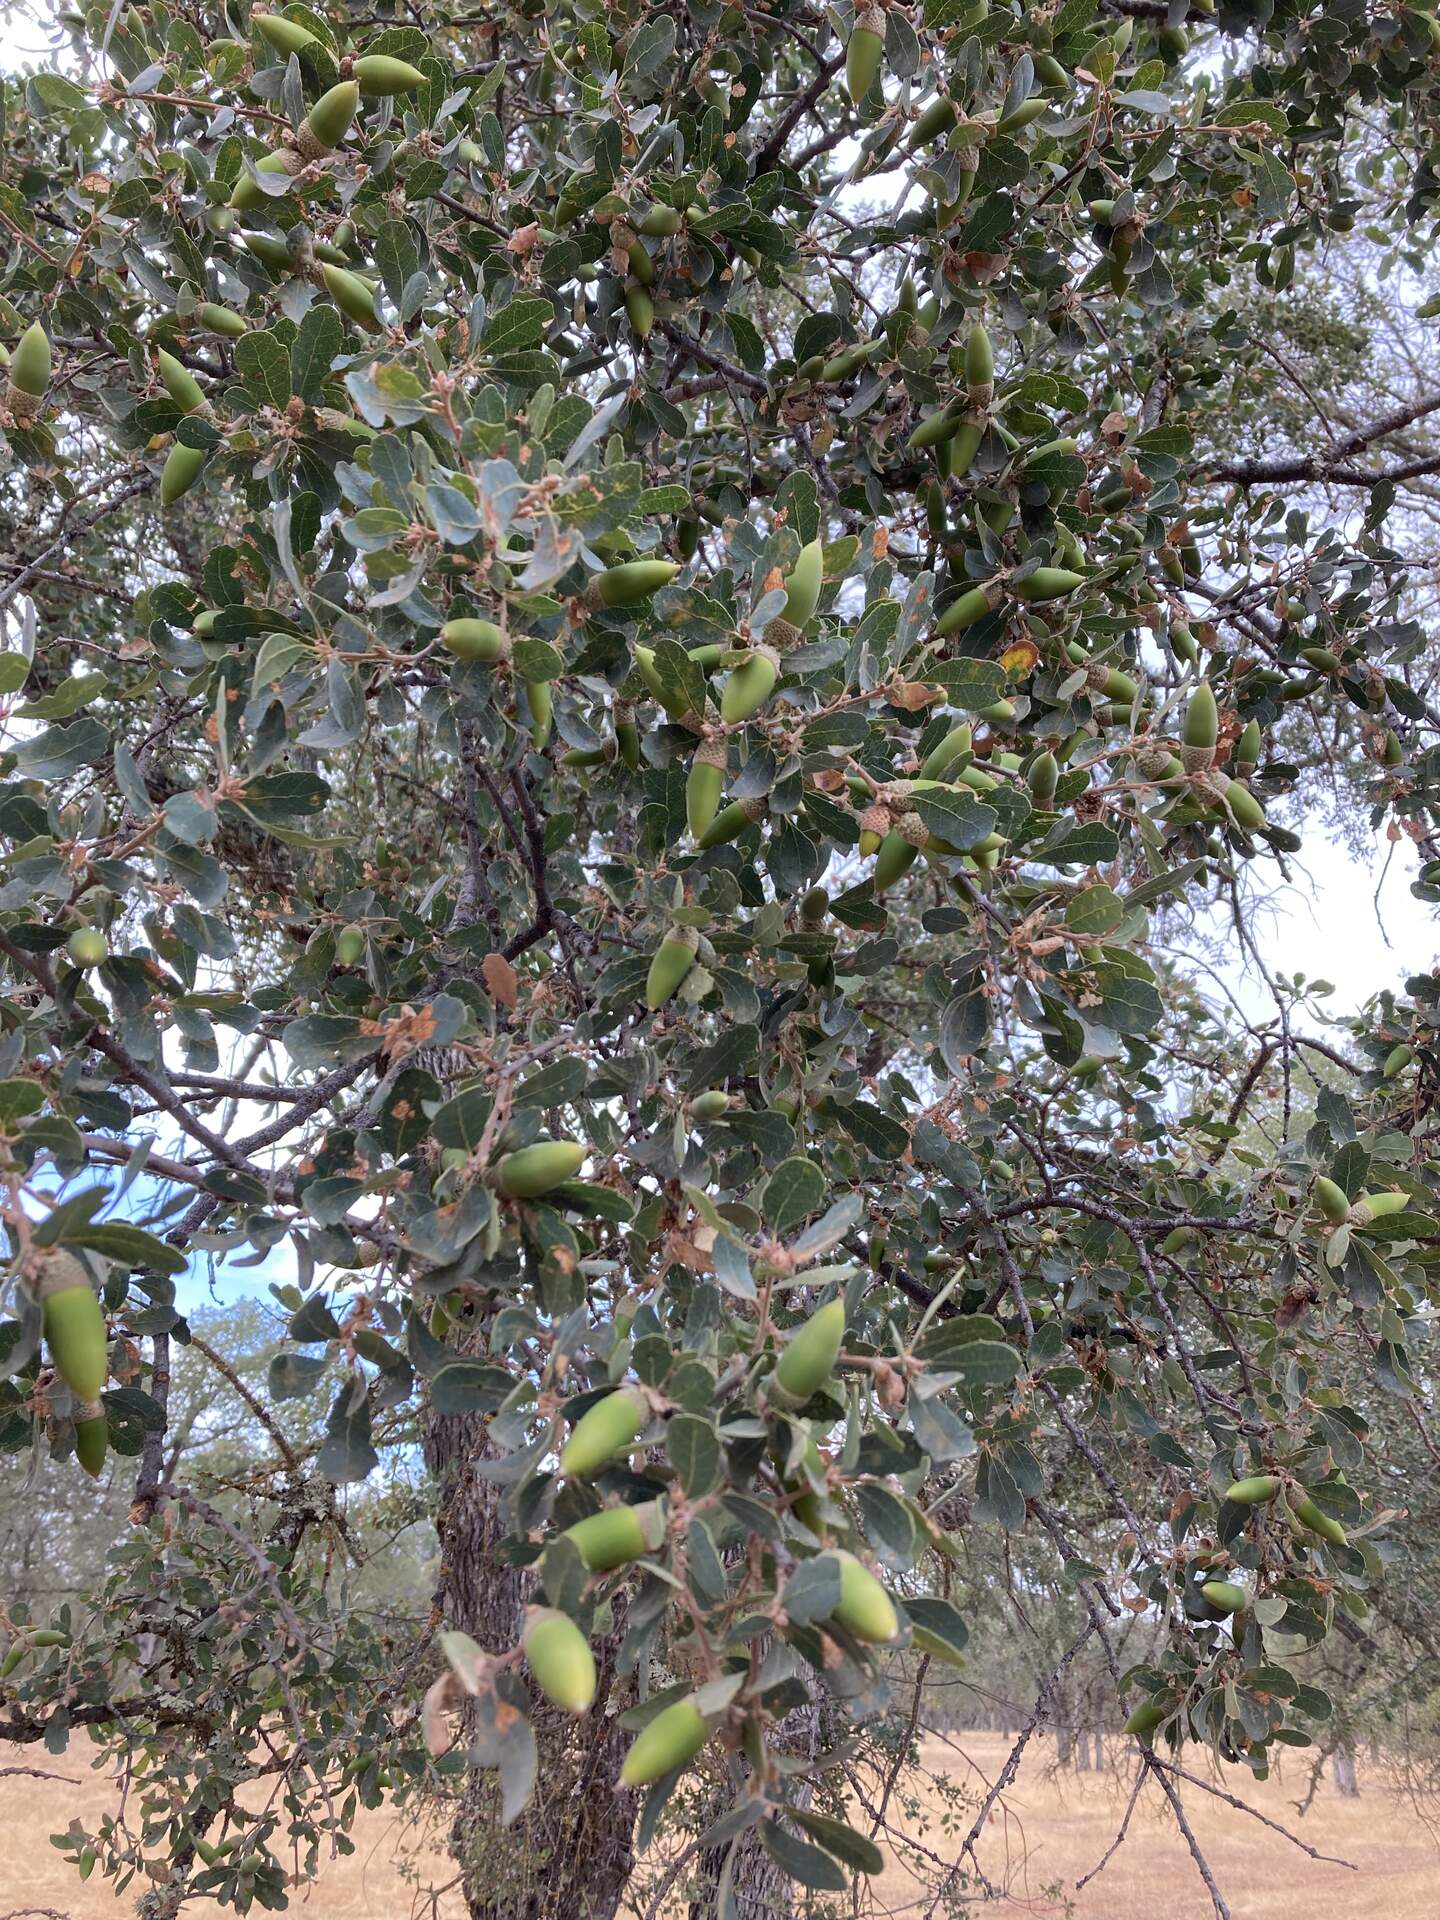
20220805TZ_Acorns.jpg ( 2022-08-05 16:45:29 ) Full size: 1440x1920
One tree with lots of acorns
16 sets found
No data found for TZ_Fenergy.
11 TZ_tmet graphs found
11 TZ_soilco2 graphs found
Can't check TZ_mixed
3 TZ_mixed graphs found
1 TZ_fflux graphs found
8 TZ_fmet graphs found
No data found for TZ_tram.
3 TZ_co2prof graphs found
1 TZ_irt graphs found
No data found for TZ_windprof.
1 TZ_tflux graphs found
8 TZ_sm graphs found
Can't check TZ_met
1 TZ_met graphs found
Can't check TZVR_mixed
8 TZ_osu graphs found
3 TZ_fd graphs found
Tonzi Z-cam data