
Field Notes
<--2022-05-26 13:30:00 | 2022-07-19 10:45:00-->Other sites visited today: Vaira
Phenocam link: Searching...
Tonzi: 2022-06-07 12:00:00 (DOY 158)
Author: Joe Verfaillie
Others:
Summary: Installed soilVue sensors and one last soil matrix potential sensor, midday water potential - need new tank, Tower sonic heading, brought in IRT stuff, lost serial driver for Road Well
| Tonzi 2022-06-07 I arrived at about 12:00 noon PDT. It was dry and hot with a nice breeze. High thin clouds kept the sun from completely cooking me. Almost no green left on the ground and the grass is crispy. A few purple flowers and some tiny pink flowers still. I started to install two new soilVue profile probes near the Floor met boxes. One of the probes sn 2676 went in the open to the south of the Floor met boxes towards the Tower along the existing power conduit. I cut a hole in the conduit and ran the cable back to the Floor CR23x. This probe went in relatively easily. The second SoilVue sn 2674 went to the west near the existing Moisture Point probe and soil matrix sensor under the trees. The first hole there hit roots, rock and finally an impenetrable hard layer. The second hole made it all the way in. I downloaded the Floor met data and uploaded a new program. The new program used the read command (M!) but was getting bad data. It looked a lot like the readings at Vaira when the probes were sharing the control port. But here they have their own port. I uploaded a program using the concurrent commands and that seemed to work so I let it be. Before I got the second soilVue in I went and did midday water potential. The tank only had 500psi (35bar) when I started. Most of the leaves were at about the max pressure the tank could supply. I brought the tank in for return. There seems to be a fresh tank in the lab. I added a third soilVue sn 2688 and a soil matrix potential sensor sn G20007096 to the OSU SP1 CR3000. The sensors went in just south of the data logger box. I connected them to the CR3000 on C5 and C7 but haven’t figured out the program yet. I was able to communicate with both sensors through the terminal. I collected the fluxes, met and camera data. I measured the Moisture Points, DBH and the wells. I initially forgot to write the Floor and Road well levels but think I remembered the values – still need to check to make sure the values make sense. The Tower read: 412.0ppm CO2, 462.1mmol/m3 H2O, 31.3C, 98.6kPa, 103.5SS The Floor read: missed saving this screen shot I lowered the eddy mast on the tower to clean the 7500 and measure the sonic heading – it seems to be 60deg which agrees with a previous heading but not with another estimate. Putting the mast back up the plastic pipe piece shielding the GMP343 fell to the ground. After a round trip to the ground and back I put some tape on it to help hold it in place – might need a screw in the future. I retrieved the IRT equipment I had packed up last time but forgot to bring home. CR23x sn 2143 CR10X sn 47772 Apogee sn 7385 Apogee sn 7638 Apogee sn 1624 DFRobot sn TS01-002 I couldn’t connect to the Global Water logger at the Road well because I had uninstalled the FTDI drivers from the laptop trying to fix the serial port issues. The Global Water logger is really old hardware and I don’t remember what I did to get it to work before. I left at about 17:30 PDT |
Field Data
No tank data
No TZ Well data found
No TZ Moisture Point data found
No VR Moisture Point data found
No TZ grass heigth found
No VR grass heigth found
No TZ Tree DBH found
No water potential data found
No TZ Grass Biomass data found
No TZ OakLeaves Biomass data found
No TZ PineNeedles Biomass data found
2 photos found
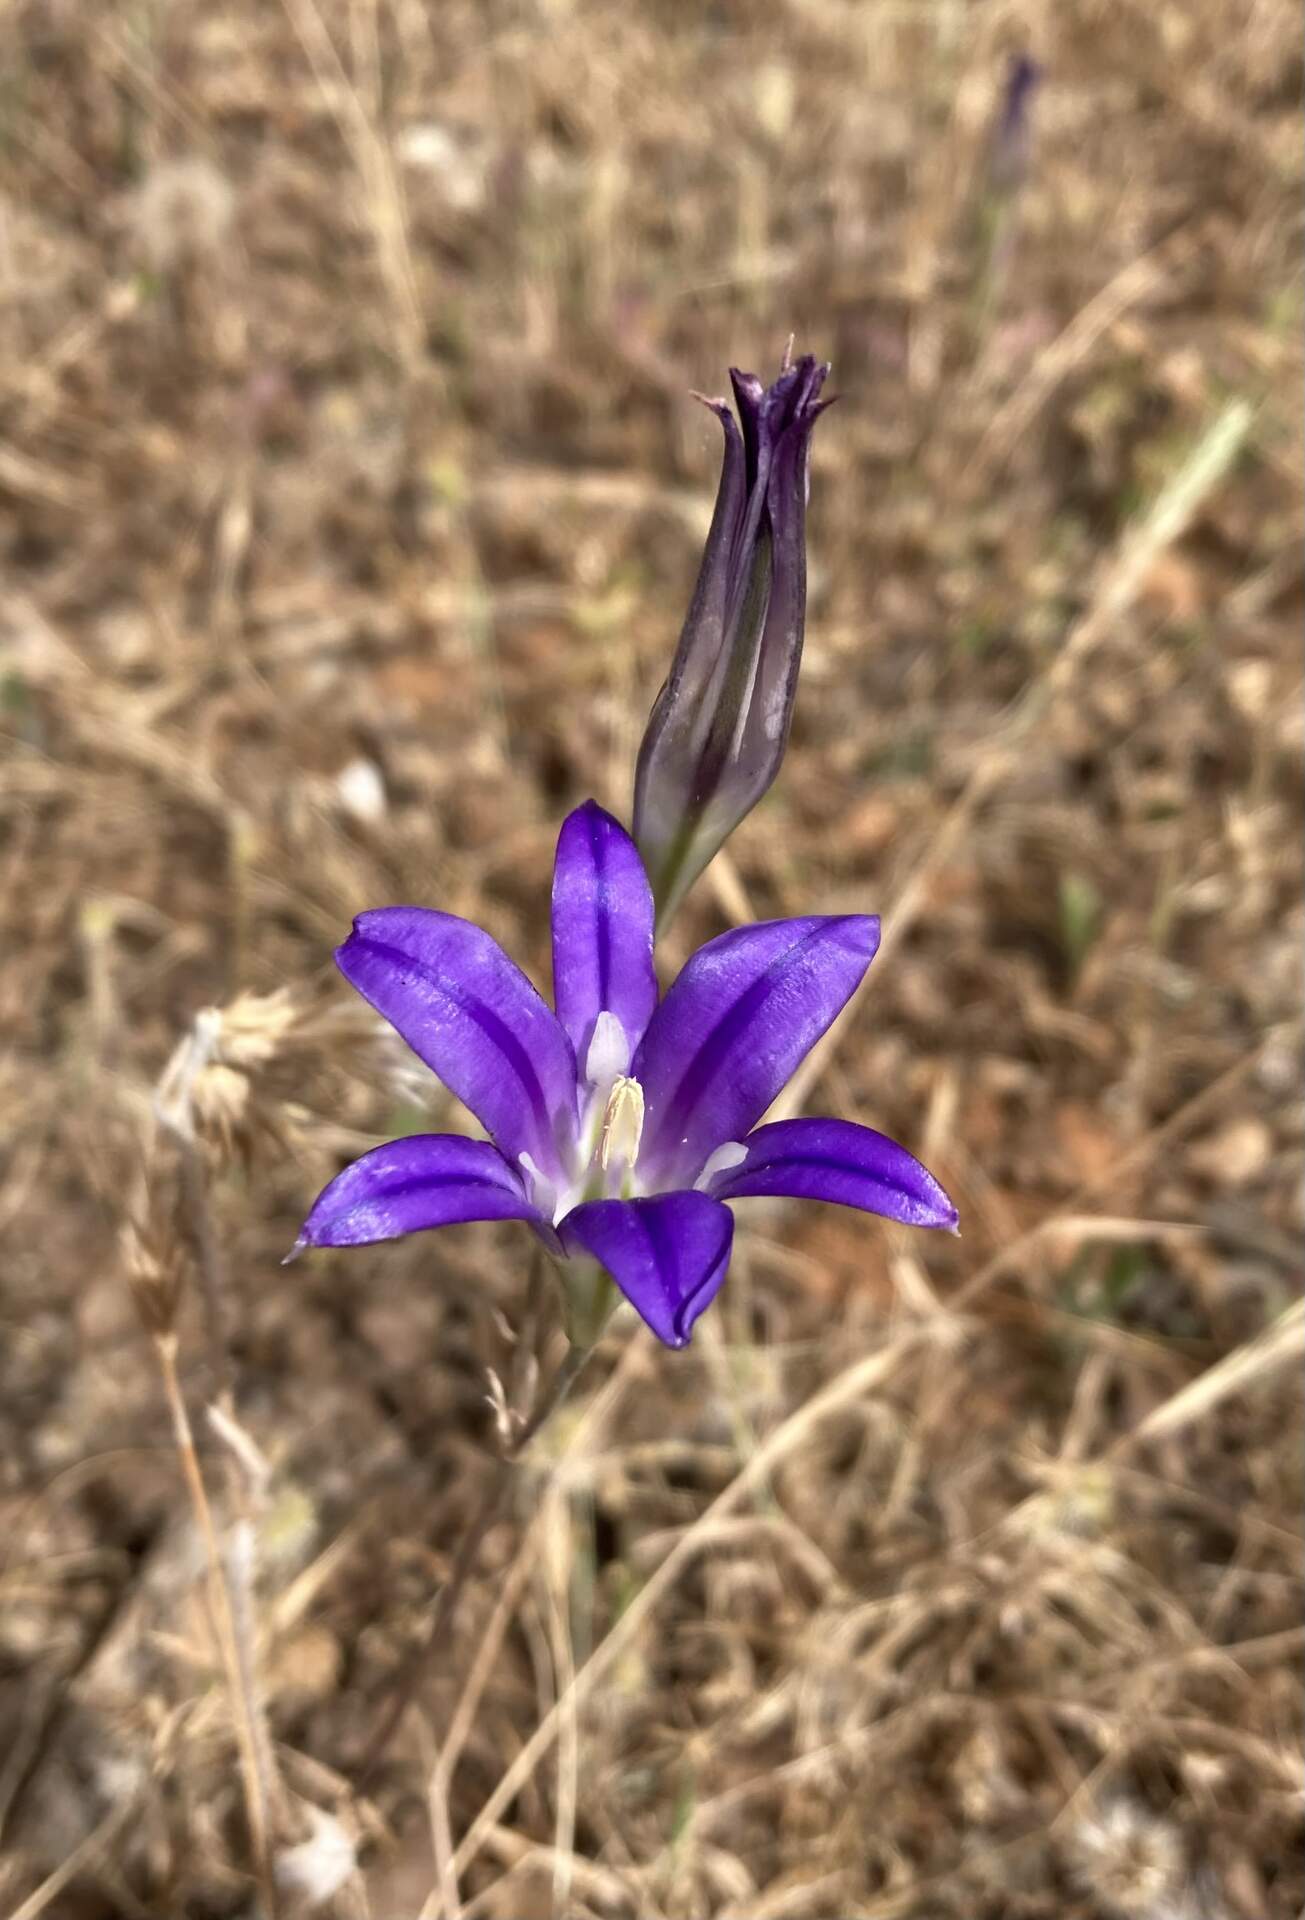
20220607TZ_ClusterLily.jpg ( 2022-06-07 15:59:00 ) Full size: 1305x1920
One of the last flowers cluster lily (Brodiaea)
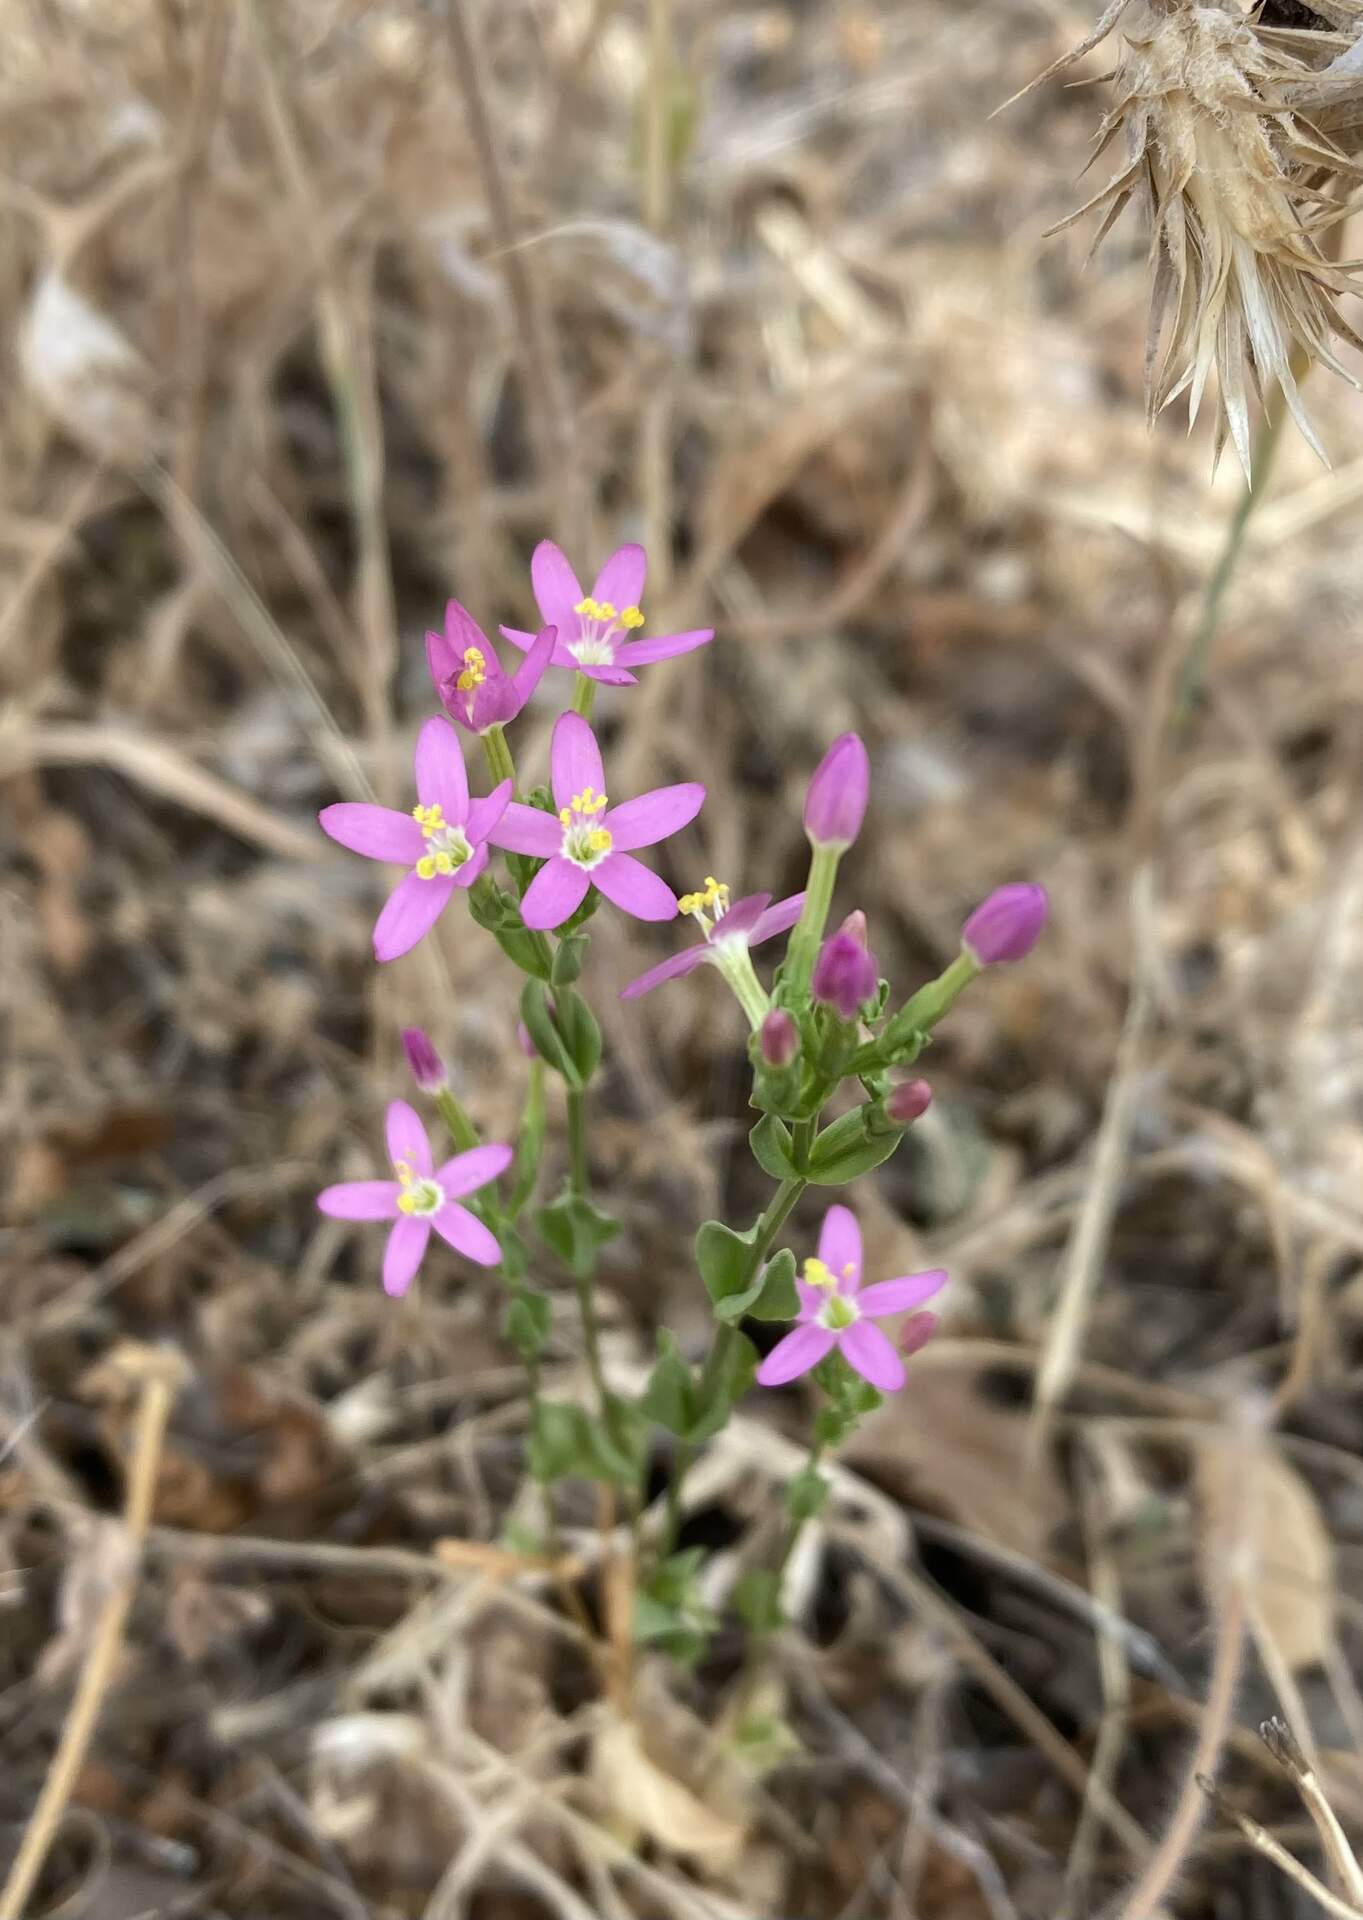
20220607TZ_SlenderCentaury.jpg ( 2022-06-07 15:58:50 ) Full size: 1363x1920
Little pink flower. Slender Centaury (Centaurium Tenuiflorum) native to Eurasia
16 sets found
No data found for TZ_Fenergy.
11 TZ_tmet graphs found
11 TZ_soilco2 graphs found
Can't check TZ_mixed
3 TZ_mixed graphs found
1 TZ_fflux graphs found
8 TZ_fmet graphs found
No data found for TZ_tram.
3 TZ_co2prof graphs found
1 TZ_irt graphs found
No data found for TZ_windprof.
1 TZ_tflux graphs found
2 TZ_sm graphs found
Can't check TZ_met
1 TZ_met graphs found
Can't check TZVR_mixed
8 TZ_osu graphs found
3 TZ_fd graphs found
Tonzi Z-cam data