
Field Notes
<--2022-06-07 10:40:00 | 2022-07-21 10:00:00-->Other sites visited today: Tonzi
Phenocam link: Searching...
Vaira: 2022-07-19 09:15:00 (DOY 200)
Author: Daphne Szutu
Others: Dennis, Kanishka
Summary: First visit in 6 weeks, warm day, regular data collection/cleaning using sneakernet, downloaded pond data, wild boars
| 2022-07-19 Vaira Dennis, Kanishka, and I arrived at 9:15 PDT. This is the first site visit in 6 weeks. Joe is in Japan and my previous trip was canceled because of COVID quarantine. When we arrived, the car said it was 28C (83F) but it felt warmer to me. It was mostly clear with a slight, warm breeze. The grass is brown and crispy but the oak trees still seem green and happy. There was a small puddle at the bottom of the watering hole. We didn't see any cows today and left the electric fence off. Dennis and Kanishka walked around, taking well water level and spectral measurements. Dennis cleaned the radiometers. I downloaded met, camera, USB GHG, and FD chamber data. I cleared the FD chamber memory after download. Datamule was not happy with the serial-USB cables I tried, so I used sneakernet to download data. On the met CR1000, I downloaded data since early June to provide some overlap since the last field data. I also downloaded the met CR1000 program because I was curious how many soilvue sensors were installed and what SDI-12 command Joe ended up using for the soilvue sensors. This program came in handy later at Tonzi when troubleshooting the soilvue instructions for the OSU SP1 CR3000 program. The 7500 read: 407ppm CO2, 316mmol/m3 H2O, 30.6C, 99.5kPa, 101SS We drove to the pond. As we approached the pond, we startled four boars (two large and two small) and a covey of quails. The boars ran from out of the mini wetland and uphill to the west. Hope the boars are not causing too much trouble. The bottom of the staff gauge was covered with floating aquatic veg, and we estimated the water level was 14.2 feet. I downloaded the pond data from the CR10X. The CR10X doesn’t have an option to collect data since a certain date, so I collected all data on the CR10X. We headed to Tonzi around 10:30 PDT. Loreli is planning to come here (and BA/BC) this Thursday to install a new Arable. |
Field Data
No tank data
No VR Well data found
No TZ Moisture Point data found
No VR Moisture Point data found
No TZ grass heigth found
No VR grass heigth found
No VR Tree DBH found
No water potential data found
No VR Grass Biomass data found
No VR OakLeaves Biomass data found
No VR PineNeedles Biomass data found
3 photos found
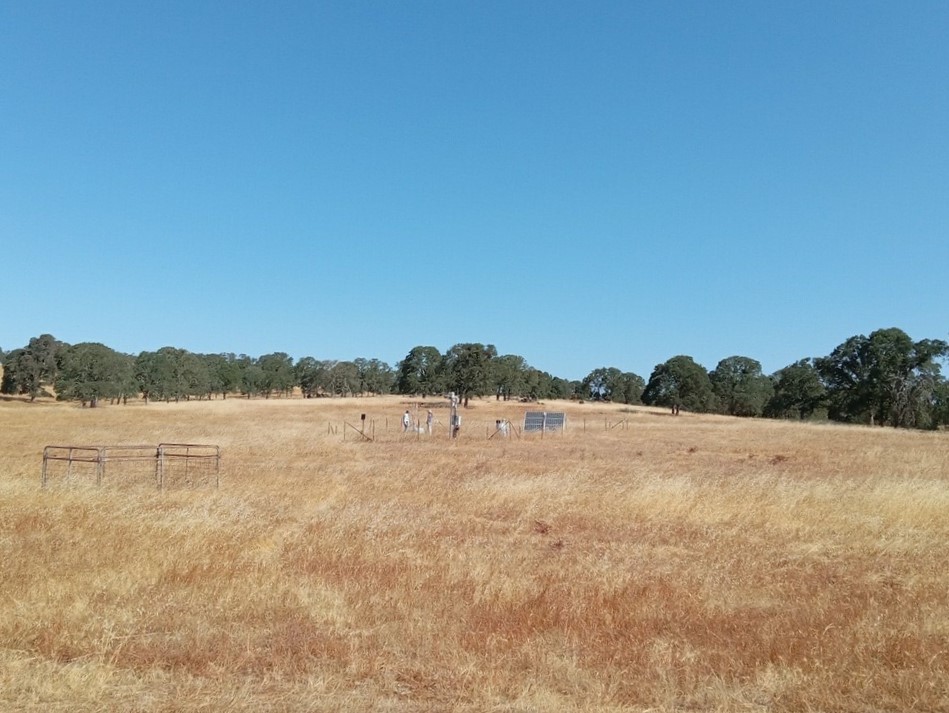
20220719VR_Site.jpg ( 2022-07-19 16:32:05 ) Full size: 949x713
Kanishka's first site visit to Tonzi/Vaira
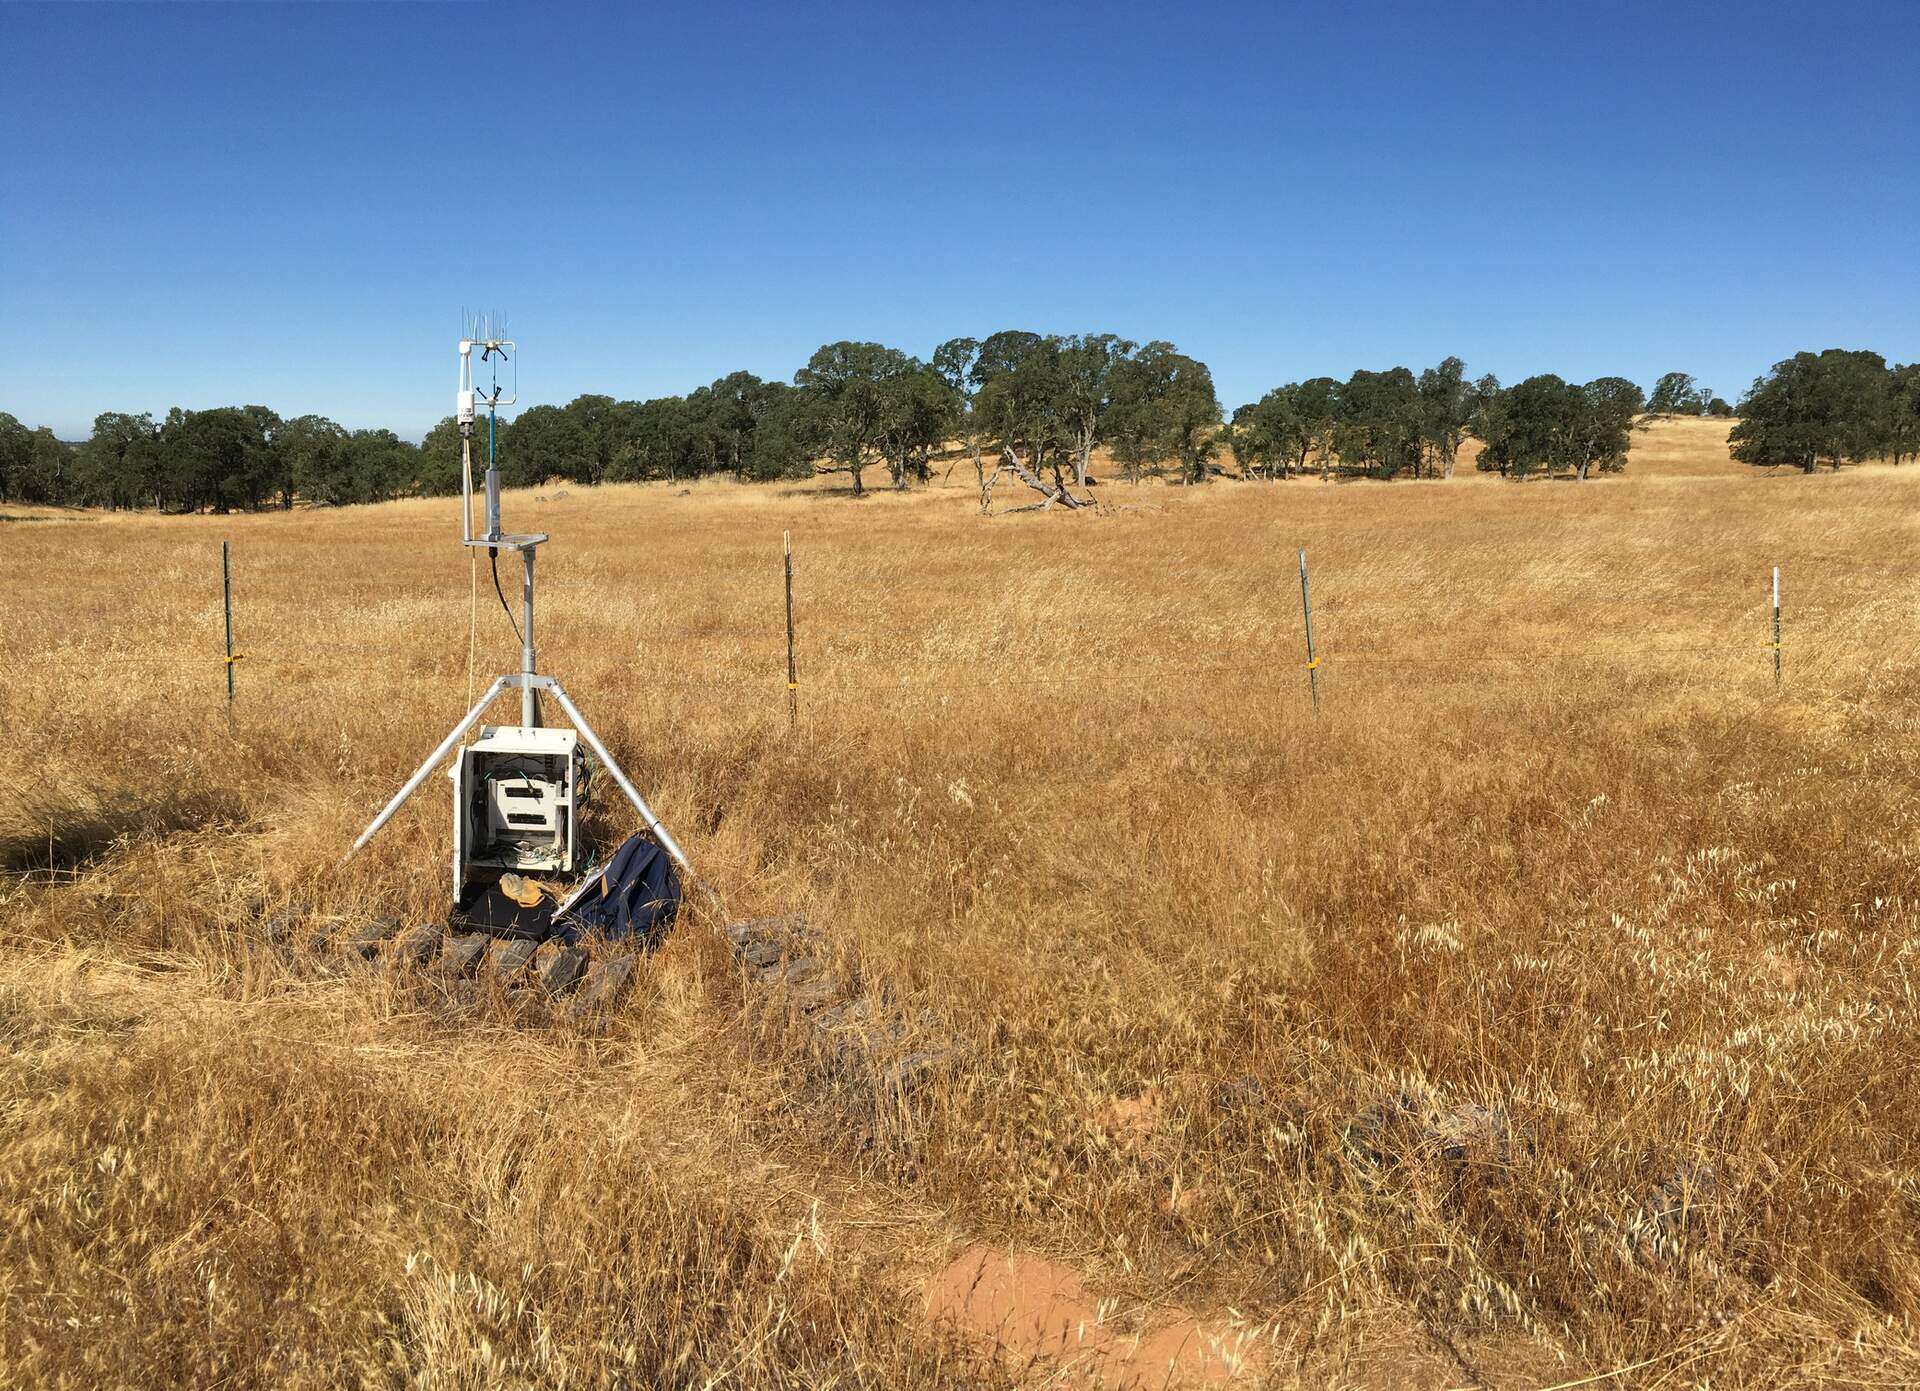
20220719VR_Summer.jpg ( 2022-07-19 10:04:15 ) Full size: 1920x1391
Golden grasslands and green oak trees of a California summer

20220719VR_WateringHole.jpg ( 2022-07-19 10:37:42 ) Full size: 1920x1440
Not much water left in the watering hole
9 sets found
16 VR_met graphs found
2 VR_flux graphs found
No data found for VR_soilco2.
2 VR_pond graphs found
Can't check TZVR_mixed
3 VR_fd graphs found
4 VR_processed graphs found
4 VR_arable graphs found
6 VR_soilvue graphs found