
Field Notes
<--2022-05-10 13:10:00 | 2022-06-07 12:00:00-->Other sites visited today: Vaira | West Pond | East End
Phenocam link: Searching...
Tonzi: 2022-05-26 13:30:00 (DOY 146)
Author: Joe Verfaillie
Others: Carlos
Summary: Midday water potential, Showing Carlos the sites (sights?), hiccup in tower data loggers or computer, removed IRTs but forgot to bring them home, ran out of time from SoilVUE and matrix potential probes
| Tonzi 2022-05-26 Carlos and I arrived at about 13:30 PDT. It was clear sunny and hot with some high thin clouds and a nice breeze. The last three days have been really hot. The grass is mostly yellow and most of the flowers from last time are gone. A few more late bloomers are flowering but not nearly in the numbers of the earlier flowers. There were a bunch of young cows and mamas near the water trough when we arrived. I did midday water potential as soon as we arrived. Then we climbed the tower and collected the flux and camera images before I gave Carlos a tour of his tasks for the day. Carlos did the soil moisture and well measurements along with servicing the z-cams. I collect the rest of the flux, met and FD data. I read the dendrometers. I removed the IRTs from the cal panel and got them ready to bring home but then forgot to put them in the car. They are fine where they are as long as the cows don’t try to eat them. The cal panel with imbedded thermocouples will remain for now. The Tower 7500: 403.6ppm CO2, 622.3mmol/m3 H2O, 26.6C, 98.5kPa, 99.8SS The Floor 7500: 421.7ppm CO2, 512.1mmol/m3 H2O, 27.8C, 98.7kPa, 100.5SS There was a power outage from about 1700 on 5/16 to the morning of 5/17. I’m not sure why as this doesn’t look like the normal solar power failing outage. The Tower computer was hung up with a failed to boot notice, but booted okay with a restart. The flux data doesn’t seem to be affected so maybe just the computer skipped some of the data logger records. I’ll manual check to see if the missing records are still on the data loggers next time. I was hoping to install three more new SoilVUE10 sensors and the last matrix potential sensor, but the ones at Vaira took longer than I thought they would and we still needed to do two sites in the Delta on the way home. We left at about 16:00 PDT. |
Field Data
No tank data
Well Depth
| Date | Location | Depth (feet) |
|---|---|---|
| 2022-05-26 | WP | 2.67 |
| 2022-05-26 | VR_pond | 16.3 |
| 2022-05-26 | VR_well | 55.3 |
| 2022-05-26 | TZ_floor | 25.2 |
| 2022-05-26 | TZ_road | 34.25 |
| 2022-05-26 | TZ_tower | 29.1 |
mode = both
Moisture Point Probes TZ
Array
(
[0] => Tower_1
[1] => Soil_Transect_4_1
[2] => Soil_Transect_3_1
[3] => Soil_Transect_2_1
[4] => Soil_Transect_1_1
[5] => SoilCO2_West_A_1
[6] => SoilCO2_West_C_1
[7] => Tower_2
[8] => Soil_Transect_4_2
[9] => Soil_Transect_3_2
[10] => Soil_Transect_2_2
[11] => Soil_Transect_1_2
[12] => SoilCO2_West_A_2
[13] => SoilCO2_West_C_2
[14] => Tower_3
[15] => Soil_Transect_4_3
[16] => Soil_Transect_3_3
[17] => Soil_Transect_2_3
[18] => Soil_Transect_1_3
[19] => SoilCO2_West_A_3
[20] => SoilCO2_West_C_3
[21] => Tower_4
[22] => Soil_Transect_4_4
[23] => Soil_Transect_3_4
[24] => Soil_Transect_2_4
[25] => Soil_Transect_1_4
[26] => SoilCO2_West_A_4
[27] => SoilCO2_West_C_4
)
| Date | DOY | Rep | Depth | Tower_1 |
Soil_Transect_4_1 |
Soil_Transect_3_1 |
Soil_Transect_2_1 |
Soil_Transect_1_1 |
SoilCO2_West_A_1 |
SoilCO2_West_C_1 |
Tower_2 |
Soil_Transect_4_2 |
Soil_Transect_3_2 |
Soil_Transect_2_2 |
Soil_Transect_1_2 |
SoilCO2_West_A_2 |
SoilCO2_West_C_2 |
Tower_3 |
Soil_Transect_4_3 |
Soil_Transect_3_3 |
Soil_Transect_2_3 |
Soil_Transect_1_3 |
SoilCO2_West_A_3 |
SoilCO2_West_C_3 |
Tower_4 |
Soil_Transect_4_4 |
Soil_Transect_3_4 |
Soil_Transect_2_4 |
Soil_Transect_1_4 |
SoilCO2_West_A_4 |
SoilCO2_West_C_4 |
Avg | Spacial Count |
Measurement Count |
|---|---|---|---|---|---|---|---|---|---|---|---|---|---|---|---|---|---|---|---|---|---|---|---|---|---|---|---|---|---|---|---|---|---|---|
| 2022-05-26 | 146 | 0 | nan | 7.1 | 0.4 | 0.1 | 4.7 | 1.5 | 10.3 | 4.7 | 12.4 | 6.3 | 14.2 | 12.7 | 4.8 | 9.3 | 12.4 | 15.6 | 10.3 | 13.1 | 17.3 | 13.7 | 15.4 | 12.3 | 21.9 | 12.8 | 19.6 | 28.8 | 14.5 | 18.2 | 16.5 | |||
| 2022-05-26 | 146 | 1 | nan | 6.5 | 0.4 | 0.1 | 4.2 | 1.8 | 10 | 4.7 | 12.4 | 6.9 | 14.5 | 13 | 4.8 | 8.7 | 12.4 | 15.6 | 10.6 | 14 | 17.3 | 14 | 16.2 | 12.6 | 20.8 | 12.5 | 18.2 | 29.4 | 14.2 | 18.2 | 16.5 | |||
| 2022-05-26 | 146 | 2 | nan | 1.2 | 7.8 | 10.9 | 12.5 | |||||||||||||||||||||||||||
| 2022-05-26 | 146 | Avg | 0-15cm | 0 | 0 | |||||||||||||||||||||||||||||
| 2022-05-26 | 146 | Avg | 15-30cm | 0 | 0 | |||||||||||||||||||||||||||||
| 2022-05-26 | 146 | Avg | 30-45cm | 0 | 0 | |||||||||||||||||||||||||||||
| 2022-05-26 | 146 | Avg | 45-60cm | 0 | 0 |
No VR Moisture Point data found
No TZ grass heigth found
No VR grass heigth found
Tree DBH
| Date | Tag# | Reading (mm) |
|---|---|---|
| 2022-05-26 | 1 | 21.3 |
| 2022-05-26 | 102 | 17.3 |
| 2022-05-26 | 2 | 18.1 |
| 2022-05-26 | 245 | 5.0 |
| 2022-05-26 | 3 | 21.1 |
| 2022-05-26 | 4 | 18.2 |
| 2022-05-26 | 5 | 10.8 |
| 2022-05-26 | 6 | 21.4 |
| 2022-05-26 | 7 | 12.1 |
| 2022-05-26 | 72 | 15.3 |
| 2022-05-26 | 79 | 13.9 |
Water Potential - mode: raw
| Time | Species | Tree | readings (bar) | ||
|---|---|---|---|---|---|
| 2022-05-26 13:43:00 | OAK | 102 | -34 | -27 | -27 |
| 2022-05-26 13:43:00 | OAK | 92 | -27 | -34 | -34 |
No TZ Grass Biomass data found
No TZ OakLeaves Biomass data found
No TZ PineNeedles Biomass data found
1 photos found
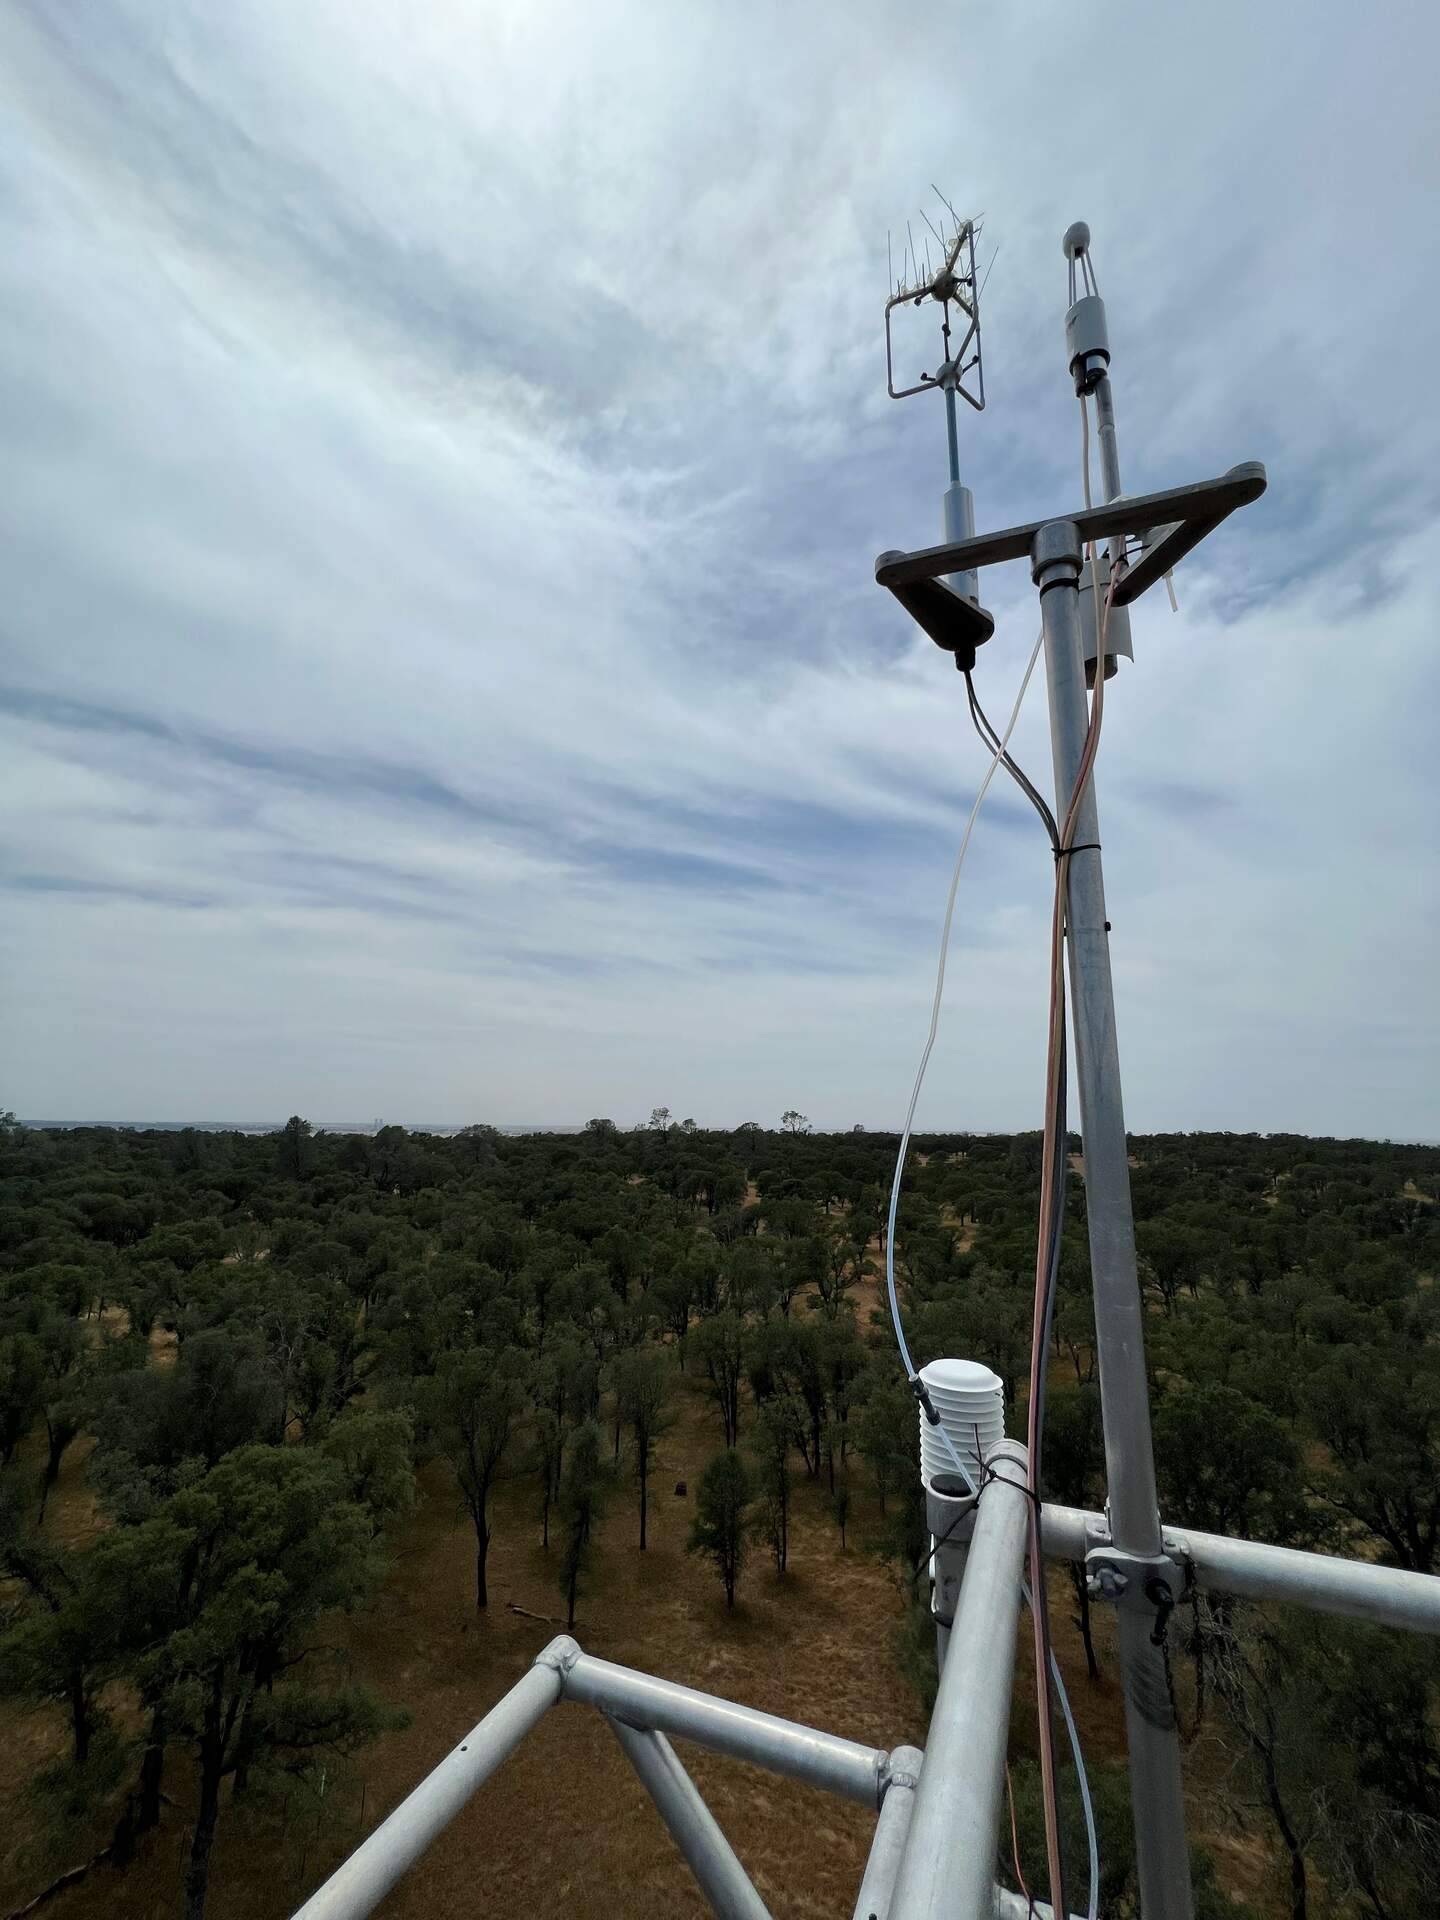
20220526TZ_TowerTop.jpg ( 2022-05-26 14:15:29 ) Full size: 1440x1920
Looking west from the tower top
16 sets found
No data found for TZ_Fenergy.
11 TZ_tmet graphs found
11 TZ_soilco2 graphs found
Can't check TZ_mixed
3 TZ_mixed graphs found
1 TZ_fflux graphs found
8 TZ_fmet graphs found
No data found for TZ_tram.
3 TZ_co2prof graphs found
1 TZ_irt graphs found
No data found for TZ_windprof.
1 TZ_tflux graphs found
2 TZ_sm graphs found
Can't check TZ_met
1 TZ_met graphs found
Can't check TZVR_mixed
8 TZ_osu graphs found
3 TZ_fd graphs found
Tonzi Z-cam data