
Field Notes
<--2022-03-15 10:40:00 | 2022-04-13 14:50:00-->Other sites visited today: Hill Slough | Bouldin Alfalfa | West Pond | East End | Mayberry | Gilbert Tract
Phenocam link: Searching...
Bouldin Corn: 2022-03-31 11:50:00 (DOY 90)
Author: Daphne Szutu
Others: Joe
Summary: Regular data collection/cleaning, tilling neighboring field--moved soil sensors and PL Arable out of the field, swapped PL Arable, dfPAR motor not working--brought back to lab
| 2022-03-31 Bouldin Corn Joe and I arrived at 11:50 PDT. It was mild with high thin clouds and a strong breeze from the west. They were tilling the field south of us so Joe dug out our soil sensors and reinstalled them under the tower (using the FD chamber garden stake as a pilot rod). After installation, the Theta prove was reading a negative number. Joe re-did the sensor connector and it read ~800 mV as expected. Position, serial number, and depth of sensor from soil surface to top of tines North, sn 17129, 10cm Mid, sn 17133, 20cm South, sn 17128, 15cm (Theta probe), sn M003370, at surface He also moved the PL Arable back to the edge of the field so it’s about 20m north of our tower. He swapped the Arable: sn C004318 came off and sn C011081 went on. The old Arable had some gaps. The dfPAR motor was broken. Joe got the motor to work for about ½ a revolution with some WD-40, but then it stopped again. We brought the motor and shadow band back to the lab. The shadow band needs a new set screw because I dropped the old one from the tower. I downloaded met, cam, and USB GHG data and cleaned flux and rad sensors. I downloaded the PA data and power cycled it. I downloaded the IRT data by swapping the microSD card and using CardConvert to convert the fast data to TOB1 and the slow data to TOA5. LI-7500 readings: CO2 413ppm H2O 380ppm T 19.1C P 101.4kPa SS 102 --> didn’t clean LI7700 readings: CH4 1.98ppm RSSI 40 --> 79 after cleaning We left at 13:10 PDT. |
1 photos found
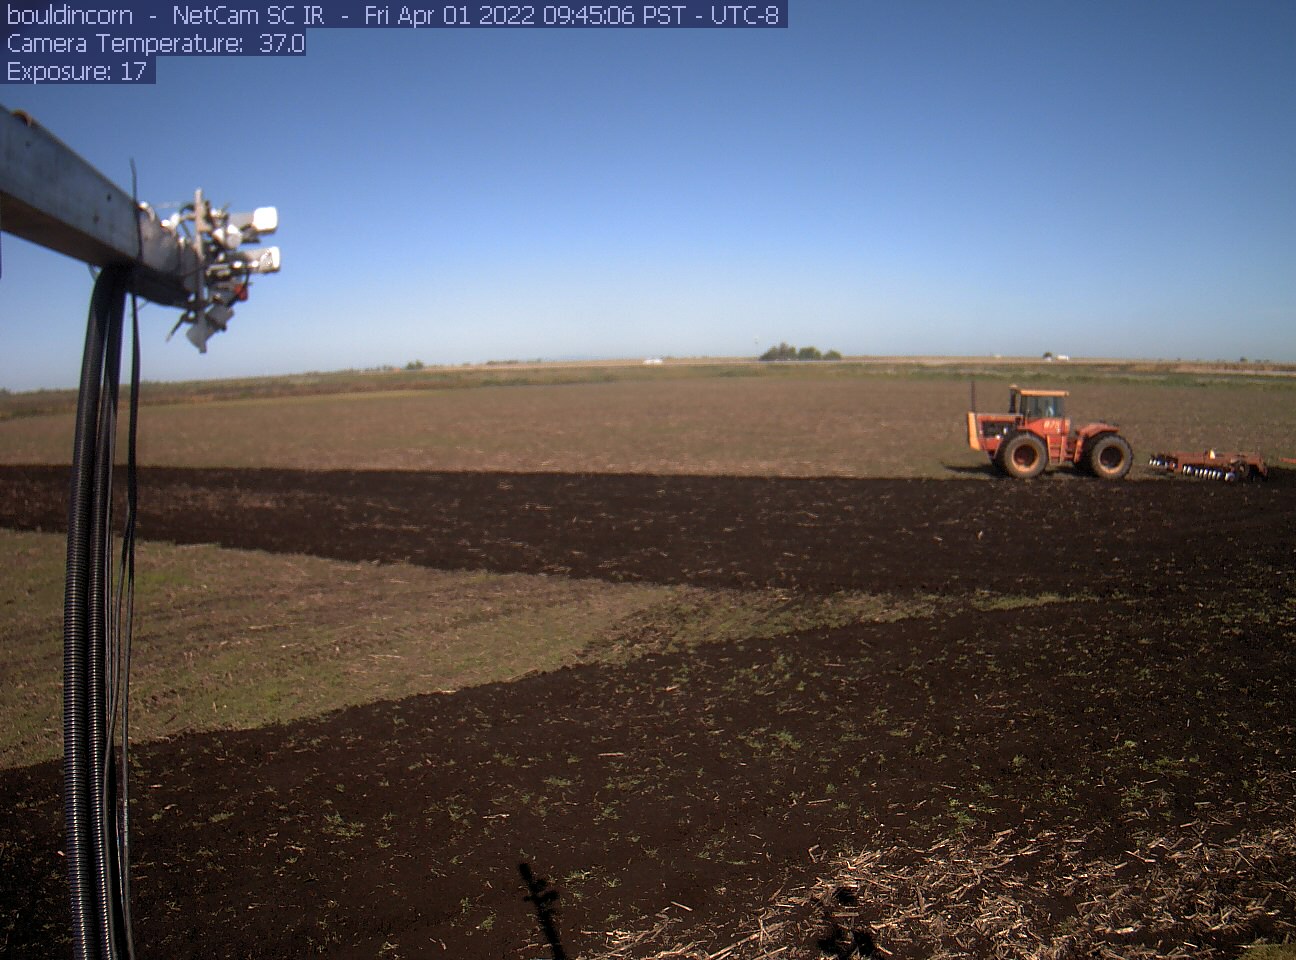
bouldincorn_2022_04_01_094506.jpg ( 2022-04-01 10:46:26 ) Full size: 1296x960
Tractor tilling the field
6 sets found
17 BC_met graphs found
5 BC_flux graphs found
Can't check TATWBABCSB_cam
Can't check MBSWEEWPBCBA
2 BC_pa graphs found
1 BC_arable graphs found