
Field Notes
<--2021-10-21 17:20:00 | 2021-11-18 11:35:00-->Other sites visited today: Bouldin Corn | Gilbert Tract | Hill Slough
Phenocam link: Searching...
Bouldin Alfalfa: 2021-11-05 13:15:00 (DOY 309)
Author: Daphne Szutu
Others: Robert, Vona, Christine
Summary: Regular data collection/cleaning, dismantle bouncer tower and advection experiment, missing 5 days of CF card data, start HMP intercomparison, remove calibration radiometers, spectral, veg height
| 2021-11-05 Bouldin Alfalfa Robert, Vona, Christine, and I arrived around 13:15 PDT at the bouncer tower. It was mild with a cool breeze and mostly overcast with wispy clouds. We had an atmospheric river last weekend that delivered about 12 cm of rain and sustained winds: the 30-min wind speed was 7-9m/s for about 12 hours. Despite all that, the tower and instruments looked generally ok, except for the calibration CR1000 that had some water in its enclosure. The alfalfa looks great and has large leaves. I downloaded the bouncer data and we dismantled the bouncer tower. From the upper location, we removed sonic sn 152603 and HMP155 sn T2820180. From the lower location, we removed sonic sn 153805 and HMP155 sn T2820183. CR6 sn 2115 was brought back to the lab. Robert chased a large black widow out of the battery box. Charge controller sn 03220377, and solar panel sn 04592G0181 were also removed. We arrived at the main tower around 14:05 PDT. We removed the lower sonic sn 152601 and HMP155 sn T2930114. We removed all the calibration radiometers and brought them back to the lab. The CNR4 and PAR will go back to AMP to swap for freshly calibrated one. When we opened the datalogger enclosure, there was a few cm of water at the bottom from rain in the past 2 weeks. The wooden backing board and the very bottom of the datalogger were submerged, but the wiring panel was dry and the data all looked fine. I called Joe, who said the datalogger is pretty well sealed except for the wiring panel and the area right below the wiring panel where it connects to the silver box. Sensors removed: CNR4 sn 121038 PAR sn 060831 NDVI in sn 1049 NDVI out sn 1050 Since the rad calibration data looked fine, I decided to continue with the HMP intercomparison. Robert added a short post on the west side of the main tower and installed all 3 bouncers HMP155s to do a direct intercomparion with the tower HMP155. These HMP155s were connected to the calibration CR1000 sn 23865 as differential measurements and continuously powered; this is the same wiring/power pattern as the tower HMP155. Sn T2930114 was wired to DE1/2 and installed east of the post Sn T2820183 was wired to DE3/4 and installed west of the post Sn T2820180 was wired to DE5/6 and installed north of the post After installation, all 3 HMP155s had a temperature of 17.3-17.4 deg C and a RH of 57.6-57.7%. All 3 HMP155s are aspirated. The test HMP155s were at height 350cm. The tower HMP155 was at height 353cm. To prevent more water from collecting on the bottom, we used zipties to tie the datalogger box up on the scaffolding. The HMP fan wires were too short for us to lean it again the side of the scaffolding on top of the boardwalk. We brought all the sonics back to the lab to store until next year’s advection setup. We left the telescoping pole from the bouncer tower leaning inside against the main tower scaffolding. We’ll bring it back to the lab next time we have a properly large truck. Vona took some spectral measurements following our protocol. She also uses the jaz spectrometer so she was familiar with the instrument. It was overcast so I’ll need to check the “up†measurements closely. Christine took veg height measurements. I downloaded met, camera, and USB GHG data. I downloaded the FD data and cleared its memory. I downloaded the IRT data by swapping the microSD card and using CardConvert to convert the fast data to TOB1 and the slow data to TOA5. I don’t remember the wash reservoir level, but we refilled it. It was getting late and we did not test the rain bucket here—next time. Next time we also need to change the datalogger program to remove the 10-sec Temp/RH measurement and data table and update the GHG columns to stop saving the 7700 analog channels that were used to save the lower sonic data. LI-7500 readings: CO2 414ppm H2O 496ppm T 19.4C P 101.6kPa SS 95 after cleaning (should be cleaner next time) LI7700 readings: CH4 2.0 RSSI 79 after cleaning We left at 15:50 PDT. Back in the lab, there was no data on the CF card from 10/21 to the evening of 10/26. Both the Temp/RH and photos start on 10/26—not sure why. I will do a full reformat of this card before we use it again. |
Next Mowing: 2021-11-19
Veg Height (cm): Tape measure from ground to top of plant
32, 35, 34, 28, 36, 40, 40, 38, 33, 33, 37, 36, 44, 42, 40, 38, 34, 37, 33, 29, avg = 36, stdev = 4.12
4 photos found

20211105BA_HmpCompare.jpg ( 2021-11-05 15:49:13 ) Full size: 1920x1440
Three HMP155s set up on the BA tower for an HMP intercomparison for Carlos's the bouncer experiment. The calibration datalogger enclosure is zip-tied to the scaffolding to prevent water from pooling in the bottom of the enclosure.
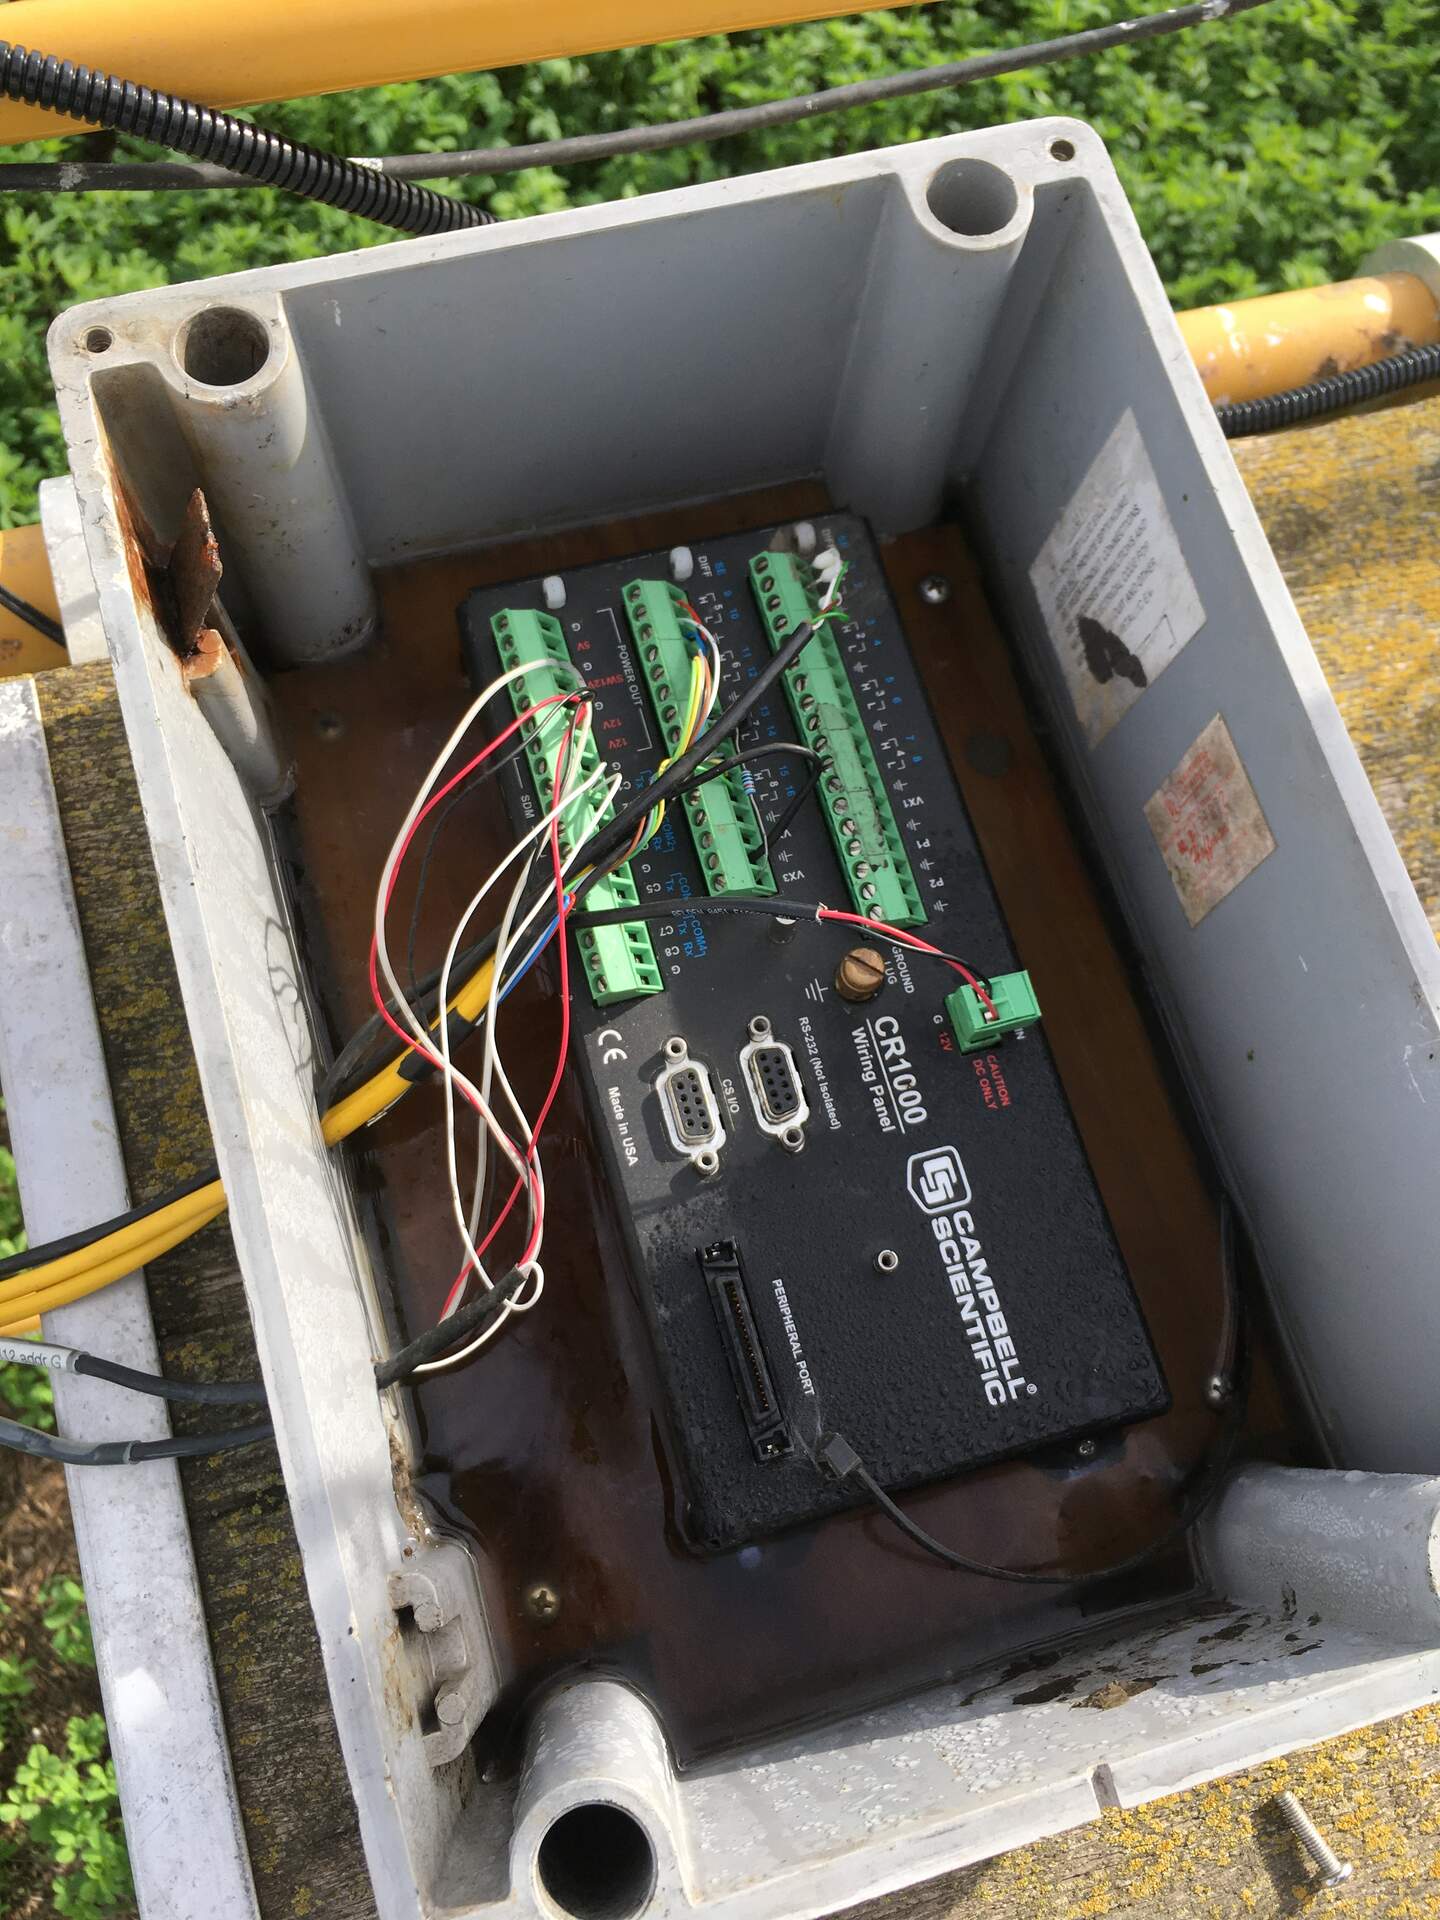
20211105BA_WaterInEnvlosure.jpg ( 2021-11-05 14:47:49 ) Full size: 1440x1920
Some water pooling in the bottom of the enclosure after last weekend's atmospheric river. The datalogger and data seem fine though.

bouldinalfalfa_2021_11_05_104506.jpg ( 2021-11-05 11:46:54 ) Full size: 1296x960
Kestrel on 7700
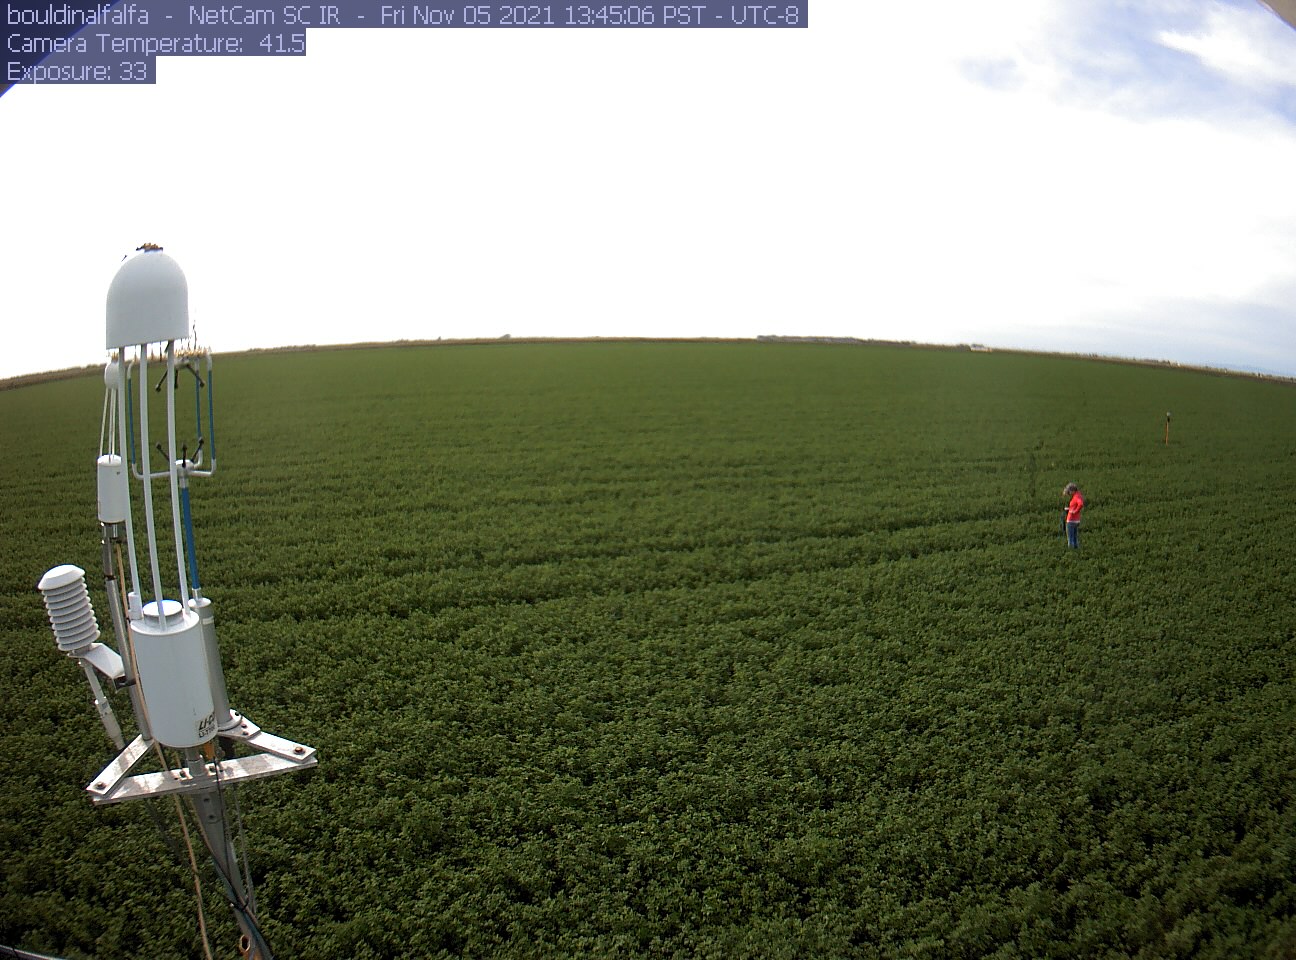
bouldinalfalfa_2021_11_05_134506.jpg ( 2021-11-05 14:46:28 ) Full size: 1296x960
Someone doing fieldwork
7 sets found
5 BA_flux graphs found
21 BA_met graphs found
6 BA_arable graphs found
Can't check TATWBABCSB_cam
Can't check MBSWEEWPBCBA
2 BA_processed graphs found
No data found for BA_adex.