
Field Notes
<--2021-10-21 10:30:00 | 2021-11-18 15:15:00-->Other sites visited today: Bouldin Corn | Bouldin Alfalfa | Hill Slough
Phenocam link: Searching...
Gilbert Tract: 2021-11-05 16:40:00 (DOY 309)
Author: Daphne Szutu
Others: Robert, Vona, Christine
Summary: Regular data collection/cleaning, visitors from Knightsen school district, extended cable on eosGP and water level sensors
| 2021-11-05 Gilbert Tract Robert, Vona, Christine, and I arrived at 16:40 PDT. We had originally planned to meet Dennis and some visitors from Knightsen school district at 16:00 to talk about potential outreach activities. They were just finishing up their tour as we arrived. At the tower, it was cool and breezy and close to high tide. The water under the tower was about ankle deep, so we all needed boots to access the tower. We had an atmospheric river last weekend that delivered about 8 cm of rain and sustained winds: the 30-min wind speed was 5m/s for about 12 hours (less wind and rain here than on Bouldin Island). The tower and instruments looked ok. I downloaded met, cam and USG GHG files. I downloaded the miniDOT data but didn't change the desiccant this time. I added about 2m of chain to the miniDOT -- might need to add more. Vona put on waders and helped me lengthen the cable of 2 water sensors (eosGP and Campbell water level sensor). She pounded a post in by the well and attached a small plastic enclosure with a screw terminal inside. The screw terminal was wired on one side to an extension cable that I would connect at the main datalogger box. I unwired the eosGP and the water level sensor from the main datalogger box, and Vona wired those sensors into the screw terminal and attached the usual desiccant to the water level sensor tube. Because the eosGP sensor already had a short extension cable spliced on, she coiled the excess cable near the top of the post so it wouldn't get wet. Vona carried the eosGP and water level sensor from near the well as far out as the cables would allow and placed the sensors into the water, laying on the ground. We gained about 4m additional distnace from the well. We did not move the well. Hopefully the sensors will stay underwater at low tide at this location. I wired the extension cable to the mux and checked the data, which looked reasonable. We did not lengthen the conductivity sensor today because its data depends on the cable length. We'll either need to buy a sensor with a longer cable or extend this sensor's cable and calibrate it. Robert and Christine cleaned flux and rad sensors. We topped off the wash reservoir. CO2 424ppm H2O 456ppm T 15.8C P 101.0kPa SS 100 after cleaning LI7700 readings: CH4 2.0ppm RSSI 86 after cleaning We left at 18:00 PDT. |
5 photos found

20211104GT_Corrosion.jpg ( 2021-11-05 17:31:27 ) Full size: 1440x1920
Some corrosion already on the copper screen covering the miniDOT
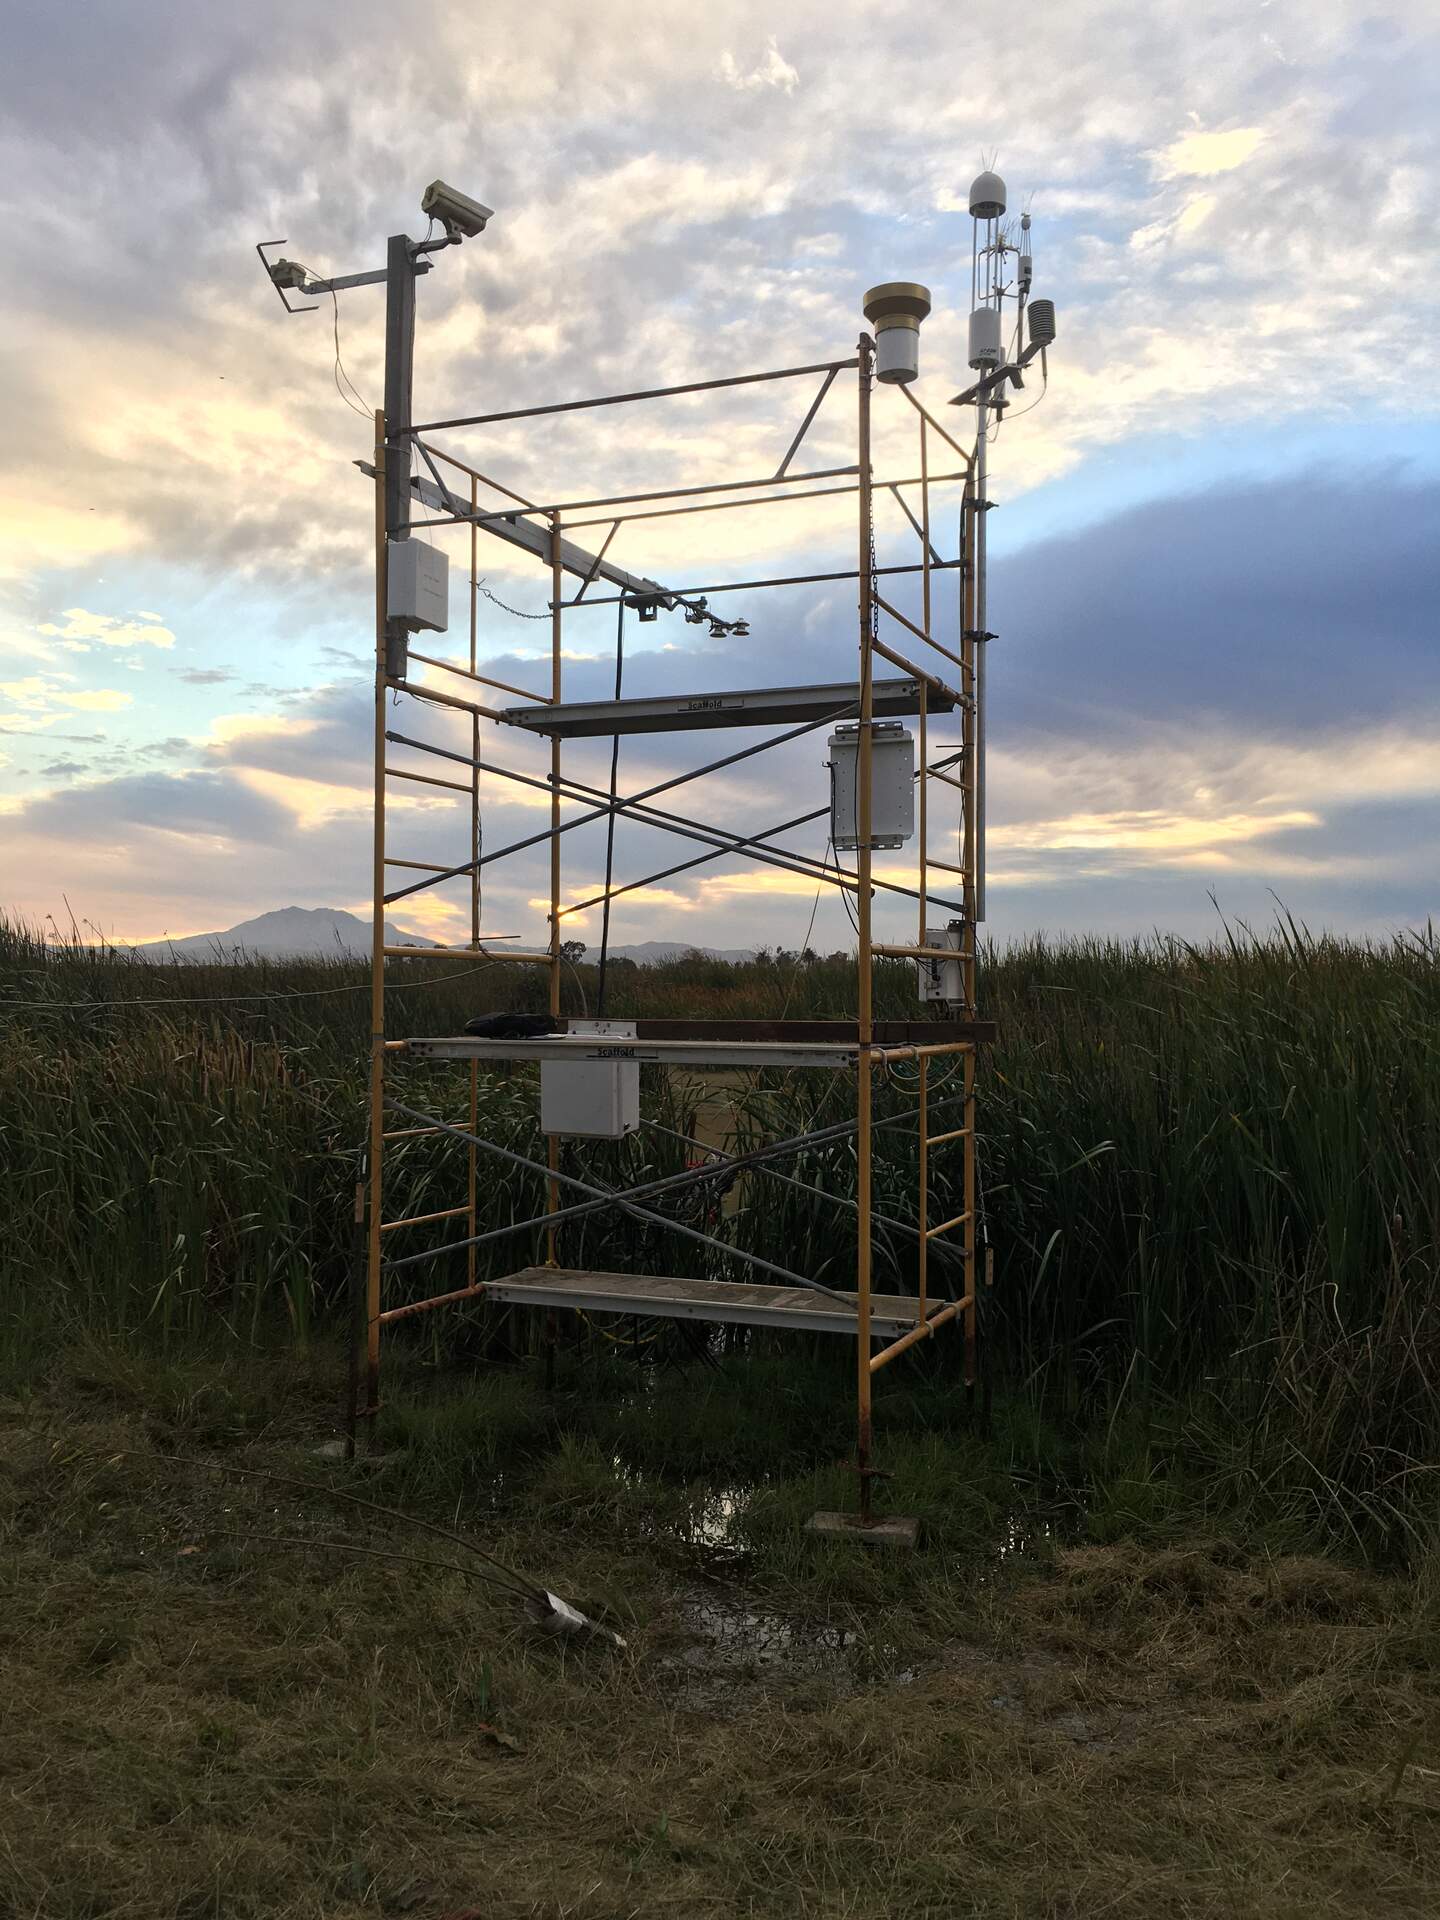
20211105GT_TowerHighTide.jpg ( 2021-11-05 17:41:54 ) Full size: 1440x1920
Tower near high tide--need boots to access the scaffolding

20211105GT_FluxVona.jpg ( 2021-11-05 17:01:20 ) Full size: 1920x1440
Vona working in the wetland with Mt. Diablo in the background
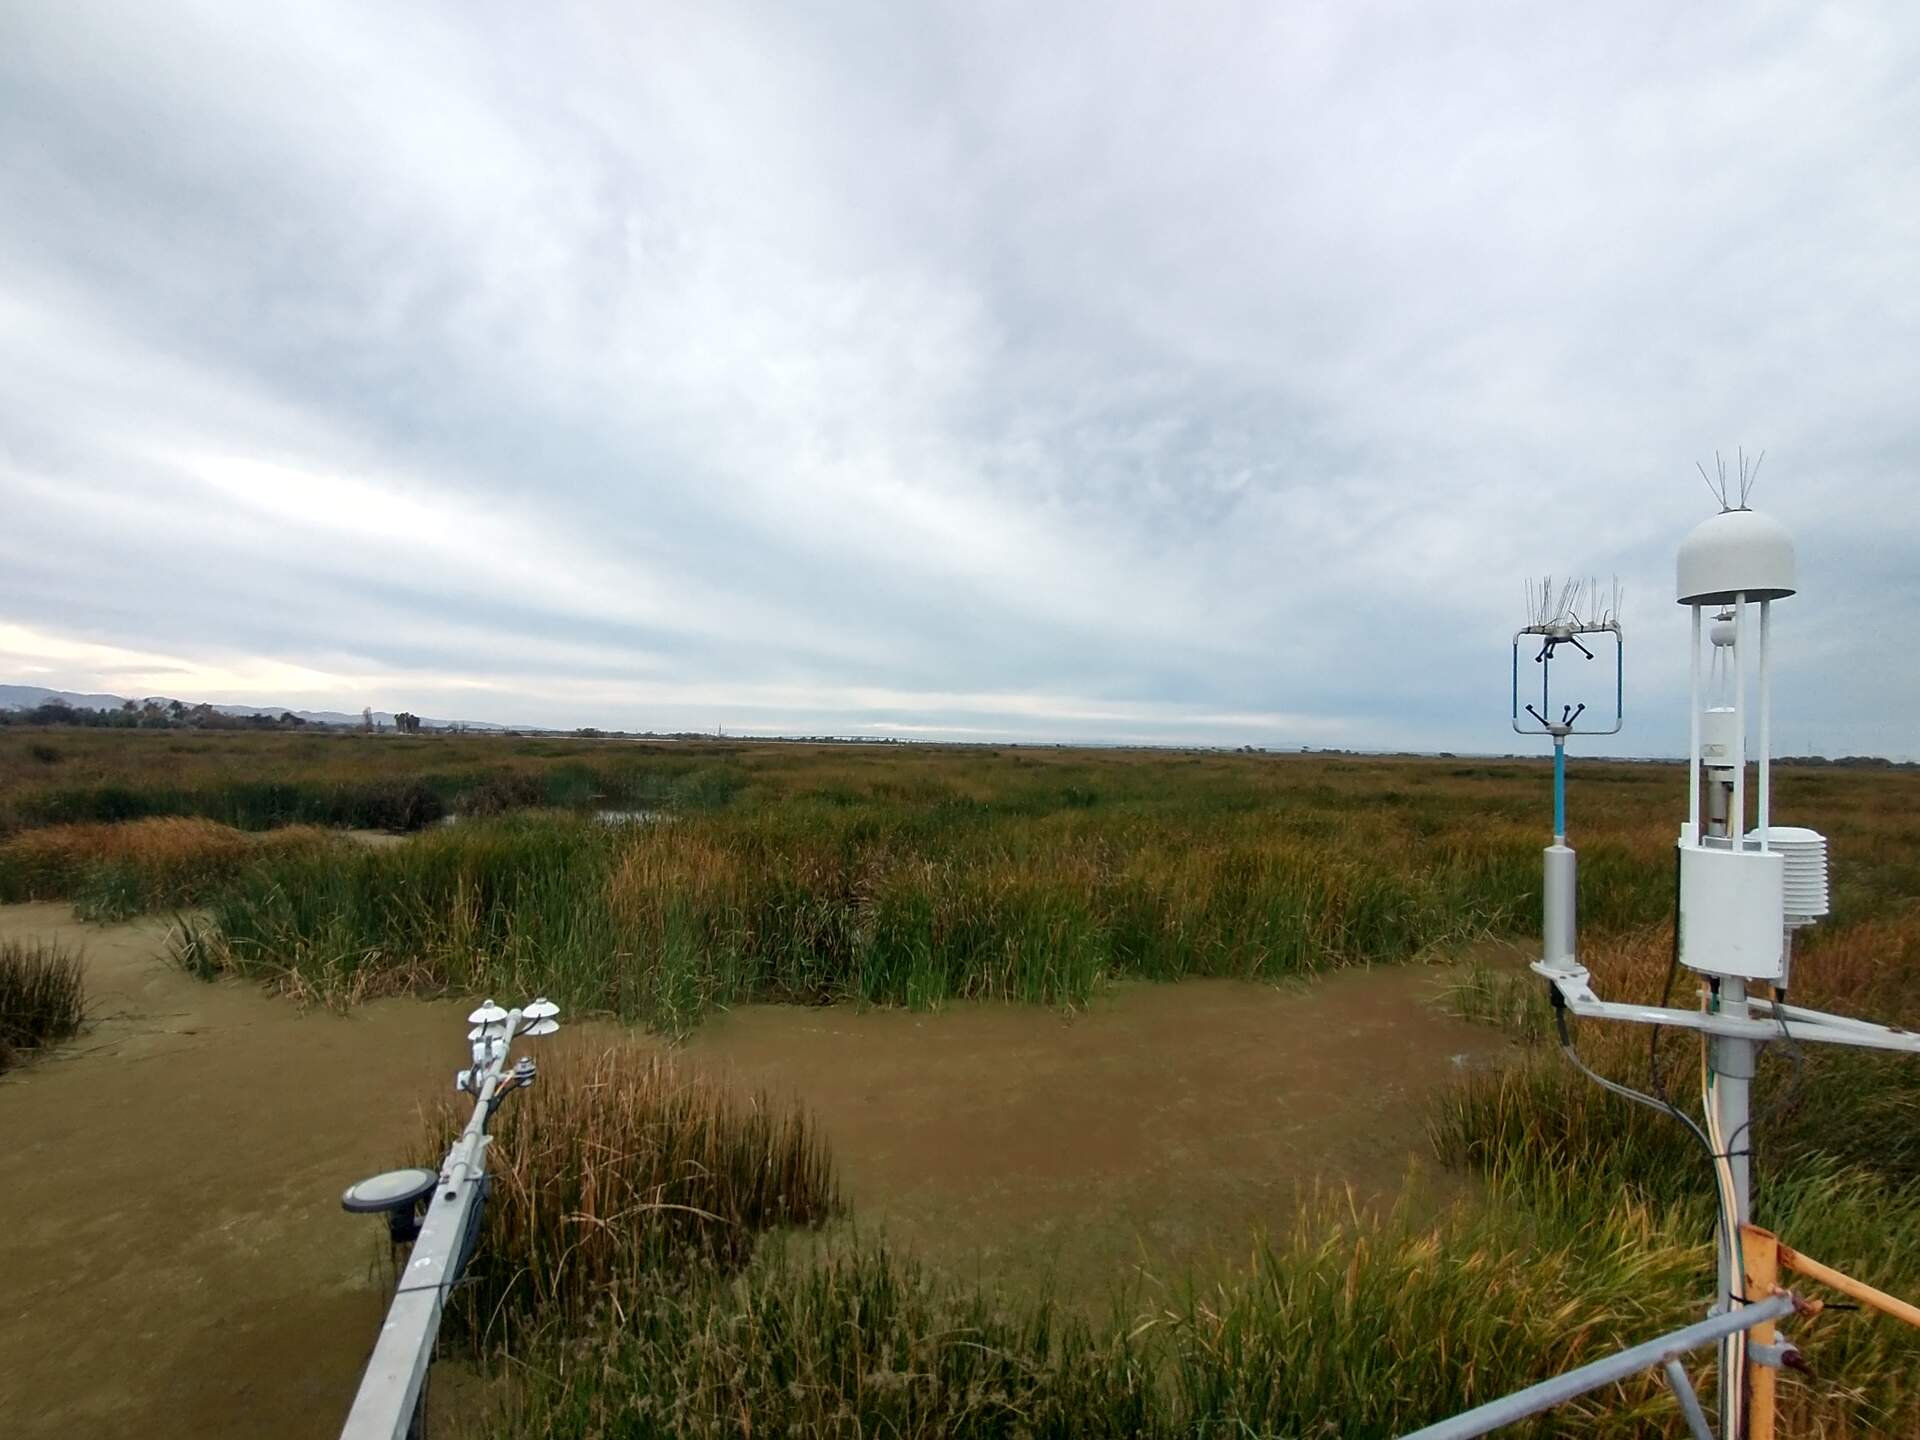
20211105GT_Sensors.jpg ( 2021-11-05 16:59:26 ) Full size: 1920x1440
Gilbert Tract on an overcast fall day. Water level is close to high tide.
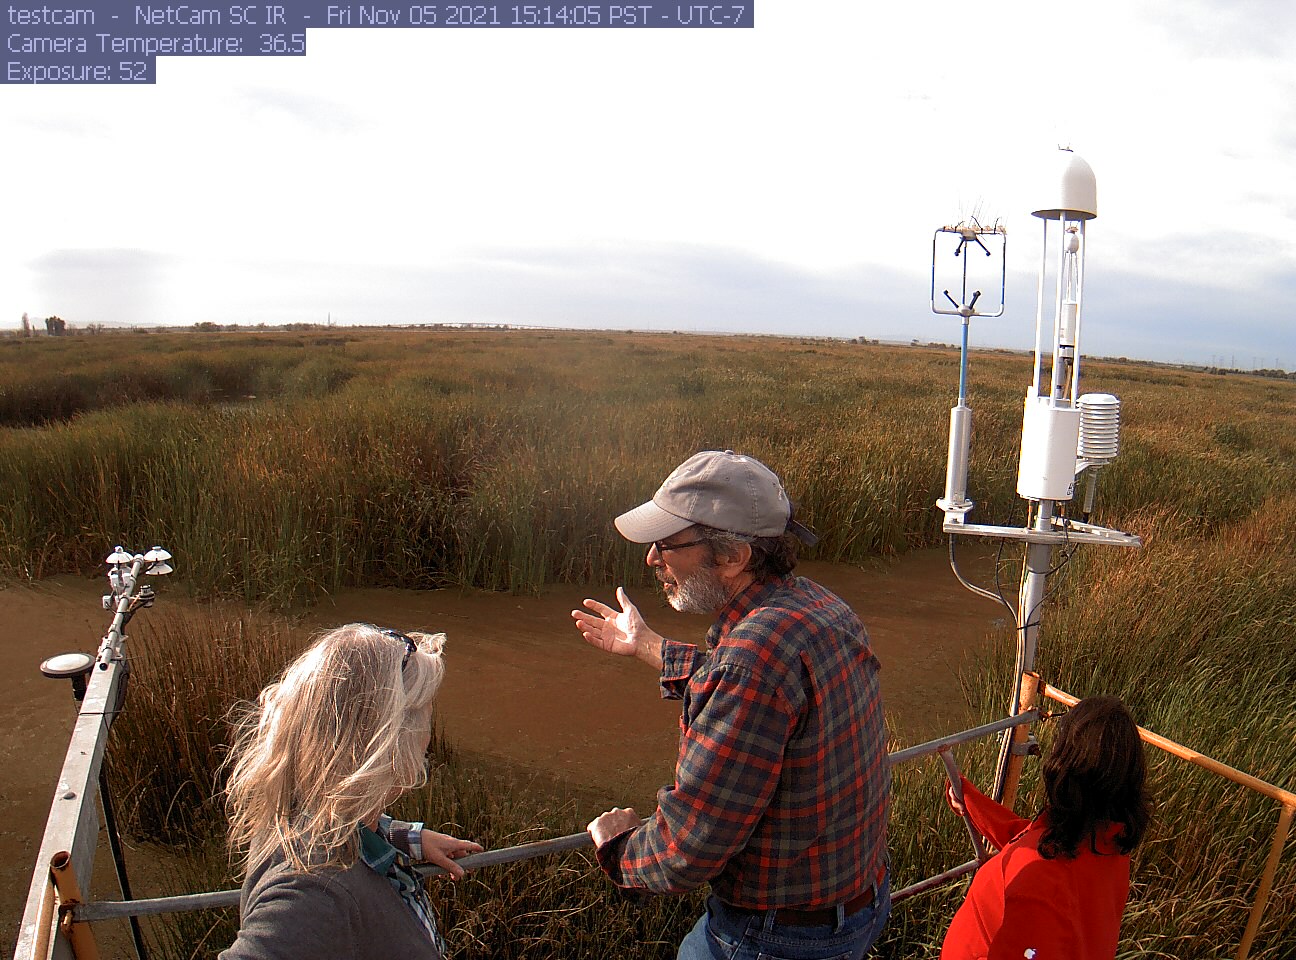
gilberttract_2021_11_05_151405.jpg ( 2021-11-05 16:15:20 ) Full size: 1296x960
Dennis having a meeting
8 sets found
Can't check MBWPEESWGT_mixed
Can't check MBEEWPSWEPGT_cam
16 GT_met graphs found
4 GT_flux graphs found
No data found for GT_adcp.
1 GT_cam graphs found
2 GT_usgs graphs found
2 GT_chanexo graphs found