
Field Notes
<--2021-11-04 09:45:00 | 2021-11-18 08:30:00-->Other sites visited today: Bouldin Corn | Bouldin Alfalfa | Gilbert Tract
Phenocam link: Searching...
Hill Slough: 2021-11-05 00:00:00 (DOY 309)
Author: Daphne Szutu
Others:
Summary: Breaches complete
| Copied from e-mails from Aaron and Brett: There are 5 breaches on the west side. All west side work is complete as of end of the day last Friday [Friday, 2021-11-05]. Excavators were scheduled to be moved to the east side yesterday [Saturday, 2021-11-06]. It took roughly 2.5 days for each breach. So in the initial water level data, we were seeing muted tidal conditions. As the contractor was able to open up the levee more and more with each breach, we can slowly see a full tidal range come into the site. (There were some equipment problems that slowed things down) |
6 photos found

20211104HS_HighTide.jpg ( 2021-11-04 10:47:36 ) Full size: 1920x1440
Hill Slough site near high tide

20211104HS_WaterSensors.jpg ( 2021-11-04 10:34:38 ) Full size: 1440x1920
Dissolved CO2 sensor (eosGP) and miniDOT sensor deployed under the boardwalk at Hill Slough

HS_picam_20211104_1215.jpg ( 2021-11-04 12:15:05 ) Full size: 1917x1440
Clouds reflected in the water

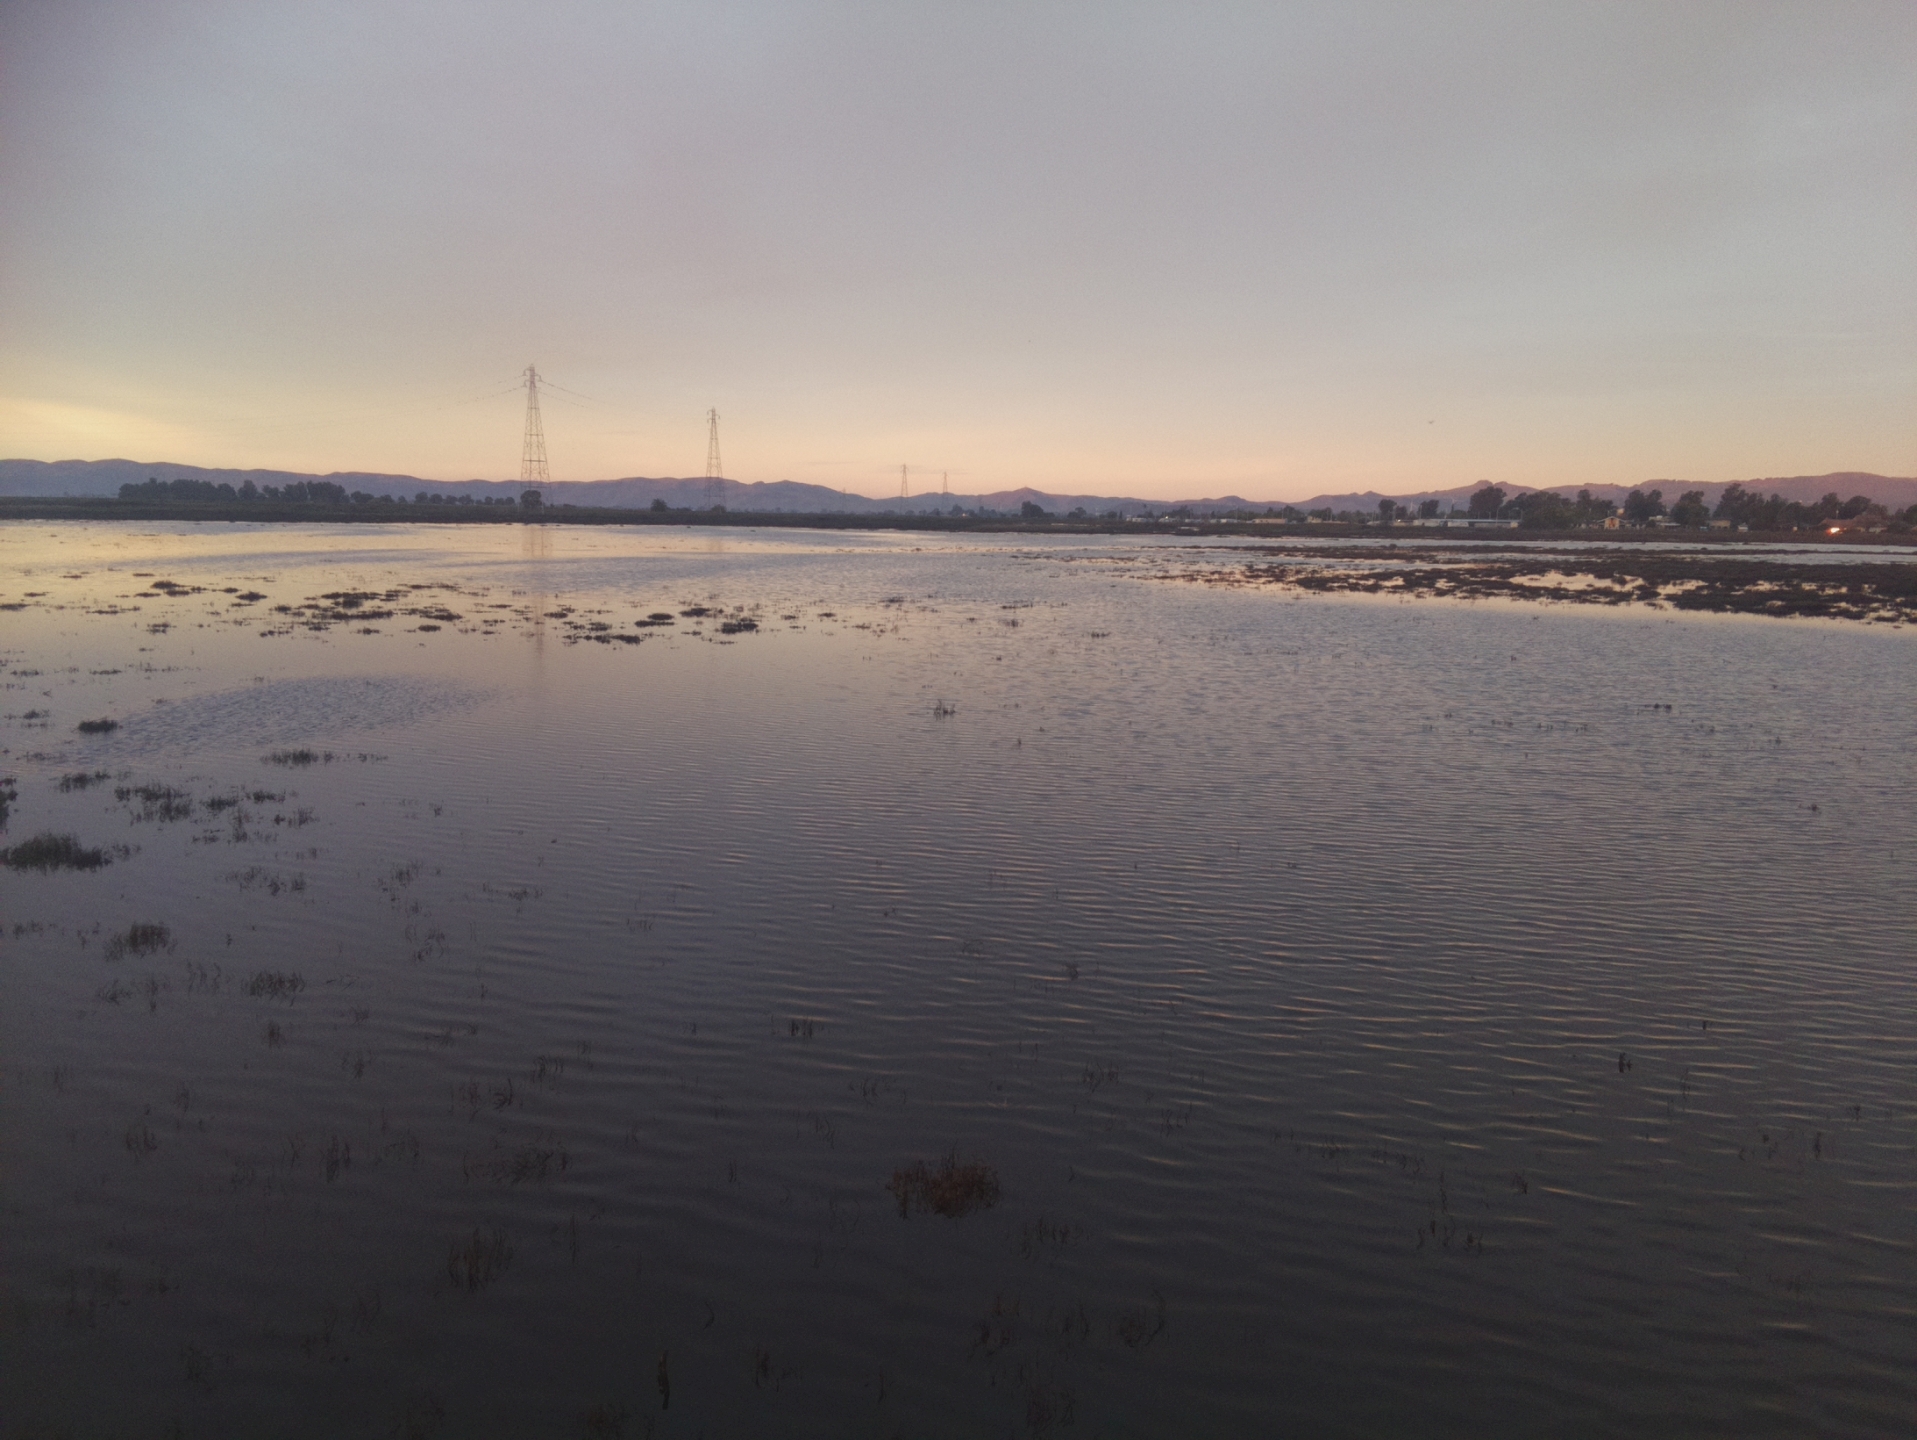
HS_picam_20211105_0645.jpg ( 2021-11-05 06:45:05 ) Full size: 1917x1440
Dawn at mid tide
HS_picam_20211106_0645.jpg ( 2021-11-06 06:45:05 ) Full size: 1917x1440
Dawn at high tide

HS_picam_20211106_1315.jpg ( 2021-11-06 13:15:06 ) Full size: 1917x1440
Nice sky reflected in the water
4 sets found
21 HS_met graphs found
4 HS_flux graphs found
1 HS_cam graphs found
Can't check HS_Processed
2 HS_Processed graphs found