
Field Notes
<--2021-10-05 08:00:00 | 2021-10-26 09:30:00-->Other sites visited today: Vaira | Tonzi
Phenocam link: Searching...
Hill Slough: 2021-10-06 17:45:00 (DOY 279)
Author: Joe Verfaillie
Others:
Summary: First visit since levee breech - less than impressive, ditch full and some standing water far upwind. FD data not collected.
| Hill Slough 2021-10-06 I arrived at about 17:45 PDT. It was cool but not super windy. The first levee breech occurred this week. High tide was about 15:00 today. The ditch next to the road was full to the brim and there was some standing water far to the southwest of the tower, but no evidence of water having inundated the area around the tower itself. I did a quick check and data download to help shorten Daphne’s day in the field tomorrow. The 7500 read: 414.1ppm CO2, 427.0mmol/m3 H2O, 101.5kPa, 18.7C, 98.6SS – 99.8 after cleaning The 7700 read: 1.94ppm CH4, 35.3RSSI – 72.7 after cleaning The wash reservoir was full and the box was full of wasps. I left the lid open to discourage their congregations. I cleaned the radiometers – they were pretty dirty from bird feet. I collected met, flux and the pi-cam images. I didn’t have a cable for the FD chamber so that will have to wait until next time. I left at about 18:15 PDT |
2 photos found
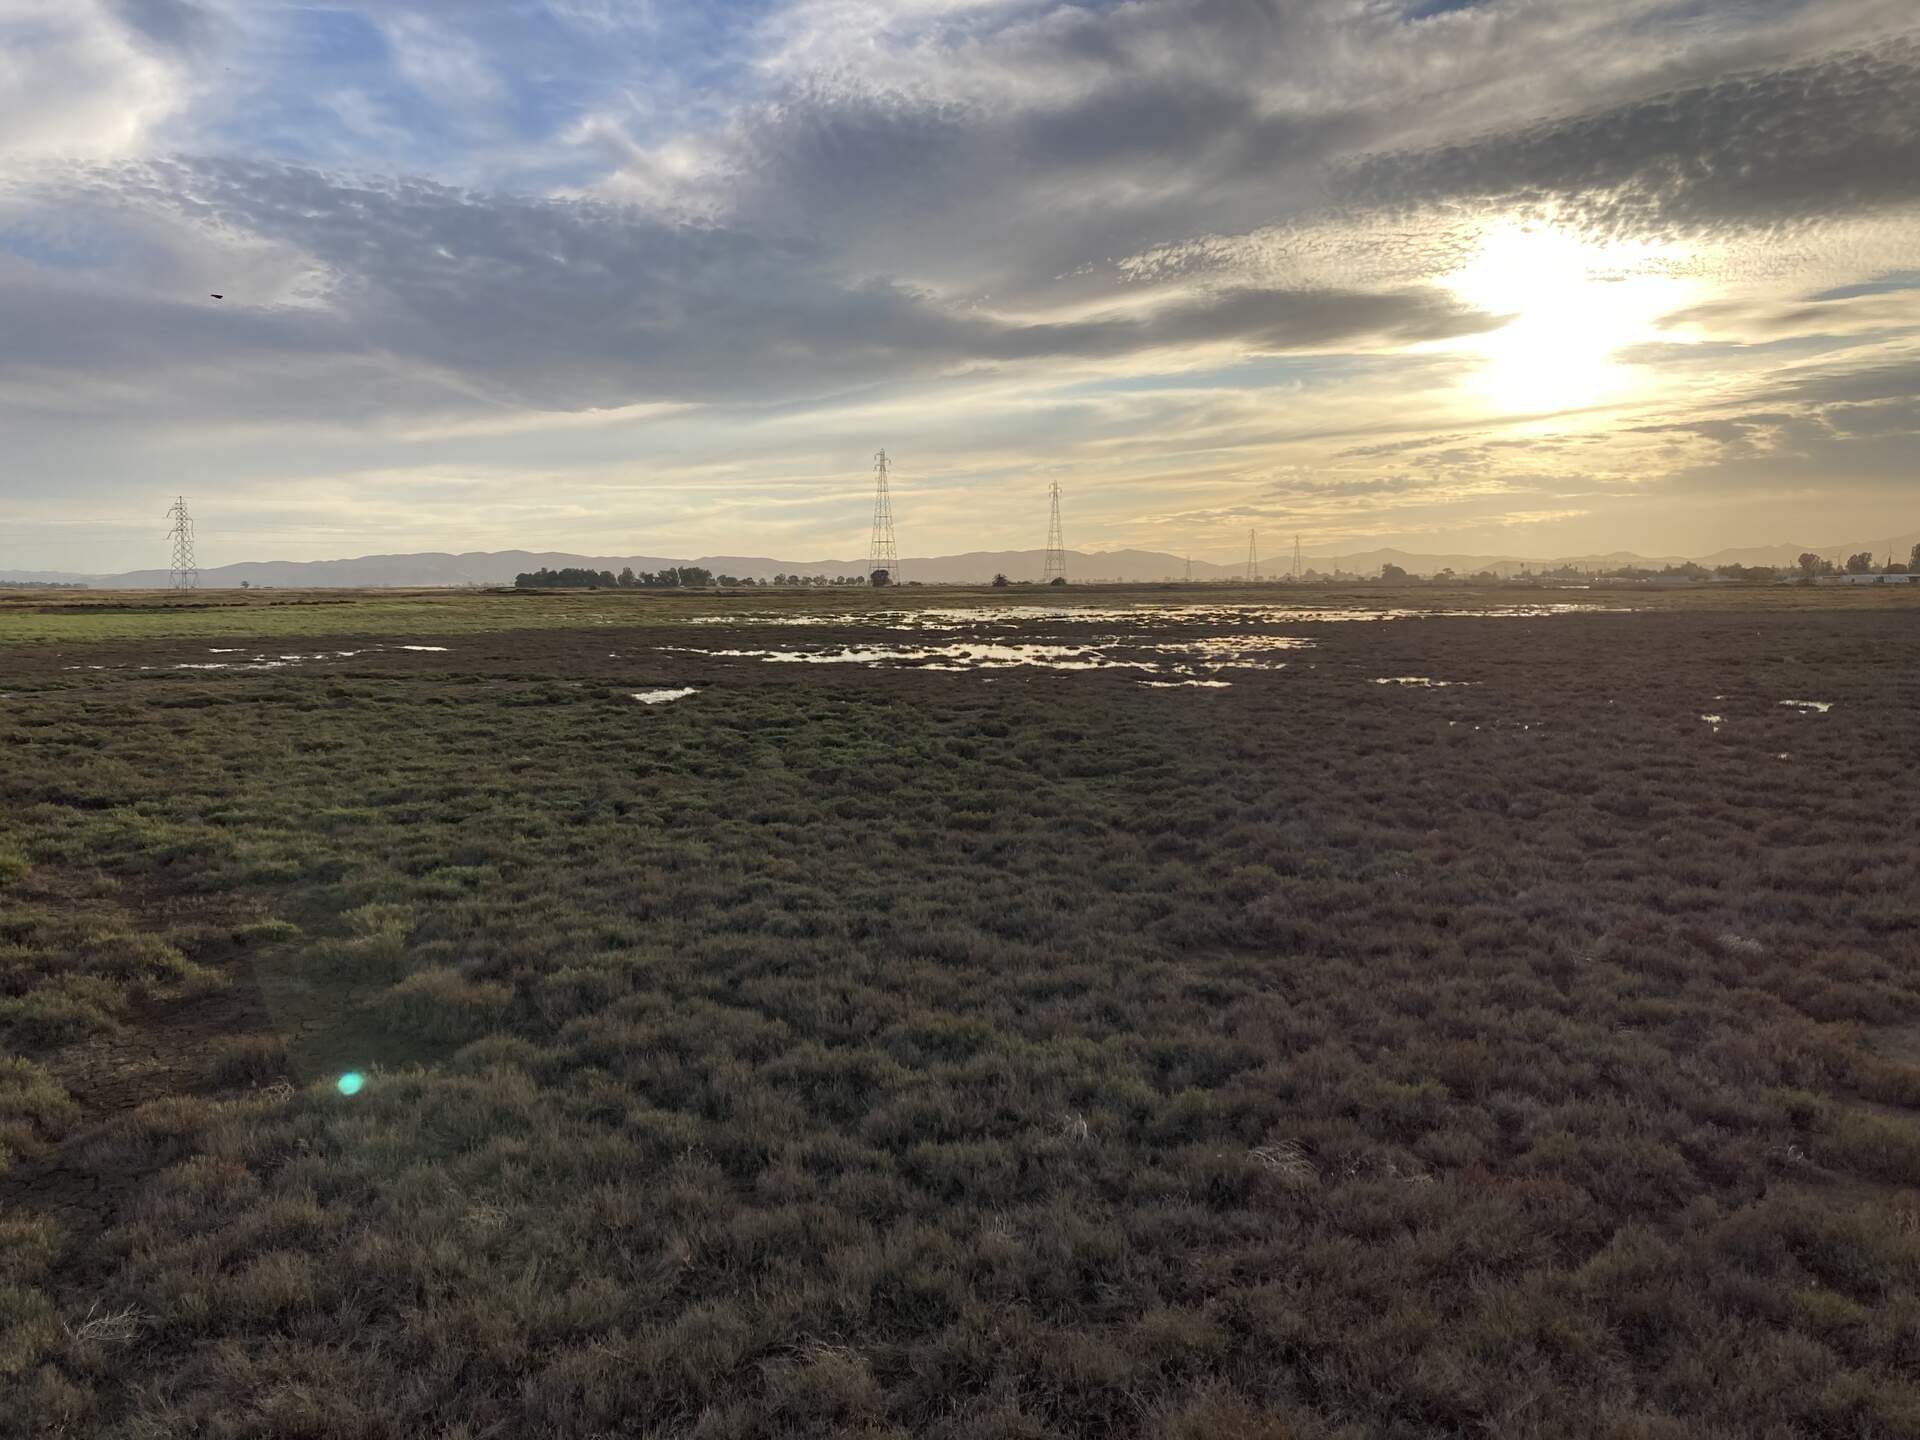
20211006HS_TidalFlooding.jpg ( 2021-10-06 17:57:56 ) Full size: 1920x1440
Some standing water from high tide visible in the footprint of the tower.

20211006HS_DitchFull.jpg ( 2021-10-06 17:58:19 ) Full size: 1920x1046
The ditch along the road is full to the brim with high tide
4 sets found
21 HS_met graphs found
4 HS_flux graphs found
1 HS_cam graphs found
Can't check HS_Processed
2 HS_Processed graphs found