
Field Notes
<--2021-05-26 10:00:00 | 2021-06-16 14:00:00-->Other sites visited today: Sherman Wetland | Mayberry | East End | West Pond | Bouldin Alfalfa | Bouldin Corn
Phenocam link: Searching...
Hill Slough: 2021-06-09 17:30:00 (DOY 160)
Author: Daphne Szutu
Others: Ariane
Summary: Regular data collection/cleaning, super duper windy, measured sonic/eddy orientation, swapped 7500 for calibration, installed rad cal kit, changed eddy clock +1min
| 2021-06-09 Hill Slough Ariane and I arrived at 17:30 PDT. It was super duper mega windy. The gusts on the upper boardwalk would occasionally make us lose our balance so we had to hook our arms around the upper railing to feel steady. A quick check of the 20Hz data told me that average wind speed was 10-12 m/s (22-26 mph) with gusts up to 18 m/s (40 mph). The wind was making the rotating shadowband vibrate a lot as it was spinning. If I had known it would be this windy, I probably would have gone home after Bouldin Island and come back to this site the next morning when it was calmer. Ari made some measurements of the eddy sensors using her phone compass. Sonic orientation = 5deg N Sonic toward 7500 direction = 326deg N Sonic towards 7700 direction = 6deg N I downloaded met, camera, and USB GHG data. I downloaded and cleared the FD chamber. Ari cleaned flux and rad sensors. I swapped out the desiccant for the water level sensor but I didn’t have quite enough loose desiccant, so the tube is only 2/3 full. We swapped the LI-7500 for calibration: sn 75H-2180 came off and sn 75H-2667 went on the tower. I uploaded a new configuration file and updated the pressure coefficients. I changed the 7550 clock +1 or +2 min to match the laptop time. I reset the 7550 and checked that the USB was logging, the 7700 was connected, and the clock was still good. LI-7500 readings (sn 75H-2180--> sn 75H-2180 clean --> sn 75H-2667): CO2 397ppm --> 410 --> 413 H2O 490ppm --> 390 --> 370 T 18.6C --> 19.0 --> 18.2 P 102.2kPa --> 102.2 --> 102.1 SS 97--> 99--> 101 LI7700 readings: CH4 1.93ppm RSSI 42--> 69 after cleaning We put up the cal kit from BC on the radiometer boom here to check the rad sensors. I powered the datalogger but the laptop had run out of battery so I couldn’t check the numbers. I screwed the datalogger enclosure into the upper boardwalk and secured the cables with zip ties. CR1000 sn 23865 CNR4 sn 121038 PAR sn 060831 NDVI in sn 1049 NDVI out sn 1050 We left at 19:00 PDT. |
1 photos found
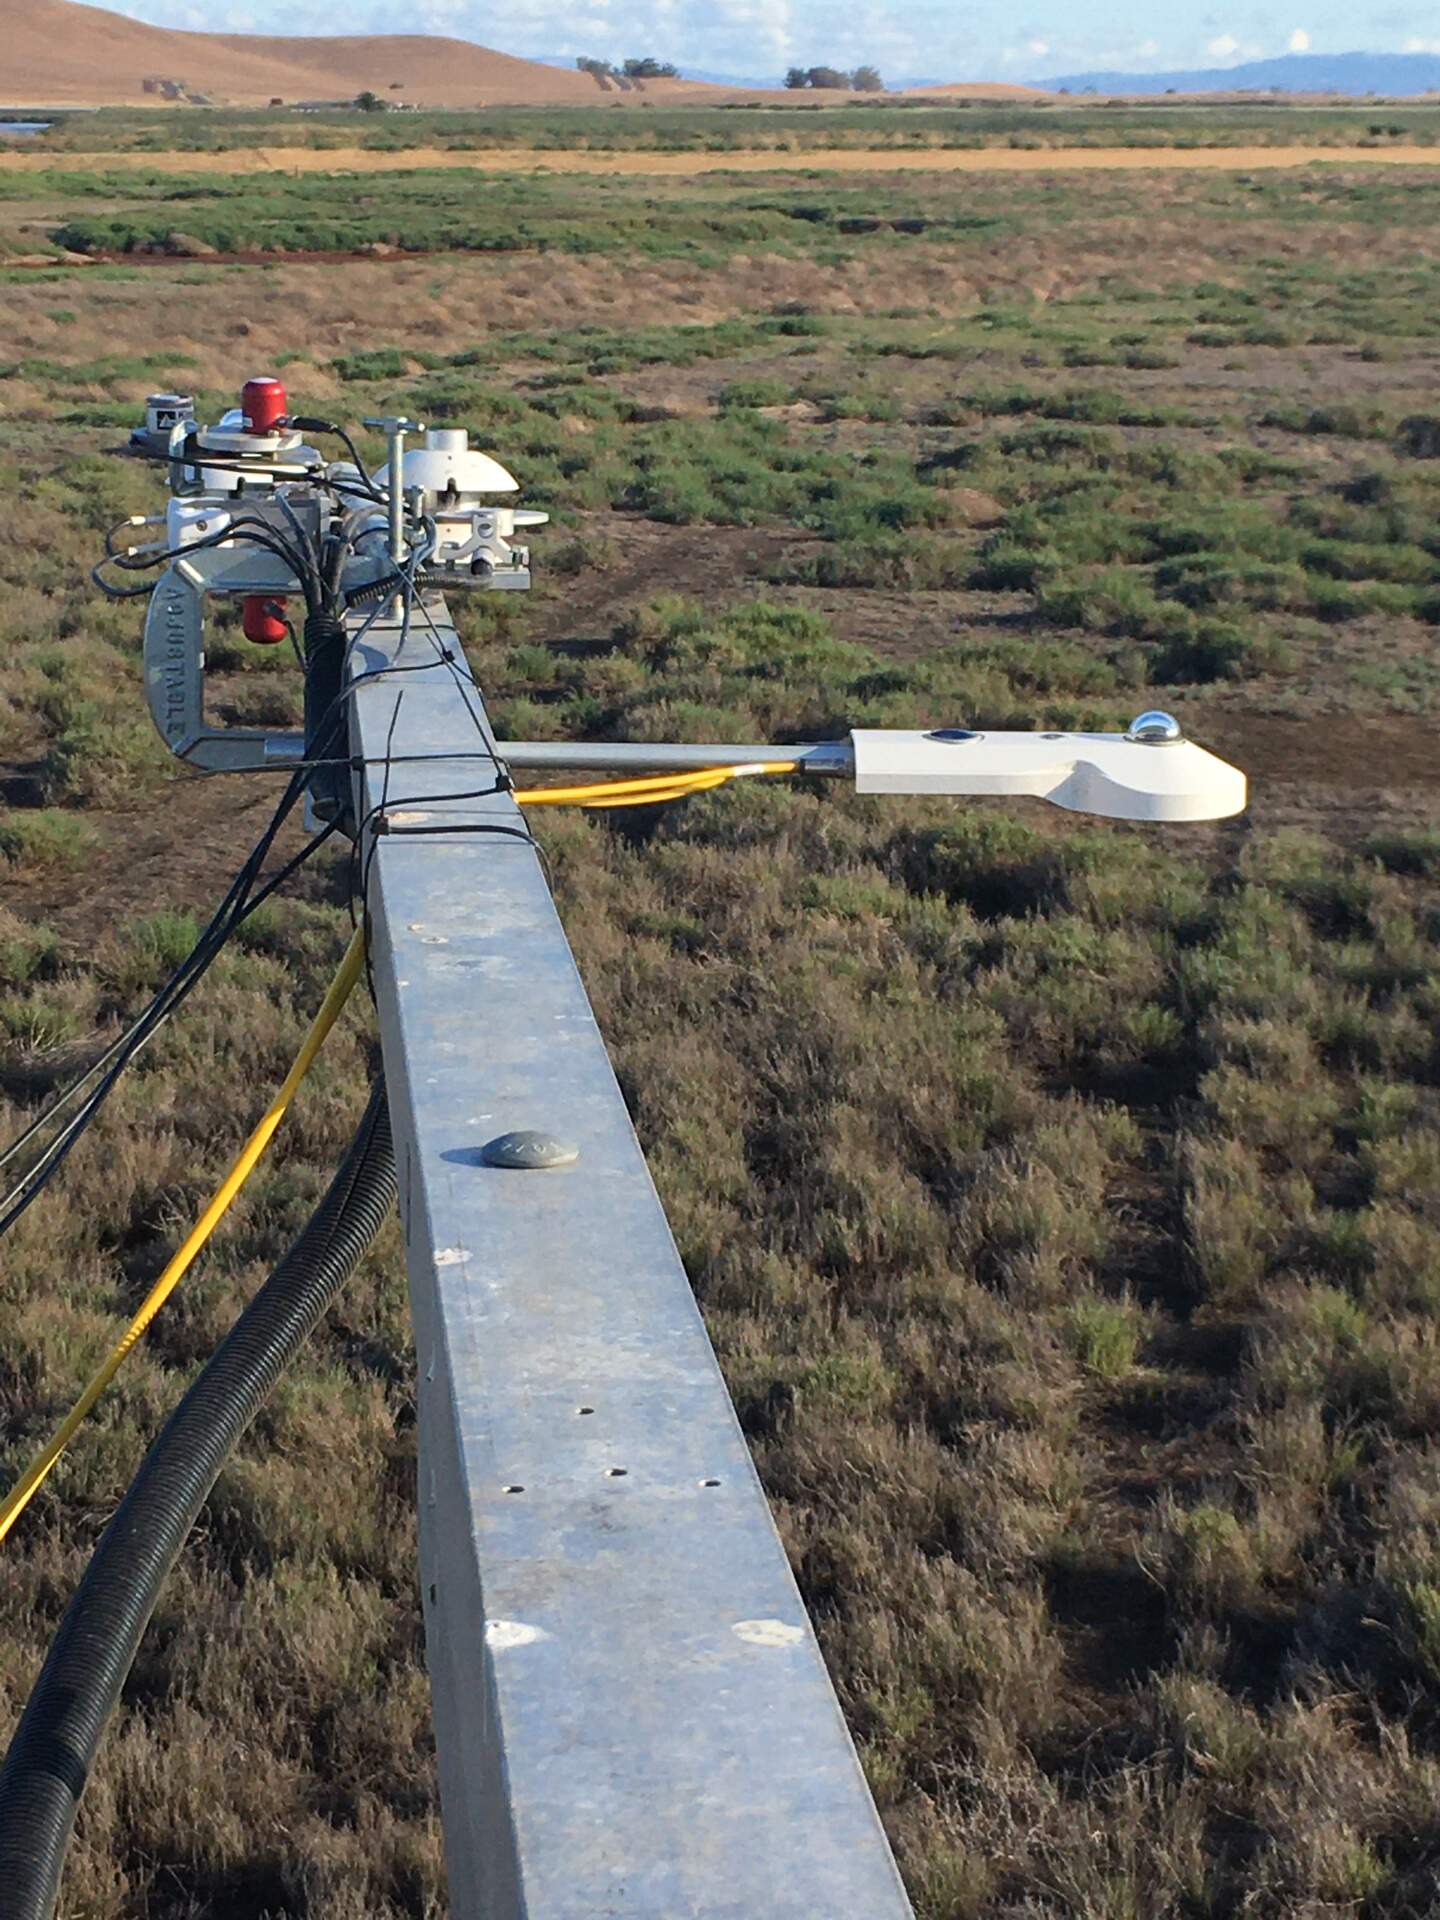
20210609HS_RadCalKit.jpg ( 2021-06-09 18:45:36 ) Full size: 1440x1920
Radiometer calibration kit installed on Hill Slough rad boom (4-way radiometer, Apogee NDVI pair, PAR). Note high winds blowing the loose cables sideways.
4 sets found
21 HS_met graphs found
4 HS_flux graphs found
1 HS_cam graphs found
Can't check HS_Processed
2 HS_Processed graphs found