
Field Notes
<--2021-06-02 10:00:00 | 2021-06-16 09:15:00-->Other sites visited today: Sherman Wetland | Mayberry | East End | West Pond | Bouldin Alfalfa | Hill Slough
Phenocam link: Searching...
Bouldin Corn: 2021-06-09 14:20:00 (DOY 160)
Author: Daphne Szutu
Others: Ariane
Summary: Regular data collection/cleaning, super windy, laptop ate dirt, dug new well, downloaded zcams, downloaded and removed rad cal kit, swapped 7500 for calibration, changed eddy clock +1min
| 2021-06-09 Bouldin Corn Ariane and I arrived at 14:20 PDT. It was super windy with a few clouds in the sky. The corn is about torso height, about the height of Tyler’s flagging tape tied between poles. Farmers have dug the spud ditches and put in furrows. Ari took veg height measurements and dug a new well for the water sensor. Top of well to ground: 49cm Top of well to sensor: 122cm I downloaded met, camera, and USB GHG data. Some of the mux sensors had NANs last time, but they all seem ok now after I replugged the mux blocks. This time however, dfPAR had NANs. I downloaded and cleared the FD chamber. I downloaded PA data and power-cycled the sensor. I downloaded the zcam data and cleared their memories. The picam times were off again—I think one was 6min fast and the other was 9min fast. I didn’t change the clocks today; it was getting late and I want to see if they continue drifting. However, looking at the data back in the lab, I think the clock offset is large enough to impact the quality of the upward-looking cameras. Some of the evening photos still have the sun in them, making it harder to distinguish leaf from sky. As I was downloading data, the laptop was blown off from the top of the datalogger box and fell to the soil below. I think it’s ok except for a few grains of soil stuck in the keyboard that I mostly shook out. I was using the new USB-ethernet dongle and the dongle remained firmly in its USB port. Ari cleaned the flux and rad sensors. The reservoir was 1/3 empty; we refilled it. I changed the desiccant for the water level sensor. Finally, I downloaded the intercomparison data. We removed the datalogger and cal sensors from the radiometer boom so we could put them up at Hill Slough. CR1000 sn 23865 CNR4 sn 121038 PAR sn 060831 NDVI in sn 1049 NDVI out sn 1050 We also swapped the LI-7500 for calibration: sn 75H-2514 came off and sn 75H-2150 went on the tower. I uploaded a new configuration file and updated the pressure coefficients. I changed the 7550 clock from 13:34 to 13:35 to match the laptop time. I reset the 7550 and checked that the USB was logging, the 7700 was connected, and the clock was still good. LI-7500 readings (sn 75H-2514 --> sn 75H-2514 clean --> sn 75H-2150): CO2 390ppm --> 401 --> 412 H2O 490ppm --> 496 --> 405 T 21.6C --> 21.0 --> 21.3 P 101.8kPa --> 101.8 --> 101.8 SS 98--> 101--> 101 LI7700 readings: CH4 1.94ppm RSSI 42--> 73 after cleaning We left at 15:40 PDT. |
Veg Height (cm): Tape measure from ground to top of plant
80, 86, 100, 85, 90, 83, 74, 89, 85, 99, avg = 87.1, stdev = 7.95
1 photos found
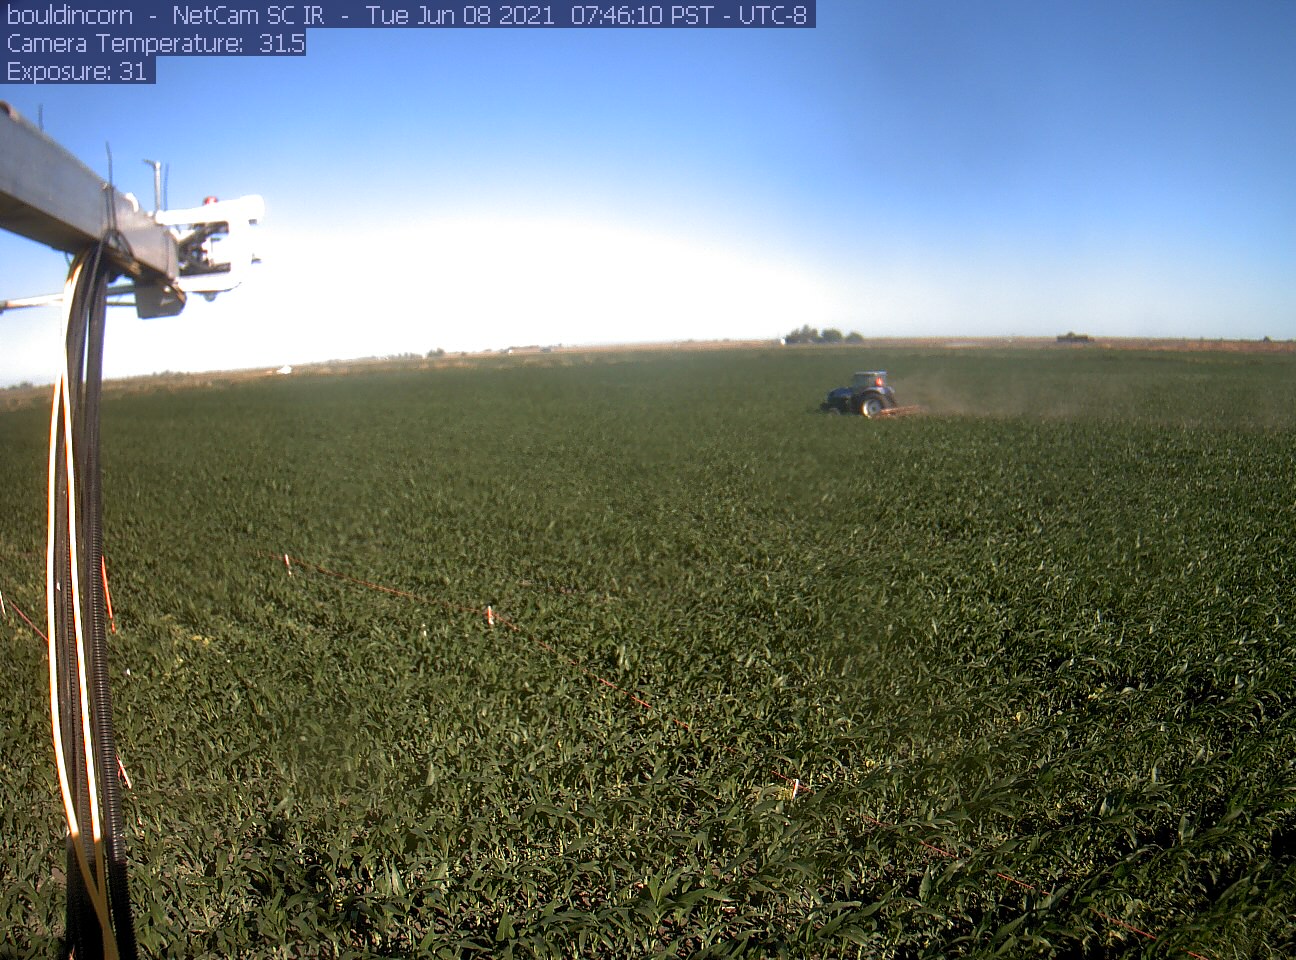
bouldincorn_2021_06_08_074505.jpg ( 2021-06-08 07:47:14 ) Full size: 1296x960
Tractor digging spud ditches?
6 sets found
17 BC_met graphs found
5 BC_flux graphs found
Can't check TATWBABCSB_cam
Can't check MBSWEEWPBCBA
2 BC_pa graphs found
1 BC_arable graphs found