
Field Notes
<--2021-06-09 17:30:00 | 2021-06-22 10:20:00-->Other sites visited today: Mayberry | Bouldin Corn | Bouldin Alfalfa
Phenocam link: Searching...
Hill Slough: 2021-06-16 14:00:00 (DOY 167)
Author: Joe Verfaillie
Others: Daphne
Summary: Set pi-cams locale and time, checked on cal kit, moved cal PAR from incoming to outgoing, checked on TC1 - still needs love
| Hill Slough 2021-06-16 Daphne and I arrived at 14:00. It was clear hot and sunny and, for once, it was not windy at all! The road work seems complete and it is easy to drive off the side of the road and park at the beginning of our boardwalk. Seems like it was low tide – the water in the ditch by the road was about a meter below the high water mark on the boardwalk posts. The pickle weed near the ditch is bright green but most of the site is still just a dull green with some brighter patches where the ground is higher and grassier. TC1 has had some NaNs. Daphne checked that the wiring was solid at the AM25T. Maybe a bad connection on the other end. TC1 I think should be above ground and maybe not too hard to repair? We checked on the cal kit that was set up blindly last time as the computer battery had run down. It seemed fine though so we moved the Ameriflux PAR sn 060831 from the incoming position to the reflected position. We downloaded the pi-cam images and tried to set its clock over SSH but got an “invalid time†error. This is because the pi comes from Great Britain and its locale is set as such which doesn’t jive with our time formats and keyboard. The pi has a gui to set its locale called raspi-config but using that doesn’t seem to work. Instead we create a file: /etc/environment And add the lines: LC_ALL=en_US.UTF-8 LANG=en_US.UTF-8 And reboot. Then you can use sudo date -s followed by the new date time string in quotes to set the time. I might be able to build that into the pi-cam web interface too. We ended up setting the pi-cam clock from 13:41 to 13:34 PST. We left at 14:40 |
1 photos found
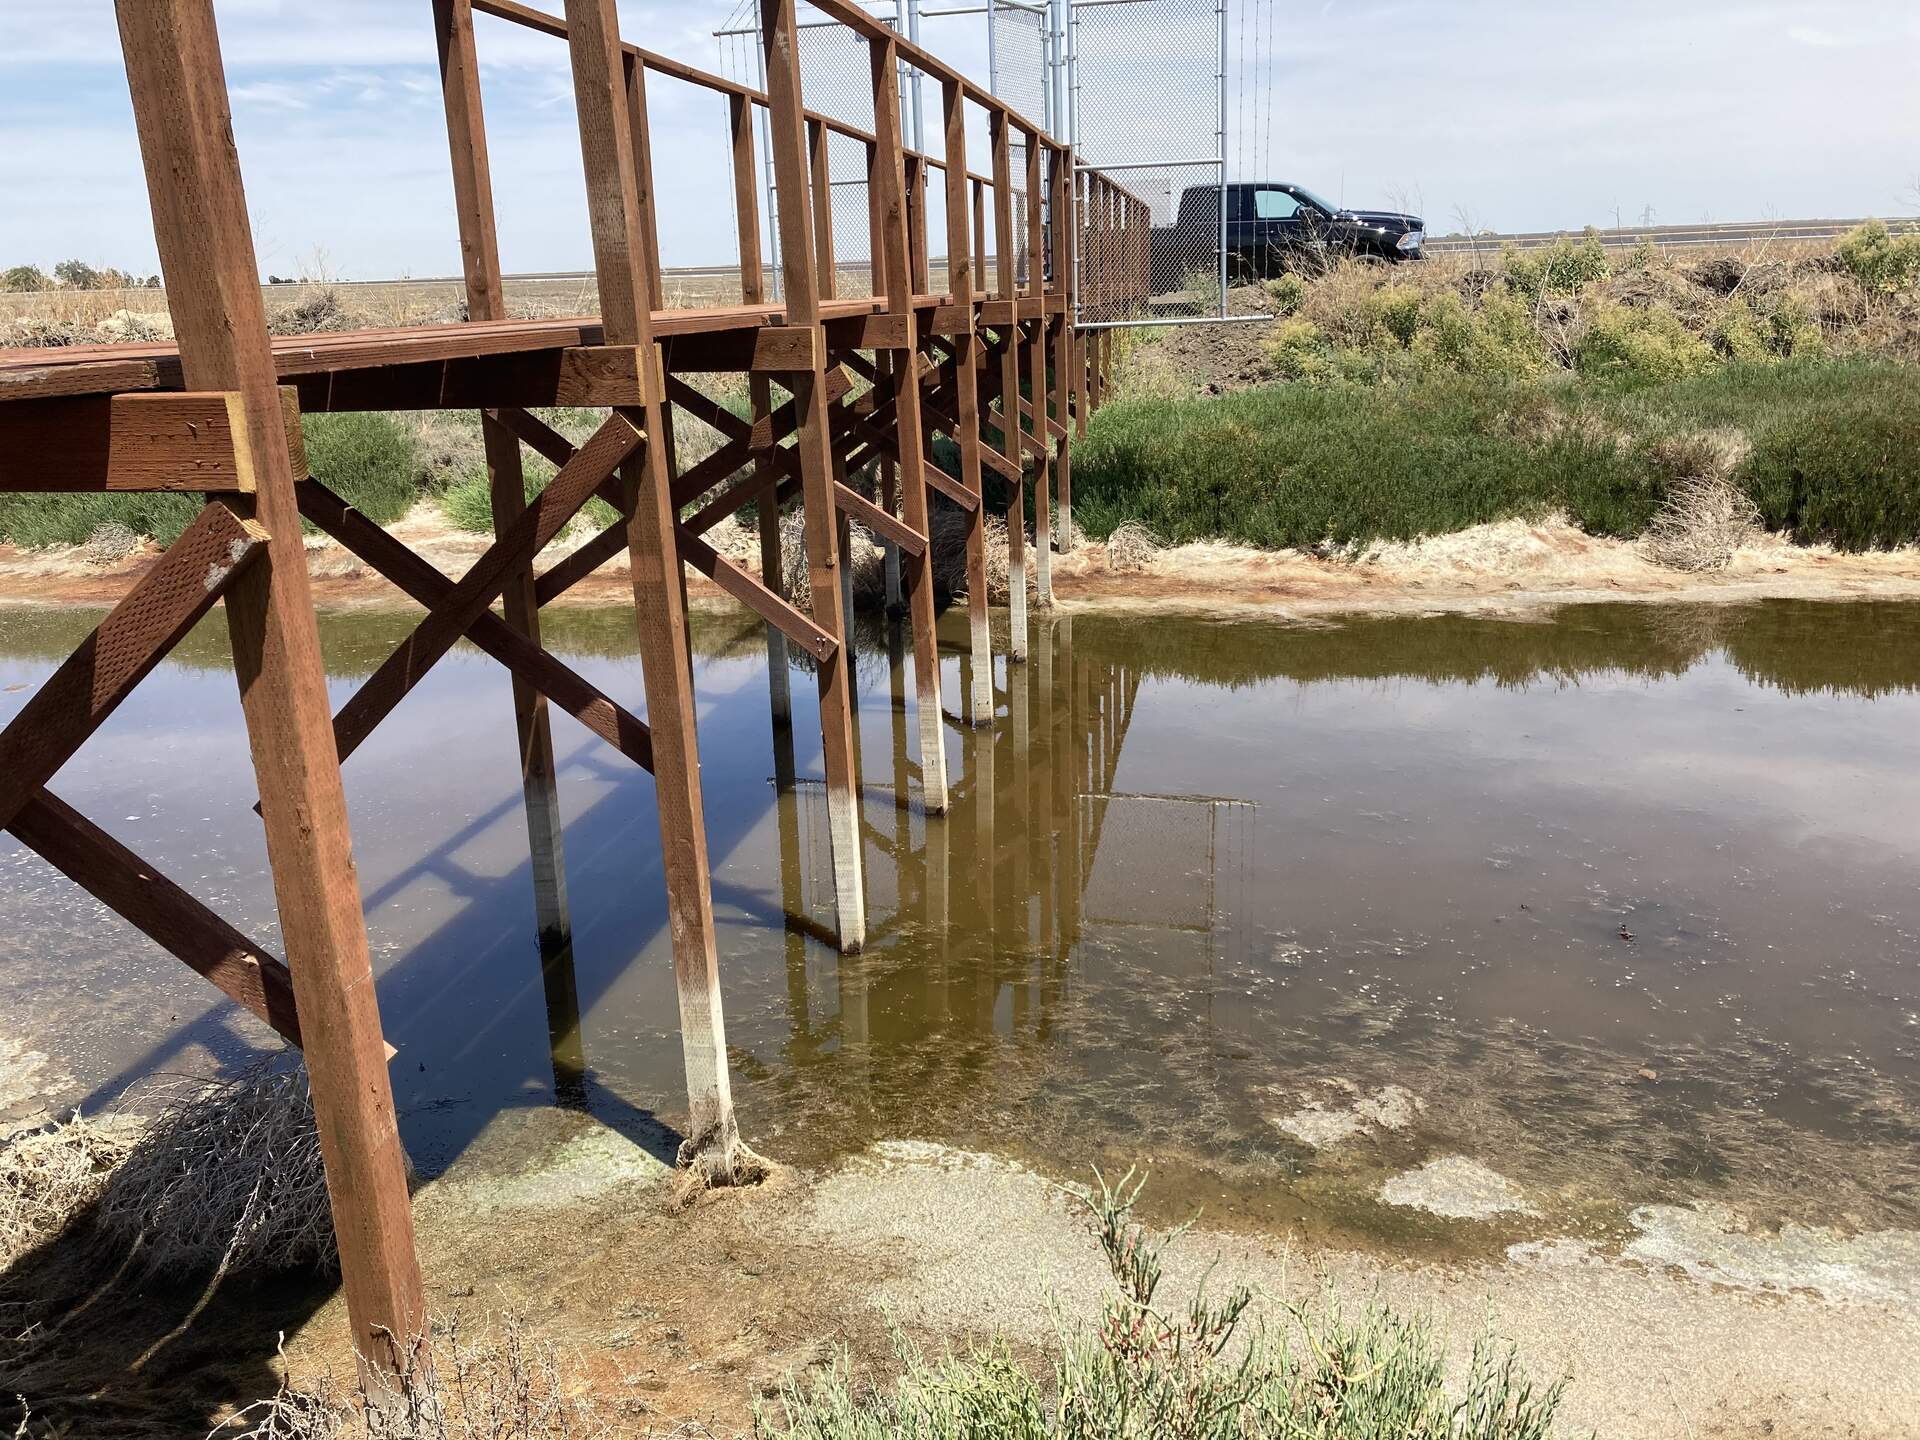
20210616HS_LowTide.jpg ( 2021-06-16 14:07:09 ) Full size: 1920x1440
At low tide you can see the high tide water lines
4 sets found
21 HS_met graphs found
4 HS_flux graphs found
1 HS_cam graphs found
Can't check HS_Processed
2 HS_Processed graphs found