
Field Notes
<--2021-05-19 10:45:00 | 2021-06-24 13:20:00-->Other sites visited today: Bouldin Corn | Tonzi
Phenocam link: Searching...
Vaira: 2021-06-02 11:15:00 (DOY 153)
Author: Joe Verfaillie
Others:
Summary: Upgraded 7550 firmware, swapped 7500, Broke and fixed met power, replaced pond SLA battery with lithium power pack, smell of smoke in the air
| Vaira 2021-06-02 I arrived at about 11:15 PDT. It was clear sunny and hot with a nice breeze from the west that was bringing a hint of smoke. I saw a grass fire northwest of Galt on my way up. The grass and ground are hard and crispy. Next time I should collect some biomass for season total. There was some water in the water hole still and some green grass in the drainages but the stream from the pond that had water last week was bone dry. I did the well measurement and the two moisture point profiles. At the tower I upgraded the LI-7550 sn AIU-1870 firmware from v8.5.0 to v8.8.32. This was done mostly for standardization since we upgraded the Delta 7550s to try to improve time synchronization with the 7700s. The reading before and after the upgrade were nearly identical and all system settings seemed to be okay. I change the 7550s IP address from the default to 192.168.2.75. Then I swapped the head for calibration: sn 75H-2667 came off and sn 0065 went on. 2667 v8.8 read: 406.7ppm CO2, 495.9mmol/m3 H2O, 32.8C, 99.2kPa, 101.5SS 0065 v8.8 read: 424.1ppmCO2, 455.9mmol/m3 H2O, 34.3C, 99.2kPa, 102.4SS I set the pressure coefficients and restarted the box. With the new firmware there will no longer be the summary files. Getting the ladder out to check the radiometers I bumped a power cable from the solar charge controller box. The eddy tower still had power and the HMP45 fan was running (and probably the Phenocam), but the CR1000 was not running. I checked connections in the solar controller box and didn’t see any problems there at first. I disconnected all the power at the tower and there seemed to be a little voltage there like something was browning out the system or a weak connection in the power line. Checking the solar controller box a second time I found a black wire had come loose from its spade terminal. I fixed that, reconnected everything in the data logger box and all seemed well. However, adding a pluggable power strip to the data logger box and cleaning up the way power runs in multiple paths would be a good idea. I went to the pond to swap the solar battery that has been failing there. I swapped in a lithium power pack and added a DC-DC converter on the solar panel to give it a steady 12V. We will see in another five years or so if the lithium works out better than the SLA. The SLA battery I removed was definitely weak – it had faded to 10V by the next morning. I left at about 13:00 PDT |
Field Data
No tank data
Well Depth
| Date | Location | Depth (feet) |
|---|---|---|
| 2021-06-02 | VR_well | 57.15 |
| 2021-06-02 | VR_pond | 15.74 |
| 2021-06-02 | TZ_floor | 30.7 |
| 2021-06-02 | TZ_road | 38.6 |
| 2021-06-02 | TZ_tower | 35 |
mode = both
Moisture Point Probes TZ
Array
(
[0] => Tower_1
[1] => Floor_South_1
[2] => Soil_Transect_4_1
[3] => Soil_Transect_3_1
[4] => Soil_Transect_2_1
[5] => Soil_Transect_1_1
[6] => SoilCO2_West_A_1
[7] => SoilCO2_West_B_1
[8] => SoilCO2_West_C_1
[9] => Tower_2
[10] => Floor_South_2
[11] => Soil_Transect_4_2
[12] => Soil_Transect_3_2
[13] => Soil_Transect_2_2
[14] => Soil_Transect_1_2
[15] => SoilCO2_West_A_2
[16] => SoilCO2_West_B_2
[17] => SoilCO2_West_C_2
[18] => Tower_3
[19] => Floor_South_3
[20] => Soil_Transect_4_3
[21] => Soil_Transect_3_3
[22] => Soil_Transect_2_3
[23] => Soil_Transect_1_3
[24] => SoilCO2_West_A_3
[25] => SoilCO2_West_B_3
[26] => SoilCO2_West_C_3
[27] => Tower_4
[28] => Soil_Transect_4_4
[29] => Soil_Transect_3_4
[30] => Soil_Transect_2_4
[31] => Soil_Transect_1_4
[32] => SoilCO2_West_A_4
[33] => SoilCO2_West_B_4
[34] => SoilCO2_West_C_4
)
| Date | DOY | Rep | Depth | Tower_1 |
Floor_South_1 |
Soil_Transect_4_1 |
Soil_Transect_3_1 |
Soil_Transect_2_1 |
Soil_Transect_1_1 |
SoilCO2_West_A_1 |
SoilCO2_West_B_1 |
SoilCO2_West_C_1 |
Tower_2 |
Floor_South_2 |
Soil_Transect_4_2 |
Soil_Transect_3_2 |
Soil_Transect_2_2 |
Soil_Transect_1_2 |
SoilCO2_West_A_2 |
SoilCO2_West_B_2 |
SoilCO2_West_C_2 |
Tower_3 |
Floor_South_3 |
Soil_Transect_4_3 |
Soil_Transect_3_3 |
Soil_Transect_2_3 |
Soil_Transect_1_3 |
SoilCO2_West_A_3 |
SoilCO2_West_B_3 |
SoilCO2_West_C_3 |
Tower_4 |
Soil_Transect_4_4 |
Soil_Transect_3_4 |
Soil_Transect_2_4 |
Soil_Transect_1_4 |
SoilCO2_West_A_4 |
SoilCO2_West_B_4 |
SoilCO2_West_C_4 |
Avg | Spacial Count |
Measurement Count |
|---|---|---|---|---|---|---|---|---|---|---|---|---|---|---|---|---|---|---|---|---|---|---|---|---|---|---|---|---|---|---|---|---|---|---|---|---|---|---|---|---|---|
| 2021-06-02 | 153 | 0 | nan | 4.5 | 4.2 | 7.9 | 0.9 | 3 | 4.7 | 8.6 | 1.2 | 0.3 | 12.1 | 6.9 | 7.5 | 13.9 | 12.4 | 4.5 | 7.2 | 0.5 | 11.5 | 14.8 | 27.1 | 10.9 | 13.4 | 17.3 | 14 | 15.6 | 16.8 | 11.7 | 20.8 | 11.9 | 20.2 | 29.9 | 14.8 | 21.3 | 11 | 15.6 | |||
| 2021-06-02 | 153 | 1 | nan | 3.9 | 3.9 | 5.4 | 1.5 | 0.6 | 5.3 | 9.4 | 0.6 | 0.6 | 11.8 | 6.9 | 6.9 | 14.2 | 11.8 | 4.2 | 8.7 | 0.3 | 11.8 | 14.8 | 26.8 | 10.9 | 14 | 16.2 | 13.7 | 15.6 | 17 | 11.7 | 21.1 | 12.2 | 20.2 | 29.9 | 14.8 | 20.5 | 10.7 | 15 | |||
| 2021-06-02 | 153 | Avg | 0-15cm | 0 | 0 | ||||||||||||||||||||||||||||||||||||
| 2021-06-02 | 153 | Avg | 15-30cm | 0 | 0 | ||||||||||||||||||||||||||||||||||||
| 2021-06-02 | 153 | Avg | 30-45cm | 0 | 0 | ||||||||||||||||||||||||||||||||||||
| 2021-06-02 | 153 | Avg | 45-60cm | 0 | 0 |
mode = both
Moisture Point Probes VR
Array
(
[0] => Flux_Tower_1
[1] => Biomass_Cage_1
[2] => Flux_Tower_2
[3] => Biomass_Cage_2
[4] => Flux_Tower_3
[5] => Biomass_Cage_3
[6] => Flux_Tower_4
[7] => Biomass_Cage_4
)
| Date | DOY | Rep | Depth | Flux_Tower_1 |
Biomass_Cage_1 |
Flux_Tower_2 |
Biomass_Cage_2 |
Flux_Tower_3 |
Biomass_Cage_3 |
Flux_Tower_4 |
Biomass_Cage_4 |
Avg | Spacial Count |
Measurement Count |
|---|---|---|---|---|---|---|---|---|---|---|---|---|---|---|
| 2021-06-02 | 153 | 0 | nan | 1 | 0.1 | 8.4 | 4.2 | 4.2 | 11.5 | 11.6 | 13.9 | |||
| 2021-06-02 | 153 | 1 | nan | 0.1 | 0.1 | 8.1 | 4.2 | 4.2 | 11.7 | 11 | 14.2 | |||
| 2021-06-02 | 153 | Avg | 0-15cm | 0 | 0 | |||||||||
| 2021-06-02 | 153 | Avg | 15-30cm | 0 | 0 | |||||||||
| 2021-06-02 | 153 | Avg | 30-45cm | 0 | 0 | |||||||||
| 2021-06-02 | 153 | Avg | 45-60cm | 0 | 0 |
No TZ grass heigth found
No VR grass heigth found
No VR Tree DBH found
No water potential data found
No VR Grass Biomass data found
No VR OakLeaves Biomass data found
No VR PineNeedles Biomass data found
2 photos found

20210602VR_DryDryDry.jpg ( 2021-06-02 11:21:46 ) Full size: 1920x1440
Very dry and hot for second day of June
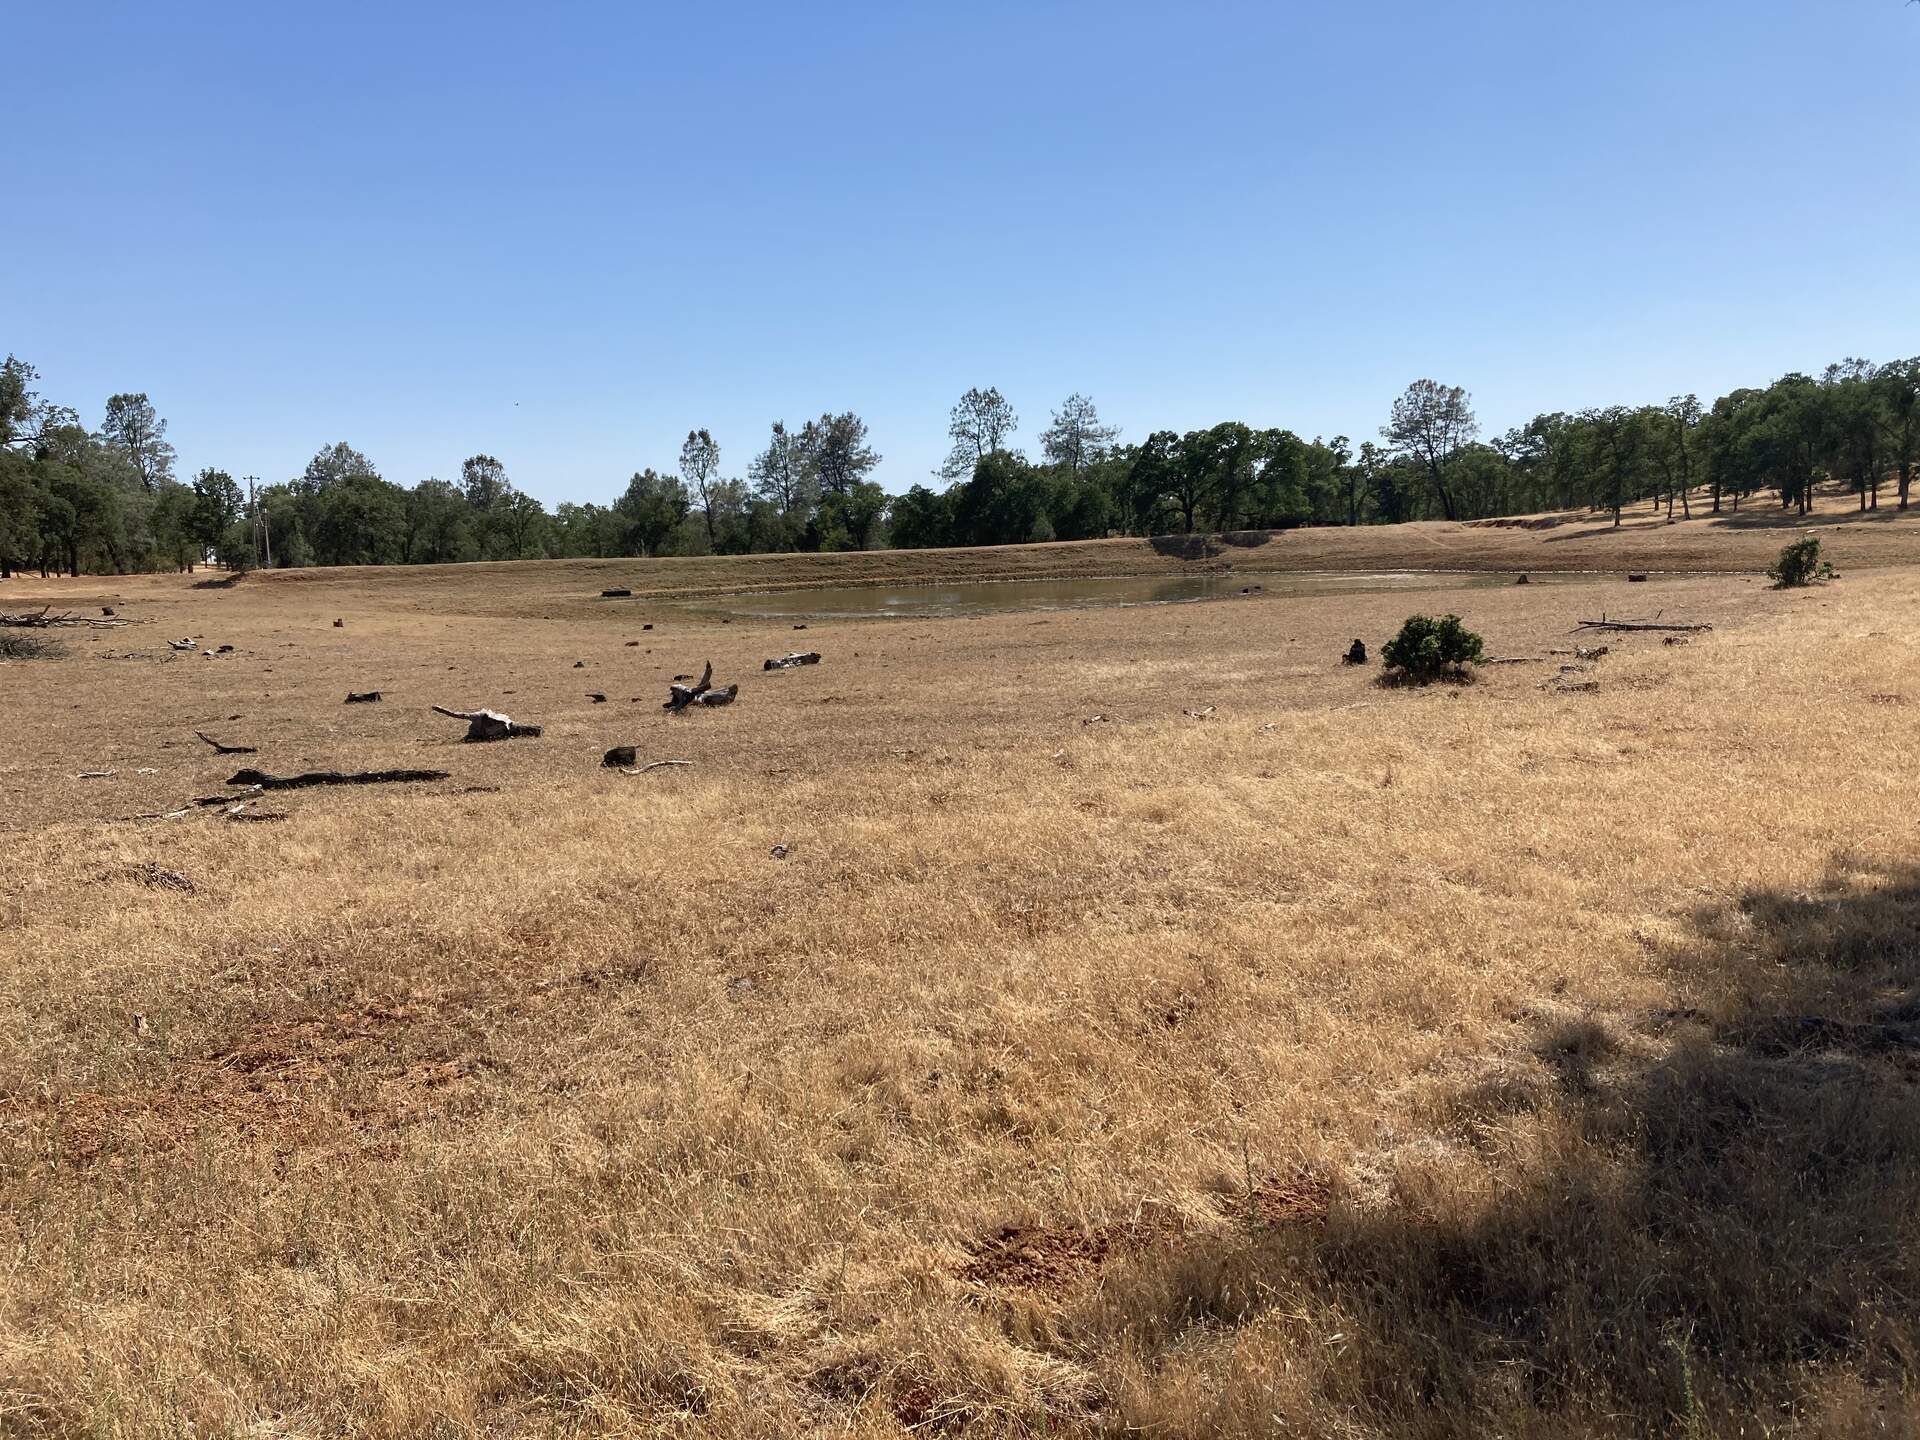
20210602VR_Pond.jpg ( 2021-06-02 16:00:20 ) Full size: 1920x1440
The pond is very low for second day of June
9 sets found
16 VR_met graphs found
2 VR_flux graphs found
2 VR_soilco2 graphs found
2 VR_pond graphs found
Can't check TZVR_mixed
3 VR_fd graphs found
4 VR_processed graphs found
4 VR_arable graphs found
No data found for VR_soilvue.