
Field Notes
<--2021-03-02 11:30:00 | 2021-04-01 12:45:00-->Other sites visited today: Vaira
Phenocam link: Searching...
Tonzi: 2021-03-17 11:00:00 (DOY 76)
Author: Joe Verfaillie
Others:
Summary: Rain coming, removed COSMOS soil moisture system, removed cow chewed IRT, Installed Theta probe #6, Removed CO2 tank for old co2 profile system.
| Tonzi 2021-03-17 I arrived at about 11:00 PDT. It was mild and overcast with almost no wind – rain coming tomorrow. There were puddles on the road but the ground is still firm. Some of the trees have begun to put on leaves. The mutant tree near Mr Tonzi’s house was nearly fully leafed out. There are young cows around that came to see if I would feed them. I installed Theta probe sn 139/052 to replace Theta #6 that I removed last time. I put it back in the same hole and tried to get at the same depth inserted vertically with its times 44-50cm deep. The soil is transitioning to decomposed granite at this depth. I added a power strip to the data logger box and rewired all the Theta probes to the power strip. They seemed to be reporting reasonable numbers. I collected all the data logger data and the flux data. The IRT radio link had quit five days ago but a restart fixed it. The reflected PRI sensor was a little tilted I straightened it and tightened its mounting screw. I did the Moisture Point, well depth and DBH measurements and serviced the z-cams. I collected the FD chamber data and cleared their memories. A cow had eaten the cable for the IRT sensor sn 7385 pointed at the grass north of the Floor solar panels. From the sensor to the data logger, the cable was gone. I removed the sensor and the chewed end of the cable from the data logger. We need a tank of CO2 in air for Patty’s isotope machine to extend its run for the planned hot spot sampling experiment at SW. So, I removed the tank from the old CO2 profile system on the tower. It still had about 1200psi in it. There is also a N2 tank which should have a similar pressure left at the tower. I also removed the COSMOS soil moisture system. I took everything (box, tubes, solar panel, sat antenna) off the post but left the post. The project funding ended long ago and it has not sent good data in more than a year. After talking to the tech it was decided it could not be fixed remotely but they could refurbish it and use it for another project. They will send boxes and shipping labels for its return. I was going to mount the Road well data logger box to the concrete pad but the box was missing its metal mounting flange. I brought the drill and concrete anchors but left them sitting on the pad. I hope the rain doesn’t destroy the drill. I left at about 2:30 PDT |
Field Data
No tank data
Well Depth
| Date | Location | Depth (feet) |
|---|---|---|
| 2021-03-17 | VR_well | 56.75 |
| 2021-03-17 | VR_pond | 18.98 |
| 2021-03-17 | TZ_floor | 30.85 |
| 2021-03-17 | TZ_road | 37.55 |
| 2021-03-17 | TZ_tower | 34.7 |
mode = both
Moisture Point Probes TZ
Array
(
[0] => Tower_1
[1] => Floor_South_1
[2] => Soil_Transect_4_1
[3] => Soil_Transect_3_1
[4] => Soil_Transect_2_1
[5] => Soil_Transect_1_1
[6] => SoilCO2_West_A_1
[7] => SoilCO2_West_B_1
[8] => SoilCO2_West_C_1
[9] => Tower_2
[10] => Floor_South_2
[11] => Soil_Transect_4_2
[12] => Soil_Transect_3_2
[13] => Soil_Transect_2_2
[14] => Soil_Transect_1_2
[15] => SoilCO2_West_A_2
[16] => SoilCO2_West_B_2
[17] => SoilCO2_West_C_2
[18] => Tower_3
[19] => Floor_South_3
[20] => Soil_Transect_4_3
[21] => Soil_Transect_3_3
[22] => Soil_Transect_2_3
[23] => Soil_Transect_1_3
[24] => SoilCO2_West_A_3
[25] => SoilCO2_West_B_3
[26] => SoilCO2_West_C_3
[27] => Tower_4
[28] => Floor_South_4
[29] => Soil_Transect_4_4
[30] => Soil_Transect_3_4
[31] => Soil_Transect_2_4
[32] => Soil_Transect_1_4
[33] => SoilCO2_West_A_4
[34] => SoilCO2_West_B_4
[35] => SoilCO2_West_C_4
)
| Date | DOY | Rep | Depth | Tower_1 |
Floor_South_1 |
Soil_Transect_4_1 |
Soil_Transect_3_1 |
Soil_Transect_2_1 |
Soil_Transect_1_1 |
SoilCO2_West_A_1 |
SoilCO2_West_B_1 |
SoilCO2_West_C_1 |
Tower_2 |
Floor_South_2 |
Soil_Transect_4_2 |
Soil_Transect_3_2 |
Soil_Transect_2_2 |
Soil_Transect_1_2 |
SoilCO2_West_A_2 |
SoilCO2_West_B_2 |
SoilCO2_West_C_2 |
Tower_3 |
Floor_South_3 |
Soil_Transect_4_3 |
Soil_Transect_3_3 |
Soil_Transect_2_3 |
Soil_Transect_1_3 |
SoilCO2_West_A_3 |
SoilCO2_West_B_3 |
SoilCO2_West_C_3 |
Tower_4 |
Floor_South_4 |
Soil_Transect_4_4 |
Soil_Transect_3_4 |
Soil_Transect_2_4 |
Soil_Transect_1_4 |
SoilCO2_West_A_4 |
SoilCO2_West_B_4 |
SoilCO2_West_C_4 |
Avg | Spacial Count |
Measurement Count |
|---|---|---|---|---|---|---|---|---|---|---|---|---|---|---|---|---|---|---|---|---|---|---|---|---|---|---|---|---|---|---|---|---|---|---|---|---|---|---|---|---|---|---|
| 2021-03-17 | 76 | 0 | nan | 33.8 | 20.3 | 12.7 | 24.7 | 22.9 | 19.1 | 30.2 | 25 | 24.1 | 33.2 | 30.7 | 27.7 | 31.6 | 30.7 | 19.4 | 26.1 | 18.8 | 31.6 | 34.6 | 38.5 | 26.8 | 31.8 | 34.9 | 32.1 | 34.1 | 24.8 | 37.1 | 42.5 | 50 | 32.2 | 43.4 | 46.3 | 32.2 | 44.5 | 59.2 | 48.8 | |||
| 2021-03-17 | 76 | 1 | nan | 33.8 | 19.1 | 13.8 | 25.6 | 22.9 | 19.4 | 29.9 | 24.7 | 25 | 32.6 | 30.4 | 27.1 | 31 | 30.7 | 19.4 | 24.9 | 18.8 | 31.6 | 34.6 | 38.5 | 26.8 | 32.4 | 34.1 | 32.1 | 34.3 | 24.8 | 38.8 | 42.5 | 49.1 | 31.4 | 43.1 | 48.4 | 32.2 | 44.8 | 59.4 | 48.6 | |||
| 2021-03-17 | 76 | Avg | 0-15cm | 0 | 0 | |||||||||||||||||||||||||||||||||||||
| 2021-03-17 | 76 | Avg | 15-30cm | 0 | 0 | |||||||||||||||||||||||||||||||||||||
| 2021-03-17 | 76 | Avg | 30-45cm | 0 | 0 | |||||||||||||||||||||||||||||||||||||
| 2021-03-17 | 76 | Avg | 45-60cm | 0 | 0 |
mode = both
Moisture Point Probes VR
Array
(
[0] => Flux_Tower_1
[1] => Biomass_Cage_1
[2] => Flux_Tower_2
[3] => Biomass_Cage_2
[4] => Flux_Tower_3
[5] => Biomass_Cage_3
[6] => Flux_Tower_4
[7] => Biomass_Cage_4
)
| Date | DOY | Rep | Depth | Flux_Tower_1 |
Biomass_Cage_1 |
Flux_Tower_2 |
Biomass_Cage_2 |
Flux_Tower_3 |
Biomass_Cage_3 |
Flux_Tower_4 |
Biomass_Cage_4 |
Avg | Spacial Count |
Measurement Count |
|---|---|---|---|---|---|---|---|---|---|---|---|---|---|---|
| 2021-03-17 | 76 | 0 | nan | 13.2 | 9.4 | 29.5 | 18.5 | 15.6 | 27.6 | 26.2 | 27.1 | |||
| 2021-03-17 | 76 | 1 | nan | 12.7 | 9.4 | 29.8 | 17 | 15.6 | 27.4 | 25.4 | 27.4 | |||
| 2021-03-17 | 76 | Avg | 0-15cm | 0 | 0 | |||||||||
| 2021-03-17 | 76 | Avg | 15-30cm | 0 | 0 | |||||||||
| 2021-03-17 | 76 | Avg | 30-45cm | 0 | 0 | |||||||||
| 2021-03-17 | 76 | Avg | 45-60cm | 0 | 0 |
No TZ grass heigth found
No VR grass heigth found
Tree DBH
| Date | Tag# | Reading (mm) |
|---|---|---|
| 2021-03-17 | 1 | 12.1 |
| 2021-03-17 | 2 | 11.8 |
| 2021-03-17 | 245 | 13.5 |
| 2021-03-17 | 3 | 17.5 |
| 2021-03-17 | 4 | 11.4 |
| 2021-03-17 | 5 | 4.4 |
| 2021-03-17 | 6 | 16.9 |
| 2021-03-17 | 7 | 19.6 |
| 2021-03-17 | 72 | 11.6 |
| 2021-03-17 | 79 | 10.6 |
No water potential data found
No TZ Grass Biomass data found
No TZ OakLeaves Biomass data found
No TZ PineNeedles Biomass data found
1 photos found
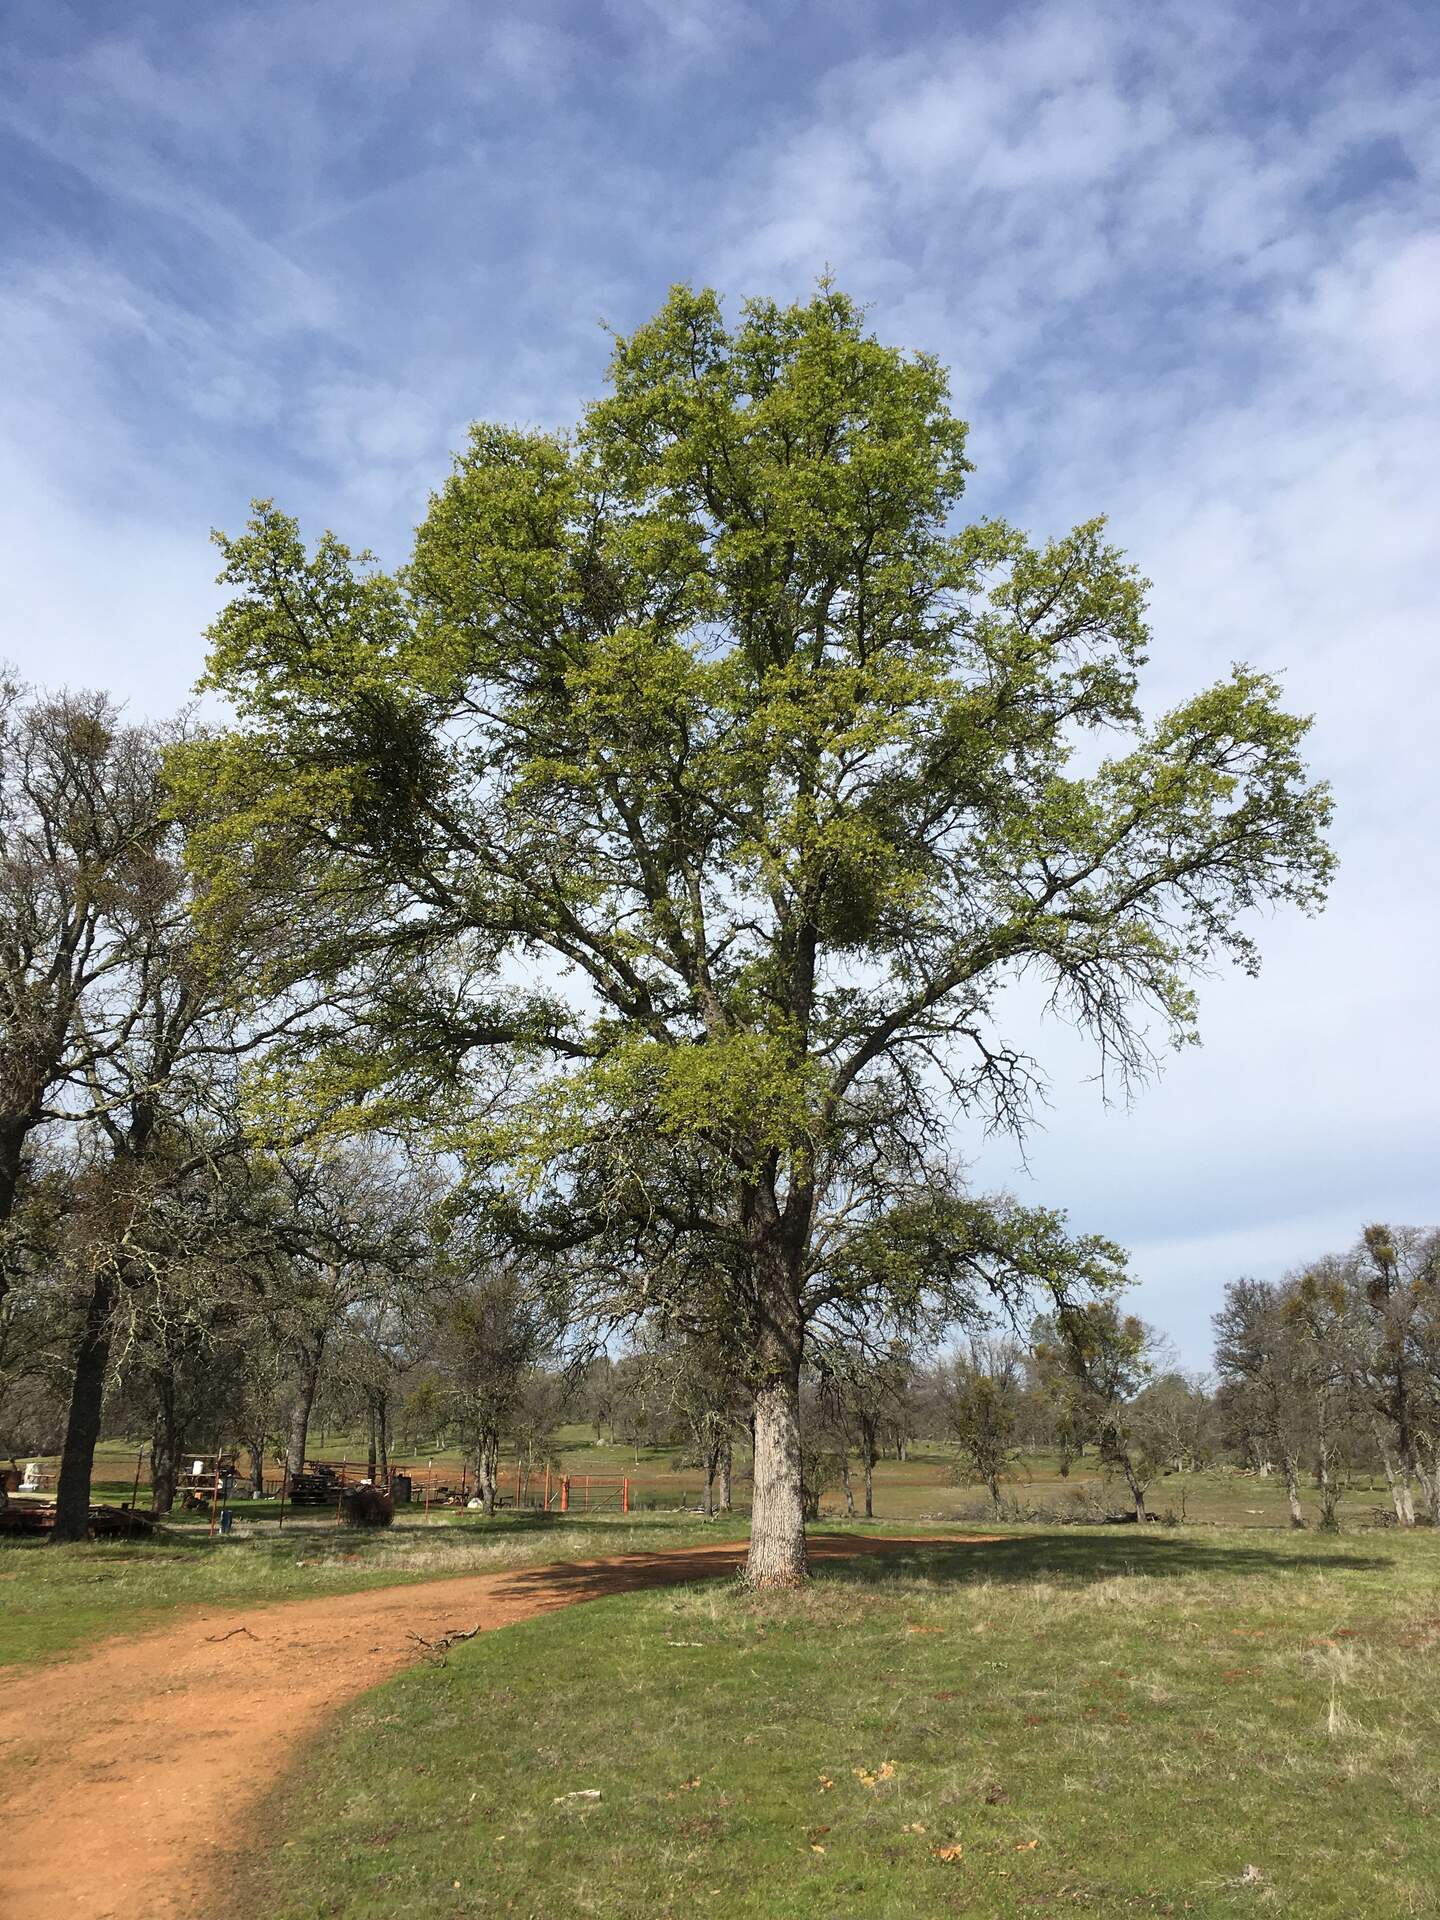
20210317TZ_Leafout.jpg ( 2021-03-17 00:00:00 ) Full size: 1440x1920
Mutant tree nearly full of leaves otherwise about 5% of trees putting on leaves
16 sets found
No data found for TZ_Fenergy.
11 TZ_tmet graphs found
11 TZ_soilco2 graphs found
Can't check TZ_mixed
3 TZ_mixed graphs found
1 TZ_fflux graphs found
8 TZ_fmet graphs found
No data found for TZ_tram.
3 TZ_co2prof graphs found
1 TZ_irt graphs found
No data found for TZ_windprof.
1 TZ_tflux graphs found
2 TZ_sm graphs found
Can't check TZ_met
1 TZ_met graphs found
Can't check TZVR_mixed
8 TZ_osu graphs found
3 TZ_fd graphs found
Tonzi Z-cam data