
Field Notes
<--2021-03-17 11:00:00 | 2021-04-18 11:00:00-->Other sites visited today: West Pond | Bouldin Corn | Vaira
Phenocam link: Searching...
Tonzi: 2021-04-01 12:45:00 (DOY 91)
Author: Joe Verfaillie
Others:
Summary: Dry and warm, tree half way through putting on leaves, more chewed wires near IRT cal panel, Tree 2 soil CO2 system power down, cordless drill gone, serial numbers
| Tonzi 2021-04-01 I arrived at about 12:45 PDT. It was clear sunny and warm with a breeze from the west southwest that would come and go. All the trees have leaves but most are about halfway to full leaves. The pond is only half full and the road and expose ground is dry. Several more dead trees are noticeable now. Young cows came to see if I would feed them. In quiet periods waiting for the moisture point to do its thing, I could hear this background drone of flying insects surrounding me. Very few were to be seen but I could hear the hum of their wings in the air. There were a bunch of wood peckers making lots of noise too. I collected the Tower data. The IRT had lost its radio link again but resetting it restored the connection. The Tower 7500 read: 410.4ppm CO2, 442.2mmol/m3 H2O, 27.2C, 98.9kPa, 101.5SS The Floor 7500 read: 415.0ppm CO2, 492.5 mmol/m3 H2O, 28.7C, 99.2kPa, 101.9SS I was going to put back the IRT I found chewed by cows last time but I was missing a resistor in the cable end that I had removed when I splice on a new cable. I also discovered two more cables that had been chewed either more recently or I just missed them last time. The cable to the cal panel IRT I was able to cut off the chewed portion and reconnect (This is how I found out about the resister). The cable to the 10X by the tree was also chewed but maybe not broken. Again I was able to cut off the chewed portion and reconnect it. I fixed the wire fence around the location. There was also no soil co2 data from the 10X by Liukang's tree. With nothing connected there was 27V on the power line but as soon as I powered something it dropped to less than 7V. I disconnected the power line at the charge controller connected the positive and negative together to measure the round trip resistance - it was something like 3MOhms. There's probably a rotten place in the wire with just enough left to pass the voltage but not any current. It would be nice to have time or some help to look at the data before we decide what to do with the soil co2 system at Tonzi and Vaira. I did the well, DBH and moisture point measurements. I had bad connections to moisture point probes 4 and B - they may be next to die. The cordless drill I forgot last time near the road well is gone - I'll have to buy a new one. The cows had kicked the Global Water box around a bunch. I straightened it out and seems no harm was done. The lithium power pack was dead and I swapped it for a fresh one. Then I piled some rocks on the box to discourage the cows. I wrote down some serial numbers PAR in sn 010164 PAR out sn 030382 Tower HMP45 sn W0730035 Floor HMP45 sn W0510026 I left at 16:12 PDT |
Field Data
No tank data
Well Depth
| Date | Location | Depth (feet) |
|---|---|---|
| 2021-04-01 | VR_well | 56.2 |
| 2021-04-01 | TZ_road | 38.4 |
| 2021-04-01 | TZ_tower | 34.35 |
| 2021-04-01 | TZ_floor | 30.4 |
mode = both
Moisture Point Probes TZ
Array
(
[0] => Tower_1
[1] => Floor_South_1
[2] => Soil_Transect_4_1
[3] => Soil_Transect_3_1
[4] => Soil_Transect_2_1
[5] => Soil_Transect_1_1
[6] => SoilCO2_West_A_1
[7] => SoilCO2_West_B_1
[8] => SoilCO2_West_C_1
[9] => Tower_2
[10] => Floor_South_2
[11] => Soil_Transect_4_2
[12] => Soil_Transect_3_2
[13] => Soil_Transect_2_2
[14] => Soil_Transect_1_2
[15] => SoilCO2_West_A_2
[16] => SoilCO2_West_B_2
[17] => SoilCO2_West_C_2
[18] => Tower_3
[19] => Floor_South_3
[20] => Soil_Transect_4_3
[21] => Soil_Transect_3_3
[22] => Soil_Transect_2_3
[23] => Soil_Transect_1_3
[24] => SoilCO2_West_A_3
[25] => SoilCO2_West_B_3
[26] => SoilCO2_West_C_3
[27] => Tower_4
[28] => Floor_South_4
[29] => Soil_Transect_4_4
[30] => Soil_Transect_3_4
[31] => Soil_Transect_2_4
[32] => Soil_Transect_1_4
[33] => SoilCO2_West_A_4
[34] => SoilCO2_West_B_4
[35] => SoilCO2_West_C_4
)
| Date | DOY | Rep | Depth | Tower_1 |
Floor_South_1 |
Soil_Transect_4_1 |
Soil_Transect_3_1 |
Soil_Transect_2_1 |
Soil_Transect_1_1 |
SoilCO2_West_A_1 |
SoilCO2_West_B_1 |
SoilCO2_West_C_1 |
Tower_2 |
Floor_South_2 |
Soil_Transect_4_2 |
Soil_Transect_3_2 |
Soil_Transect_2_2 |
Soil_Transect_1_2 |
SoilCO2_West_A_2 |
SoilCO2_West_B_2 |
SoilCO2_West_C_2 |
Tower_3 |
Floor_South_3 |
Soil_Transect_4_3 |
Soil_Transect_3_3 |
Soil_Transect_2_3 |
Soil_Transect_1_3 |
SoilCO2_West_A_3 |
SoilCO2_West_B_3 |
SoilCO2_West_C_3 |
Tower_4 |
Floor_South_4 |
Soil_Transect_4_4 |
Soil_Transect_3_4 |
Soil_Transect_2_4 |
Soil_Transect_1_4 |
SoilCO2_West_A_4 |
SoilCO2_West_B_4 |
SoilCO2_West_C_4 |
Avg | Spacial Count |
Measurement Count |
|---|---|---|---|---|---|---|---|---|---|---|---|---|---|---|---|---|---|---|---|---|---|---|---|---|---|---|---|---|---|---|---|---|---|---|---|---|---|---|---|---|---|---|
| 2021-04-01 | 91 | 0 | nan | 30.5 | 13.2 | 38.9 | 17.3 | 17.9 | 13.2 | 16.2 | 19.4 | 15.9 | 31.3 | 31 | 22.8 | 27.4 | 29.2 | 15.2 | 33.2 | 14.8 | 27.7 | 31.8 | 41.6 | 26.2 | 29 | 33.8 | 32.1 | 41 | 22.3 | 36.3 | 43.1 | 50.3 | 30.8 | 40.3 | 48.6 | 33.4 | 26.2 | 58.3 | 49.4 | |||
| 2021-04-01 | 91 | 1 | nan | 30.8 | 13.8 | 39.9 | 17.6 | 17.3 | 13.5 | 15 | 19.1 | 16.5 | 31.3 | 31.3 | 23.7 | 27.1 | 29.2 | 16.1 | 33.8 | 14.8 | 27.4 | 32.7 | 41.3 | 25.7 | 28.5 | 33.5 | 31.5 | 41 | 31.5 | 36.8 | 42 | 52.3 | 30.5 | 41.7 | 51.7 | 33.7 | 26.8 | 51.4 | 50.3 | |||
| 2021-04-01 | 91 | Avg | 0-15cm | 0 | 0 | |||||||||||||||||||||||||||||||||||||
| 2021-04-01 | 91 | Avg | 15-30cm | 0 | 0 | |||||||||||||||||||||||||||||||||||||
| 2021-04-01 | 91 | Avg | 30-45cm | 0 | 0 | |||||||||||||||||||||||||||||||||||||
| 2021-04-01 | 91 | Avg | 45-60cm | 0 | 0 |
mode = both
Moisture Point Probes VR
Array
(
[0] => Flux_Tower_1
[1] => Biomass_Cage_1
[2] => Flux_Tower_2
[3] => Biomass_Cage_2
[4] => Flux_Tower_3
[5] => Biomass_Cage_3
[6] => Flux_Tower_4
[7] => Biomass_Cage_4
)
| Date | DOY | Rep | Depth | Flux_Tower_1 |
Biomass_Cage_1 |
Flux_Tower_2 |
Biomass_Cage_2 |
Flux_Tower_3 |
Biomass_Cage_3 |
Flux_Tower_4 |
Biomass_Cage_4 |
Avg | Spacial Count |
Measurement Count |
|---|---|---|---|---|---|---|---|---|---|---|---|---|---|---|
| 2021-04-01 | 91 | 0 | nan | 8 | 5.9 | 24 | 14.4 | 12.6 | 23.5 | 23.6 | 25.9 | |||
| 2021-04-01 | 91 | 1 | nan | 7.7 | 6.2 | 24 | 14.2 | 14 | 24 | 24.2 | 25.6 | |||
| 2021-04-01 | 91 | Avg | 0-15cm | 0 | 0 | |||||||||
| 2021-04-01 | 91 | Avg | 15-30cm | 0 | 0 | |||||||||
| 2021-04-01 | 91 | Avg | 30-45cm | 0 | 0 | |||||||||
| 2021-04-01 | 91 | Avg | 45-60cm | 0 | 0 |
No TZ grass heigth found
No VR grass heigth found
Tree DBH
| Date | Tag# | Reading (mm) |
|---|---|---|
| 2021-04-01 | 1 | 12.1 |
| 2021-04-01 | 102 | 7.8 |
| 2021-04-01 | 2 | 11.5 |
| 2021-04-01 | 245 | 13.5 |
| 2021-04-01 | 3 | 17.9 |
| 2021-04-01 | 4 | 11.9 |
| 2021-04-01 | 5 | 4.7 |
| 2021-04-01 | 6 | 17.0 |
| 2021-04-01 | 7 | 19.9 |
| 2021-04-01 | 72 | 11.8 |
| 2021-04-01 | 79 | 10.7 |
No water potential data found
No TZ Grass Biomass data found
No TZ OakLeaves Biomass data found
No TZ PineNeedles Biomass data found
1 photos found
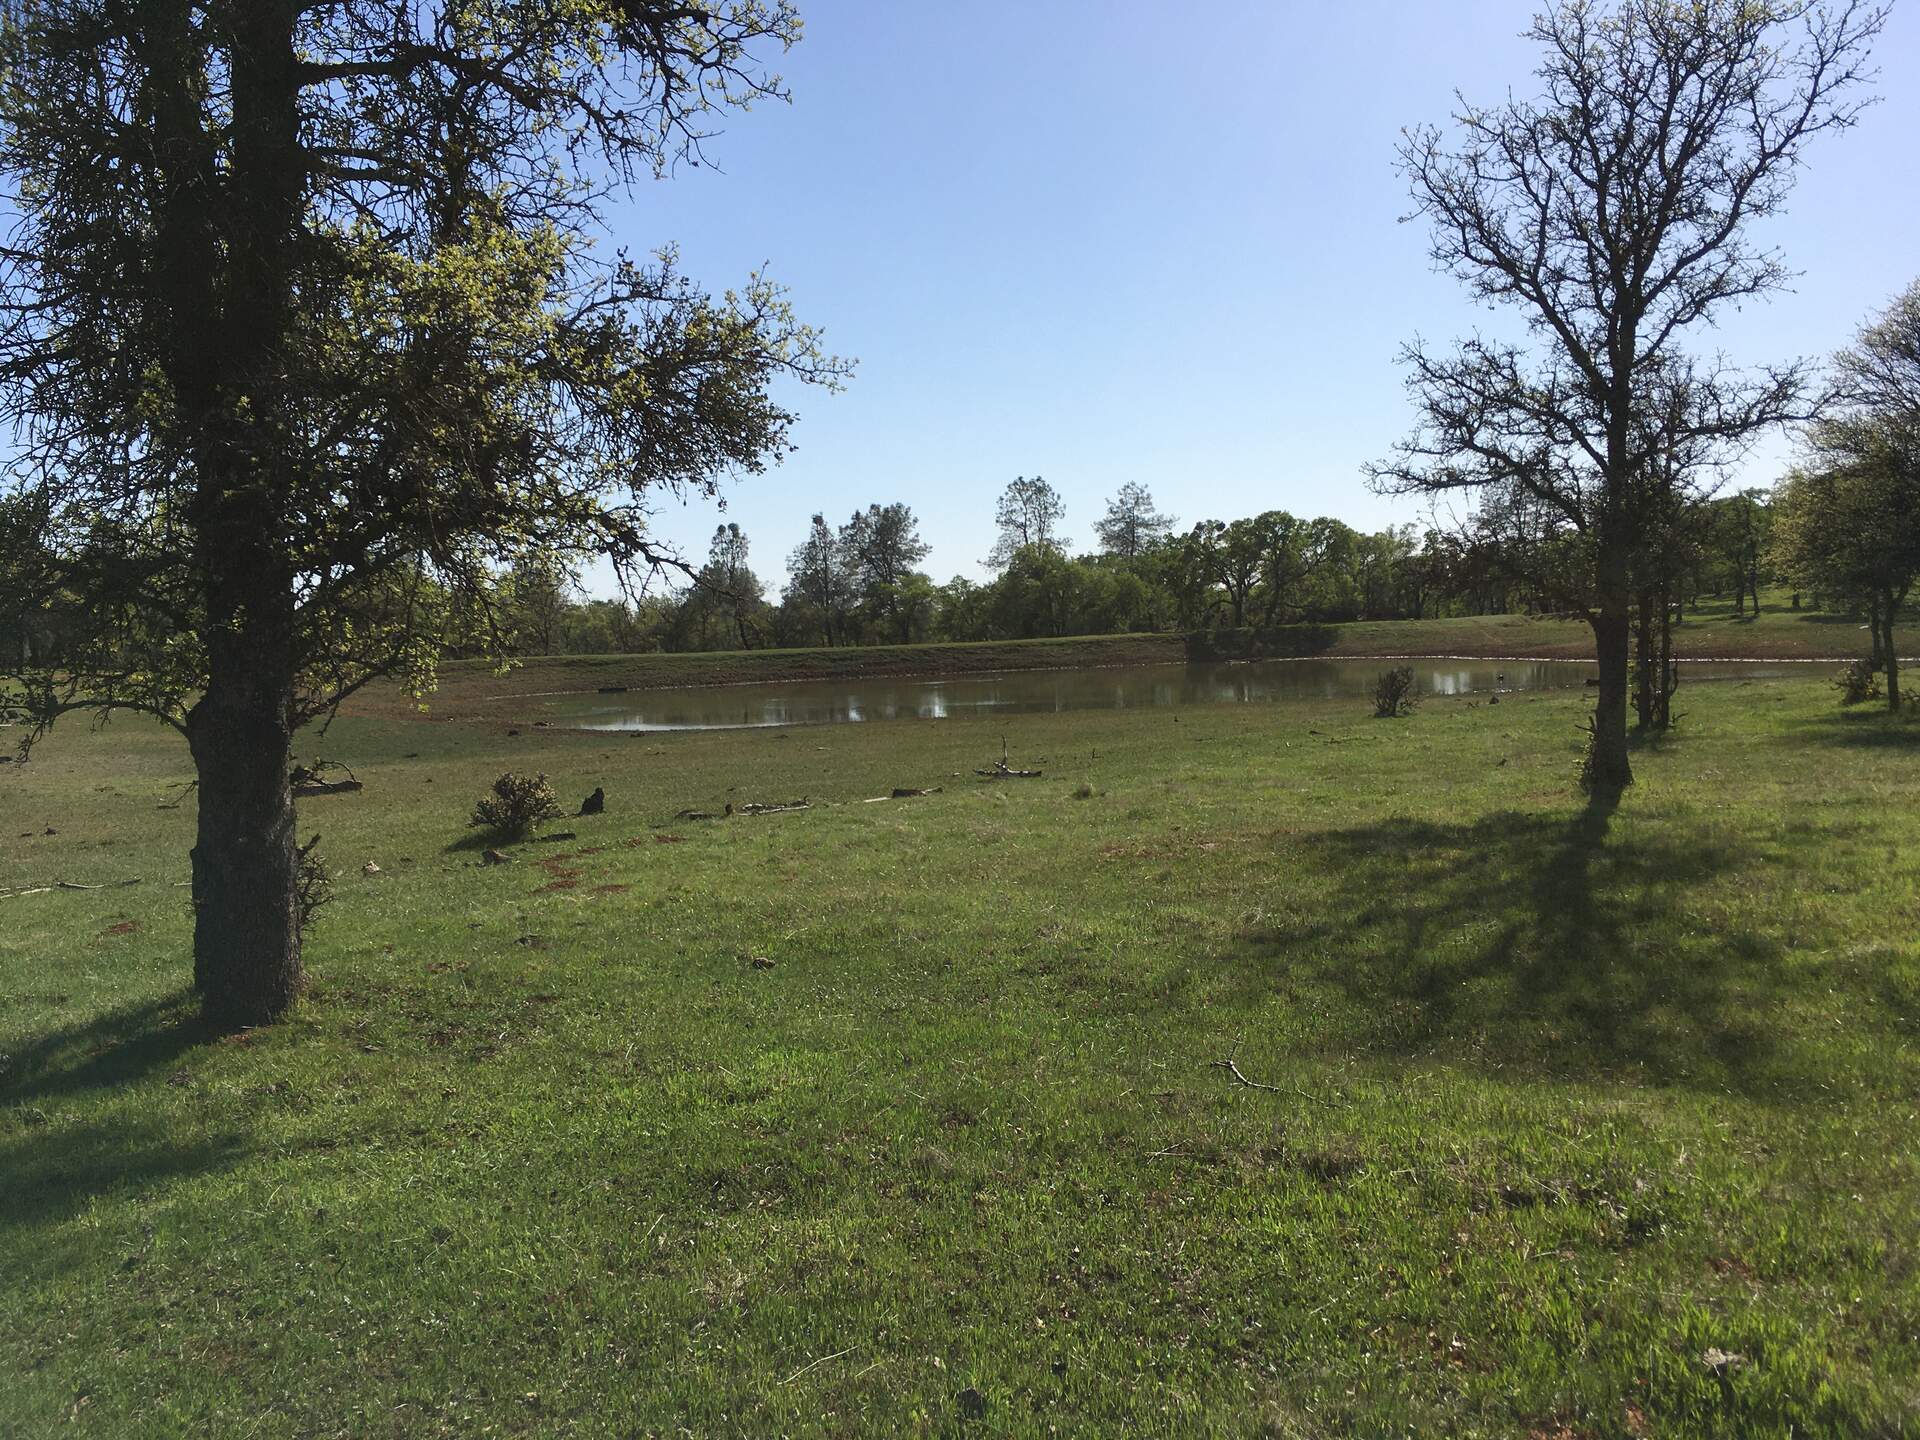
20210401TZ_PondHalfFull.jpg ( 2021-04-01 16:08:00 ) Full size: 1920x1440
The pond is only about half full
16 sets found
No data found for TZ_Fenergy.
11 TZ_tmet graphs found
11 TZ_soilco2 graphs found
Can't check TZ_mixed
3 TZ_mixed graphs found
1 TZ_fflux graphs found
8 TZ_fmet graphs found
No data found for TZ_tram.
3 TZ_co2prof graphs found
1 TZ_irt graphs found
No data found for TZ_windprof.
1 TZ_tflux graphs found
2 TZ_sm graphs found
Can't check TZ_met
1 TZ_met graphs found
Can't check TZVR_mixed
8 TZ_osu graphs found
3 TZ_fd graphs found
Tonzi Z-cam data