Field Notes
<--2021-03-02 10:00:00 | 2021-04-01 11:45:00-->Other sites visited today: Tonzi
Phenocam link: Searching...
Vaira: 2021-03-17 09:20:00 (DOY 76)
Author: Joe Verfaillie
Others:
Summary: Rain is coming, no cows to be found, swapped FD chamber, trees starting to put on leaves
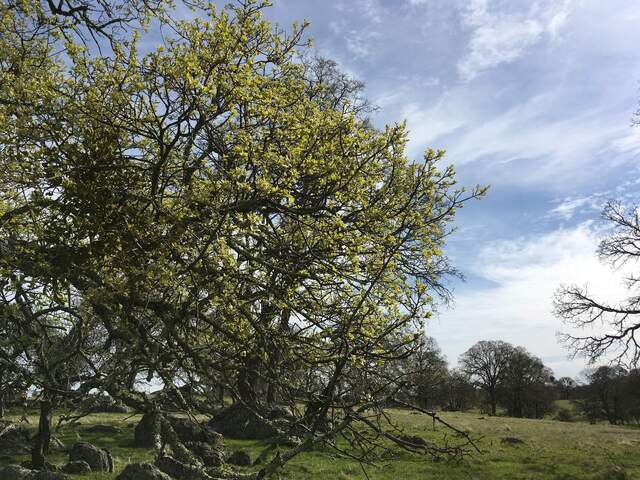
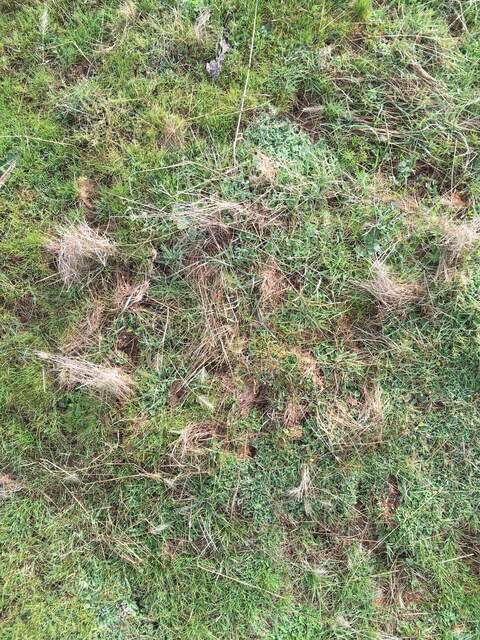
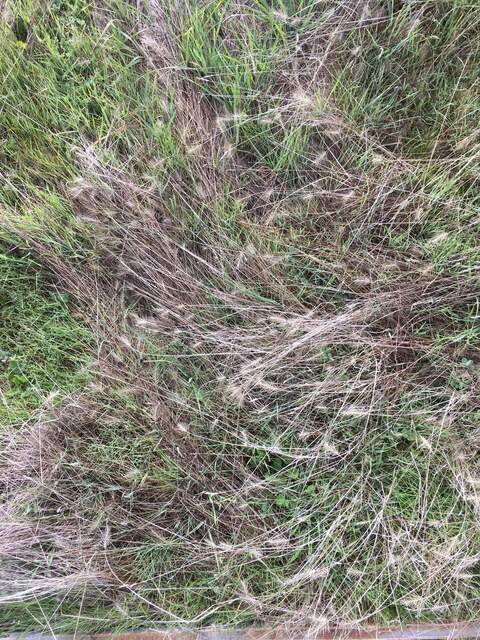
| Vaira 2021-03-17 I arrived at about 9:20 PDT. It was mild with a patchy overcast and little to no wind – rain coming tomorrow. Lots of noise from the gun range early on. The road is mostly dry with just small puddles in the usual places. The road to the pond was fine. The water hole was full but I don’t think the pond has been full yet this year. There were lots of wheel marks on the road and no cows to be seen – maybe they have moved the cows off already. A few trees have begun to leaf out. By next visit they should all have leaves. The grass was still only about 5cm tall – much taller in the fenced areas but choked by old litter there. There was heavy dew on the ground which was probably frost a short while ago. I took photos of the ground outside the fence and inside the fence and calculated GCC. Outside GCC was 0.38 and inside was 0.35 – doesn’t seem like a big difference but GCC only ranges from 0.30 to 0.40 so about 1/3 of the total range. I collected the well, Moisture Point, met, flux, camera and FD data. All seemed fine. I swapped out FD chambers sn FD20190028 came off and sn FD20180068 went on. 28 belongs to us and we might use it at HS. 68 belongs to Eosense and just came back from service maintenance. I cleaned the radiation sensors and added new desiccant to the BF3 sn 26/8 – there was a tiny bit of condensation in its dome. I checked the Phenocam time and it was fine. I need to run some Ethernet lines to the eddy system so everything is connected together. I should also start logging the FD data to the soil co2 23x. I left at about 11:00 PDT |
Field Data
No tank data
Well Depth
| Date | Location | Depth (feet) |
|---|---|---|
| 2021-03-17 | VR_well | 56.75 |
| 2021-03-17 | VR_pond | 18.98 |
| 2021-03-17 | TZ_floor | 30.85 |
| 2021-03-17 | TZ_road | 37.55 |
| 2021-03-17 | TZ_tower | 34.7 |
mode = both
Moisture Point Probes TZ
Array
(
[0] => Tower_1
[1] => Floor_South_1
[2] => Soil_Transect_4_1
[3] => Soil_Transect_3_1
[4] => Soil_Transect_2_1
[5] => Soil_Transect_1_1
[6] => SoilCO2_West_A_1
[7] => SoilCO2_West_B_1
[8] => SoilCO2_West_C_1
[9] => Tower_2
[10] => Floor_South_2
[11] => Soil_Transect_4_2
[12] => Soil_Transect_3_2
[13] => Soil_Transect_2_2
[14] => Soil_Transect_1_2
[15] => SoilCO2_West_A_2
[16] => SoilCO2_West_B_2
[17] => SoilCO2_West_C_2
[18] => Tower_3
[19] => Floor_South_3
[20] => Soil_Transect_4_3
[21] => Soil_Transect_3_3
[22] => Soil_Transect_2_3
[23] => Soil_Transect_1_3
[24] => SoilCO2_West_A_3
[25] => SoilCO2_West_B_3
[26] => SoilCO2_West_C_3
[27] => Tower_4
[28] => Floor_South_4
[29] => Soil_Transect_4_4
[30] => Soil_Transect_3_4
[31] => Soil_Transect_2_4
[32] => Soil_Transect_1_4
[33] => SoilCO2_West_A_4
[34] => SoilCO2_West_B_4
[35] => SoilCO2_West_C_4
)
| Date | DOY | Rep | Depth | Tower_1 |
Floor_South_1 |
Soil_Transect_4_1 |
Soil_Transect_3_1 |
Soil_Transect_2_1 |
Soil_Transect_1_1 |
SoilCO2_West_A_1 |
SoilCO2_West_B_1 |
SoilCO2_West_C_1 |
Tower_2 |
Floor_South_2 |
Soil_Transect_4_2 |
Soil_Transect_3_2 |
Soil_Transect_2_2 |
Soil_Transect_1_2 |
SoilCO2_West_A_2 |
SoilCO2_West_B_2 |
SoilCO2_West_C_2 |
Tower_3 |
Floor_South_3 |
Soil_Transect_4_3 |
Soil_Transect_3_3 |
Soil_Transect_2_3 |
Soil_Transect_1_3 |
SoilCO2_West_A_3 |
SoilCO2_West_B_3 |
SoilCO2_West_C_3 |
Tower_4 |
Floor_South_4 |
Soil_Transect_4_4 |
Soil_Transect_3_4 |
Soil_Transect_2_4 |
Soil_Transect_1_4 |
SoilCO2_West_A_4 |
SoilCO2_West_B_4 |
SoilCO2_West_C_4 |
Avg | Spacial Count |
Measurement Count |
|---|---|---|---|---|---|---|---|---|---|---|---|---|---|---|---|---|---|---|---|---|---|---|---|---|---|---|---|---|---|---|---|---|---|---|---|---|---|---|---|---|---|---|
| 2021-03-17 | 76 | 0 | nan | 33.8 | 20.3 | 12.7 | 24.7 | 22.9 | 19.1 | 30.2 | 25 | 24.1 | 33.2 | 30.7 | 27.7 | 31.6 | 30.7 | 19.4 | 26.1 | 18.8 | 31.6 | 34.6 | 38.5 | 26.8 | 31.8 | 34.9 | 32.1 | 34.1 | 24.8 | 37.1 | 42.5 | 50 | 32.2 | 43.4 | 46.3 | 32.2 | 44.5 | 59.2 | 48.8 | |||
| 2021-03-17 | 76 | 1 | nan | 33.8 | 19.1 | 13.8 | 25.6 | 22.9 | 19.4 | 29.9 | 24.7 | 25 | 32.6 | 30.4 | 27.1 | 31 | 30.7 | 19.4 | 24.9 | 18.8 | 31.6 | 34.6 | 38.5 | 26.8 | 32.4 | 34.1 | 32.1 | 34.3 | 24.8 | 38.8 | 42.5 | 49.1 | 31.4 | 43.1 | 48.4 | 32.2 | 44.8 | 59.4 | 48.6 | |||
| 2021-03-17 | 76 | Avg | 0-15cm | 0 | 0 | |||||||||||||||||||||||||||||||||||||
| 2021-03-17 | 76 | Avg | 15-30cm | 0 | 0 | |||||||||||||||||||||||||||||||||||||
| 2021-03-17 | 76 | Avg | 30-45cm | 0 | 0 | |||||||||||||||||||||||||||||||||||||
| 2021-03-17 | 76 | Avg | 45-60cm | 0 | 0 |
mode = both
Moisture Point Probes VR
Array
(
[0] => Flux_Tower_1
[1] => Biomass_Cage_1
[2] => Flux_Tower_2
[3] => Biomass_Cage_2
[4] => Flux_Tower_3
[5] => Biomass_Cage_3
[6] => Flux_Tower_4
[7] => Biomass_Cage_4
)
| Date | DOY | Rep | Depth | Flux_Tower_1 |
Biomass_Cage_1 |
Flux_Tower_2 |
Biomass_Cage_2 |
Flux_Tower_3 |
Biomass_Cage_3 |
Flux_Tower_4 |
Biomass_Cage_4 |
Avg | Spacial Count |
Measurement Count |
|---|---|---|---|---|---|---|---|---|---|---|---|---|---|---|
| 2021-03-17 | 76 | 0 | nan | 13.2 | 9.4 | 29.5 | 18.5 | 15.6 | 27.6 | 26.2 | 27.1 | |||
| 2021-03-17 | 76 | 1 | nan | 12.7 | 9.4 | 29.8 | 17 | 15.6 | 27.4 | 25.4 | 27.4 | |||
| 2021-03-17 | 76 | Avg | 0-15cm | 0 | 0 | |||||||||
| 2021-03-17 | 76 | Avg | 15-30cm | 0 | 0 | |||||||||
| 2021-03-17 | 76 | Avg | 30-45cm | 0 | 0 | |||||||||
| 2021-03-17 | 76 | Avg | 45-60cm | 0 | 0 |
No TZ grass heigth found
No VR grass heigth found
No VR Tree DBH found
No water potential data found
No VR Grass Biomass data found
No VR OakLeaves Biomass data found
No VR PineNeedles Biomass data found
3 photos found

20210317VR_Leaves.jpg ( 2021-03-17 00:00:00 ) Full size: 1920x1440
A few of the trees have begun to put on leaves

20210316VR_GrassOutside.jpg ( 2021-03-16 00:00:00 ) Full size: 1440x1920
Grazed grass outside of fences. GCC = 0.3836

IMG_3128.jpg ( 2021-03-17 09:40:48 ) Full size: 1440x1920
Ungrazed grass inside fence GCC = 0.3478
9 sets found
16 VR_met graphs found
2 VR_flux graphs found
2 VR_soilco2 graphs found
2 VR_pond graphs found
Can't check TZVR_mixed
3 VR_fd graphs found
4 VR_processed graphs found
4 VR_arable graphs found
No data found for VR_soilvue.

