Field Notes

<--2020-03-05 13:50:00 | 2020-03-21 15:32:00-->
Other sites visited today: East End | Mayberry | West Pond
Phenocam link: Searching...

Sherman Wetland: 2020-03-11 15:25:00 (DOY 71)
Author: Daphne Szutu
Others: Joe

Summary: Checked solar charge controller and batteries

2020-03-11
Sherman Wetland

Joe and I arrived at 15:25 PDT. It was a mild and breezy day with blue skies and low cumulus clouds. The water level was 83 cm.

Joe checked the solar charge controller and batteries, because the power has been spiking down below 12V and we’ve been losing data during the day. The charge controller screen was all black, and there was no change when it was restarted. Joe will look into upgrading the charge controller firmware.

I downloaded met data. The eosGP CO2 and T data are still spiky. I pulled the sensor out of the water, removed the mesh, and swished the sensor around in the wetland to rinse the little bit of duckweed and critters out. I put the mesh back on and lowered the sensor again. I’ll keep an eye on it. I wonder if it's related to the power fluctuations.

We left at 15:55 PDT.

1 photos found

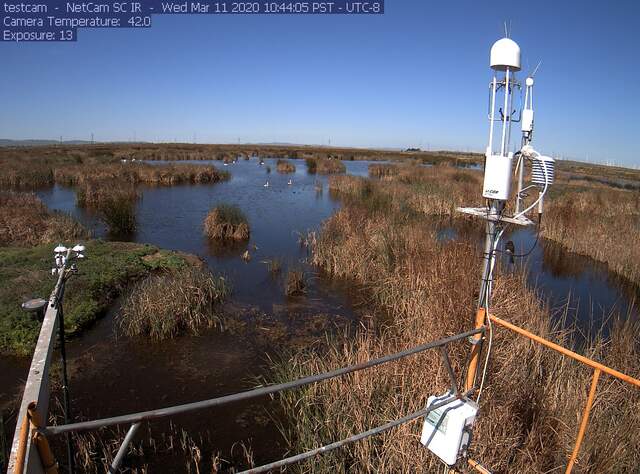
Black phoebe on HMP cable
siwetland_2020_03_11_104405.jpg ( 2020-03-11 10:59:06 ) Full size: 1296x960
Black phoebe on HMP cable

Graphs display:
7 sets found

Can't check MBWPEESWGT_mixed
Can't check MBEEWPSWEPGT_cam
16 SW_met graphs found

Explore the graph:Temperatures in a new window

Explore the graph:Water Temperature Profile A in a new window

Explore the graph:Water Temperature Profile B in a new window

Explore the graph:Soil Temperature Profile C2 in a new window

Explore the graph:Soil Heat Flux in a new window

Explore the graph:Four channel Radiometer in a new window

Explore the graph:Sherman Wetland PAR in a new window

Explore the graph:PRI Channels in a new window

Explore the graph:NDVI Channels in a new window

Explore the graph:Water level and Rain in a new window

Explore the graph:Dissolved CO2 in a new window

Explore the graph:Air Pressure in a new window

Explore the graph:Battery Voltage and RH in a new window

Explore the graph:Soil Temperature Profile C1 in a new window

Explore the graph:SRS NDVI and PRI in a new window

Explore the graph:SW miniDOT Dissolved Oxygen in a new window

4 SW_flux graphs found

Explore the graph:CO2 and H2O in a new window

Explore the graph:Wind in a new window

Explore the graph:Methane in a new window

Explore the graph:Data Counts in a new window

Can't check MBSWEEWPBCBA
Can't check SW_Temp
14 SW_Temp graphs found

Explore the graph:Temperatures in a new window

Explore the graph:CO2 and H2O in a new window

Explore the graph:Wind in a new window

Explore the graph:Methane in a new window

Explore the graph:Data Counts in a new window

Explore the graph:Temperature Profile A in a new window

Explore the graph:Temperature Profile B in a new window

Explore the graph:Temperature Profile C in a new window

Explore the graph:Soil Heat Flux in a new window

Explore the graph:Four-channel radiometer in a new window

Explore the graph:NDVI Channels in a new window

Explore the graph:PAR in a new window

Explore the graph:Air Pressure and Water Level in a new window

Explore the graph:Air T and RH in a new window

3 SW_arable graphs found

Explore the graph:Incoming Solar Bands in a new window

Explore the graph:Reflected Solar Bands in a new window

Explore the graph:Solar Radiation in a new window