Field Notes
<--2020-01-23 14:40:00 | 2020-02-20 13:20:00-->Other sites visited today: Sherman Wetland | East End | West Pond | Mayberry | Bouldin Alfalfa | Bouldin Corn
Phenocam link: Searching...
Sherman Barn: 2020-02-06 09:10:00 (DOY 37)
Author: Daphne Szutu
Others: Camilo
Summary: Regular data collection/cleaning, green grass, no cows, swapped 7500 for calibration, measured well level, few photos on camera card
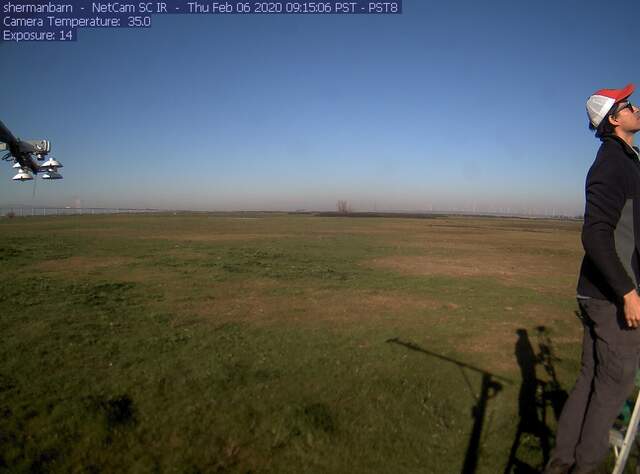
| 2020-02-06 Sherman Barn Camilo and I arrived at 9:10 PST. It was a clear, calm, and cool day. The grass is green and getting taller, especially in the area between the tower and our parking spot. We didn’t see any cows on the field, although we disturbed a group of brown ducks as we walked into the field. Camilo cleaned flux and rad sensors and took spectral measurements. The wash reservoir was full. I downloaded met, camera, gamecam, and USB GHG data. I swapped the desiccant for the water level sensor. We swapped the LI-7500: sn 75H-2668 came down and sn 75H-2669 went up. I uploaded a new calibration file, updated the pressure coefficients, and reset the box. Camilo measured water level: Distance from top of well to water level: 88.1cm (2.89ft) Distance from top of well to ground: 24.7cm (0.81ft) Distance from top of well to sensor: ?? Sensor psi reading: 0.653 psi ~ 46cm LI-7500 readings (sn 75H-2668 --> sn 75H-2668 after cleaning --> sn 75H-2669): CO2 479ppm --> 476 aft er cleaning --> 489 H2O 269ppm --> 330 after cleaning --> 316 T 8.1C --> 8.6 after cleaning --> 10.5 P 102.5kPa --> 102.5 after cleaning --> 102.3 SS 96--> 102 after cleaning --> 101 LI7700 readings: CH4 4.1ppm RSSI 29--> 72 after cleaning We left at 9:45 PST. Back in the lab, there were only a few days of photos on the camera card. Running the card through Recuva did not unearth any new photos. The card is old and should probably be replaced |
1 photos found

shermanbarn_2020_02_06_091506.jpg ( 2020-02-06 09:16:24 ) Full size: 1296x960
Camilo cleaning
3 sets found
4 SB_flux graphs found
15 SB_met graphs found
Can't check TATWBABCSB_cam

