Field Notes
<--2020-02-04 10:45:00 | 2020-02-20 13:50:00-->Other sites visited today: Sherman Barn | East End | West Pond | Mayberry | Bouldin Alfalfa | Bouldin Corn
Phenocam link: Searching...
Sherman Wetland: 2020-02-06 10:05:00 (DOY 37)
Author: Daphne Szutu
Others: Camilo
Summary: Permanent tower: Regular cleaning/collection, swapped 7500 for calibration, measured water/sensor heightsTemporary tower: Regular cleaning/collection, measured sonic orientation, measured veg height
| 2020-02-06 Sherman Wetland Camilo and I arrived at 10:05 PST. It was a sunny and cool day with hazy horizons. The wetland is brown, except for clumps of green tule. There were many snow geese in the field under the Antioch bridge, south of the gravel road (southeast of the tower). The water level was 81 cm. Camilo cleaned flux and rad sensors. The wash reservoir was 4/5 full; we topped it off. I downloaded met, camera, and USB GHG data. I also swapped the desiccants for the water level sensor and miniDOT, but did not get the miniDOT data because I forgot the miniUSB cable. We swapped the LI-7500: sn 0073 came down and sn 75H-2180 went up. I uploaded a new calibration file, updated the pressure coefficients, and reset the box.
LI-7500 readings (sn 0073 --> sn 0073 after cleaning --> sn 75H-2180):
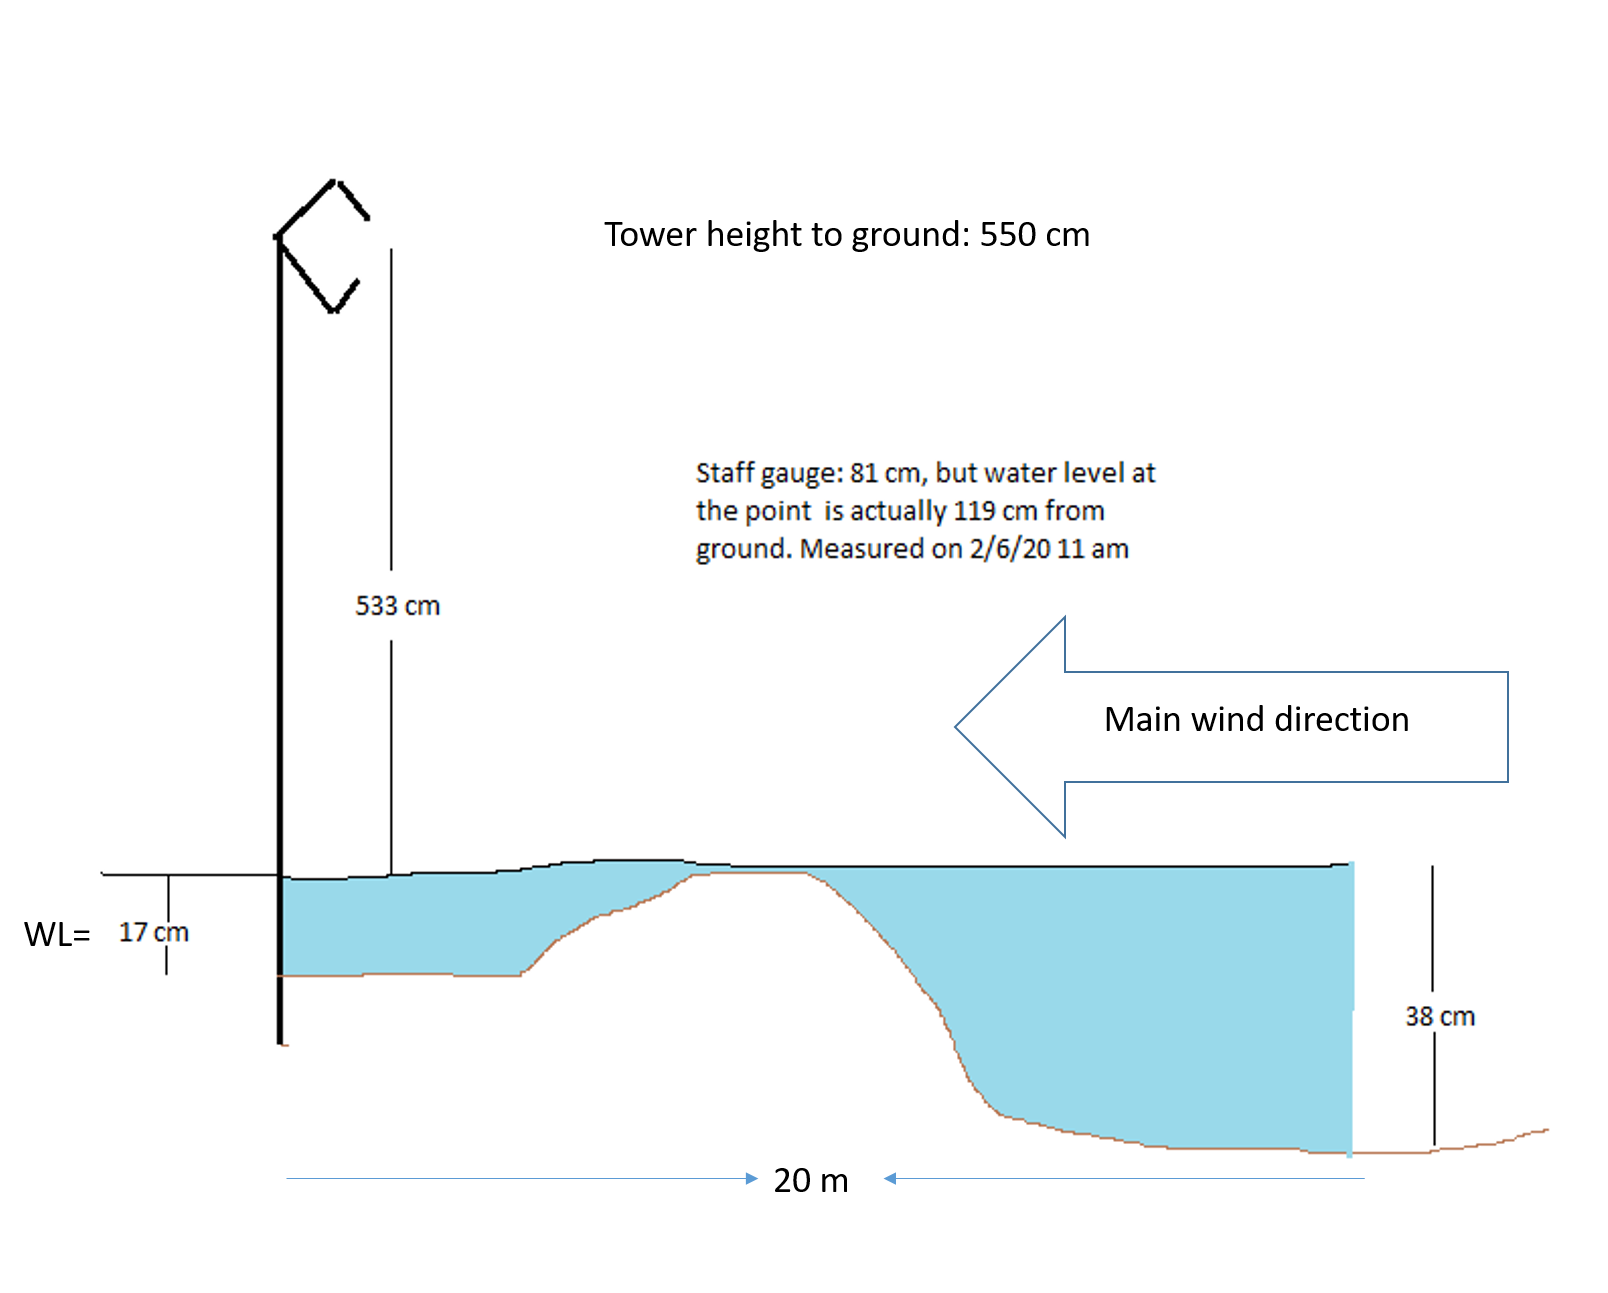
Camilo measured some water/sensor heights around the site and made the diagram below. We left at 10:45.
2020-02-06 Sherman Wetland Temporary Tower Camilo and I arrived at 10:55. It was a sunny and cool day with hazy horizons. There was lots of cattail fluff flying in the air and on the ground around our tower. There was no water under the tower. Camilo cleaned flux and rad sensors. I downloaded met, camera, and USB GHG data. I changed the 7550 box sn AIU-0650 nickname from EP-0650 to SWTT-0650. There was a 7700 clock sync error which resolved after I reset the 7550 box. The reservoir was full. We added a missing bolt for the 4-way radiometer and swapped the pi-cam mount (conduit hanger) for one that fit better. The fence post needs a drilled hole before we can add a new turnbuckle and chain. Camilo measured the sonic orientation (average between the compass and his phone): 29 deg true N I measured the veg height near the tower. It was an even distribution between knocked down veg (50 cm height), mid-height clumps (150 cm height), and tall clumps (~300 cm height). So, the average veg height is 150 cm, but it’s quite heterogenous. There were many sleepy wasps in the datalogger box; I left some mothballs for them.
LI-7500 readings: We left at 11:35 PST. |
3 photos found
20200206SW_SWTempTower.JPG ( 2020-02-06 11:39:10 ) Full size: 1920x1440
Temporary tower set up at Sherman Wetland, 1250m upwind of the permanent tower.
20200206SW_TempTowerSolar.JPG ( 2020-02-06 11:39:16 ) Full size: 1440x1920
Temporary tower solar panel set up at Sherman Wetland, 1250m upwind of the permanent tower.

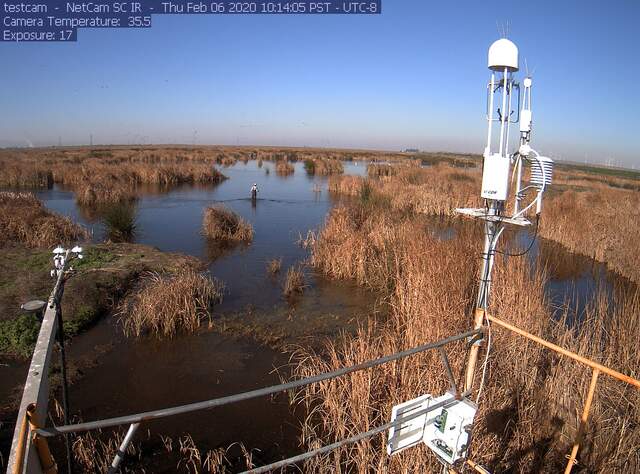
siwetland_2020_02_06_101405.jpg ( 2020-02-06 10:29:44 ) Full size: 1296x960
Camilo measuring water level around tower
7 sets found
Can't check MBWPEESWGT_mixed
Can't check MBEEWPSWEPGT_cam
16 SW_met graphs found
4 SW_flux graphs found
Can't check MBSWEEWPBCBA
Can't check SW_Temp
14 SW_Temp graphs found
3 SW_arable graphs found


