
Field Notes
<--2019-11-19 09:00:00 | 2019-12-13 10:00:00-->Other sites visited today: Bouldin Alfalfa
Phenocam link: Searching...
Bouldin Corn: 2019-12-02 11:30:00 (DOY 336)
Author: Daphne Szutu
Others: Joe
Summary: Tower had fallen over because of high winds, disassembled tower and brought all sensors back to lab, downloaded FD chambers
| 2019-12-02 Bouldin Corn Joe and I arrived around 11:30 after Tyler texted us a photo of the Bouldin Corn tower laying on the ground. It was an overcast and cool day and had been raining for the past 2-3 days. Our field was not flooded yet, but the field to the north was. Looking at the data back in the lab, the tower lost power around 19:00 on 2019-11-26. At that time, the 30-minute average wind speed was about 10 m/s, and the 20Hz wind speed was about 20 m/s. One fence post and the round radiometer boom were bent into an L-shape. The other structures looked ok. We disassembled the tower and brought back all the sensors for testing. We left the scaffolding and eddy post there at the edge of the field. The power cable going to the tower had been yanked loose from the AC-DC converter. Joe cut off about 1 m of conduit to find the end of the cable and reconnected it. We pulled the other end of the power cable into Tyler's data logger box and used it to power our three FD chambers with ~23V. I downloaded data from the three FD chambers. Visible major damage: - The 4-way radiometer has half of its sensors disconnected - the sonic had one traducer missing (did not find it) - 7700 spars were probably torqued - cracking visible on one - PurpleAir was full of water from being upside down Sensors removed and brought back to the lab: Arable II sn C002445 Arable I sn A001359 Purple Air sn 68c63acc07a9 Decagon NDVI sensors sn 882103020, sn 2046503357 Decagon PRI sensors sn 897103002, sn 913003004 Stardot camera sn 0030F4D21491 PAR sensors sn 140441, sn 140453 Diffuse PAR sensor sn 140456 Soil moisture sensors sn M003370, sn 17133, sn 17129, sn 17128 Heat flux plates sn 11326, sn 10867, sn 10861 Water level sensor sn 70011234 DF Robot range finder sn URM06-001 Precipitation tipping bucket sn 65548-615 Barometer sn L2340502 Air T/RH sensor sn L1740395 CR1000 sn 66251 CR10x sn 31308 AM16/32B sn 21690 AM25T sn 7908 Three soil thermocouple profiles (bottom 1/3 of the rod was dry when I pulled them out of the ground) Anemometer sn 074417 LI-7700 sn TG1-0155 LI-7500A sn 0042 LI-7550 sn AIU-0614 We left around 14:45 to go to BA and check on the other sites. All other sites (BA, WP, EP, EE, SW, and MB) had standing towers and solar panels. We did not visit SB, but Tyler visited the same day and did not tell us about any apparent destruction. We plan to put the tower back up in the next week or two. Since we are planning on taking down East Pond next month, we will borrow the LI-7700 from East Pond for this tower (i.e., EP will not have methane data for the last few weeks of the year). |
5 photos found
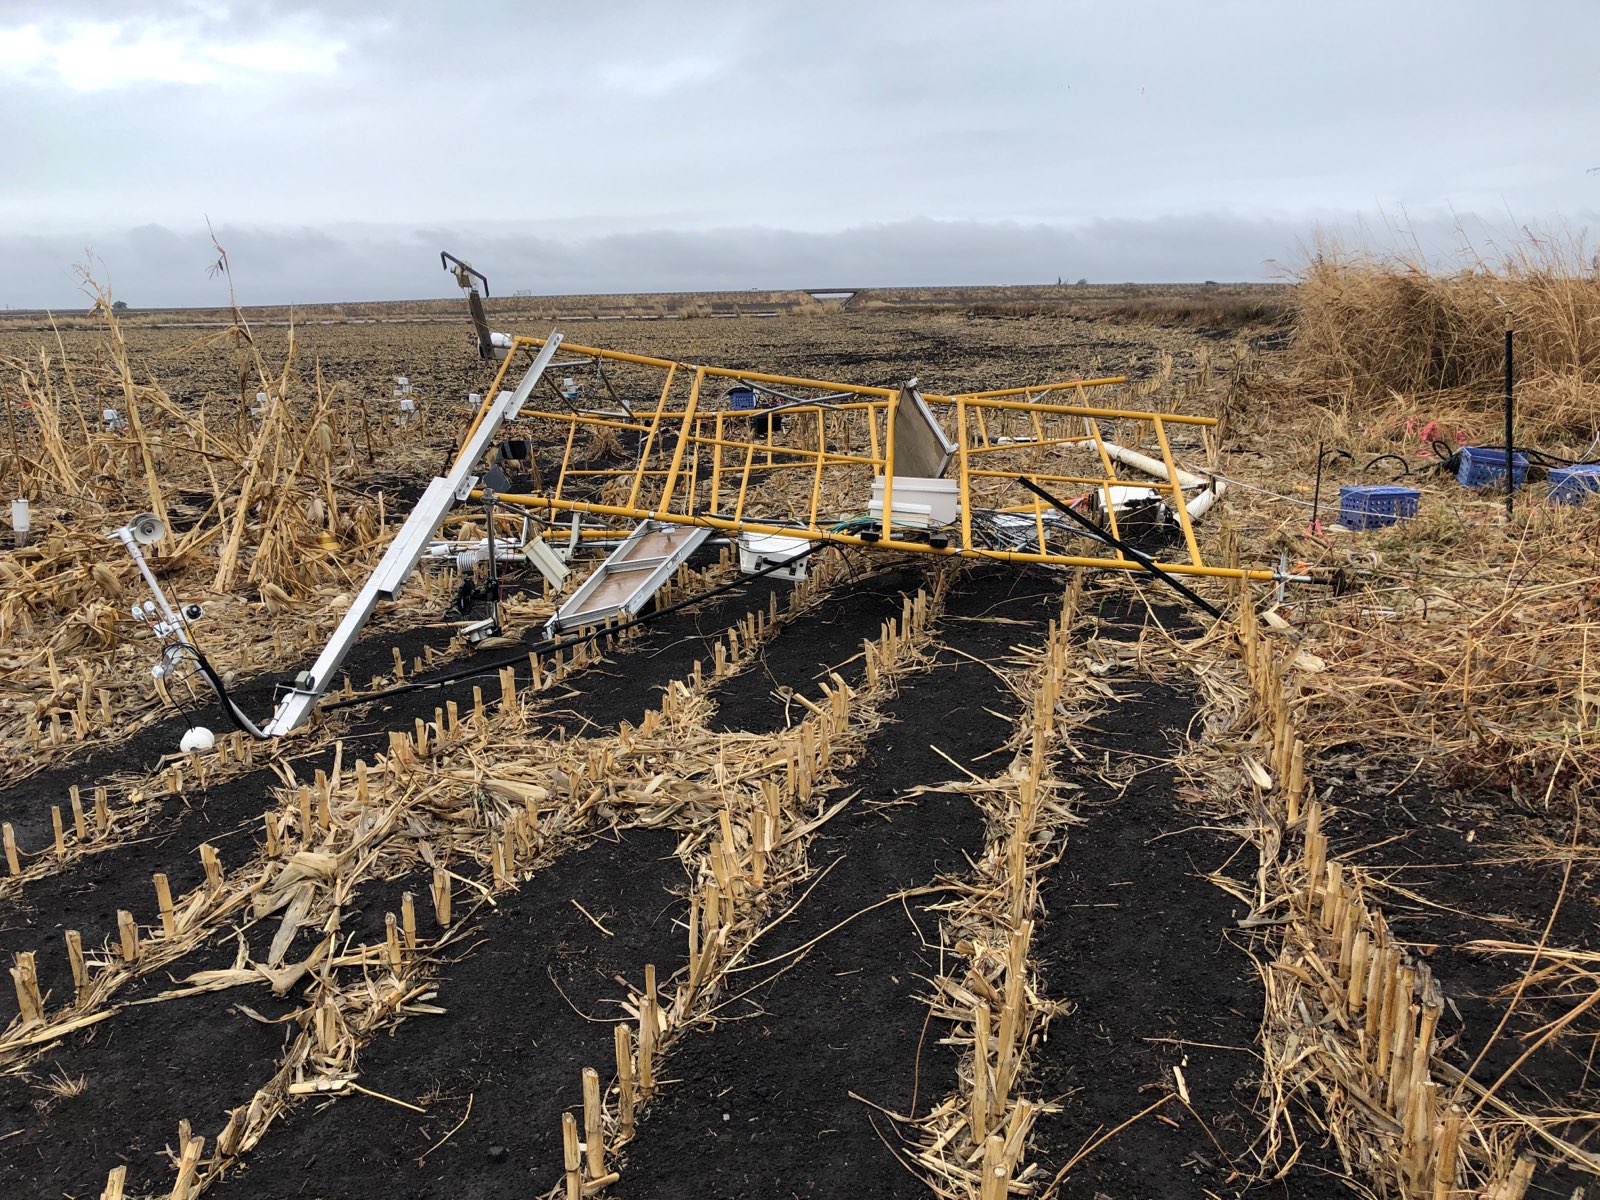
20191202BC_FallenTower.jpg ( 2019-12-02 00:00:00 ) Full size: 1600x1200
Bouldin Corn tower that fell down on during a wind/rain storm on 2019-11-26.
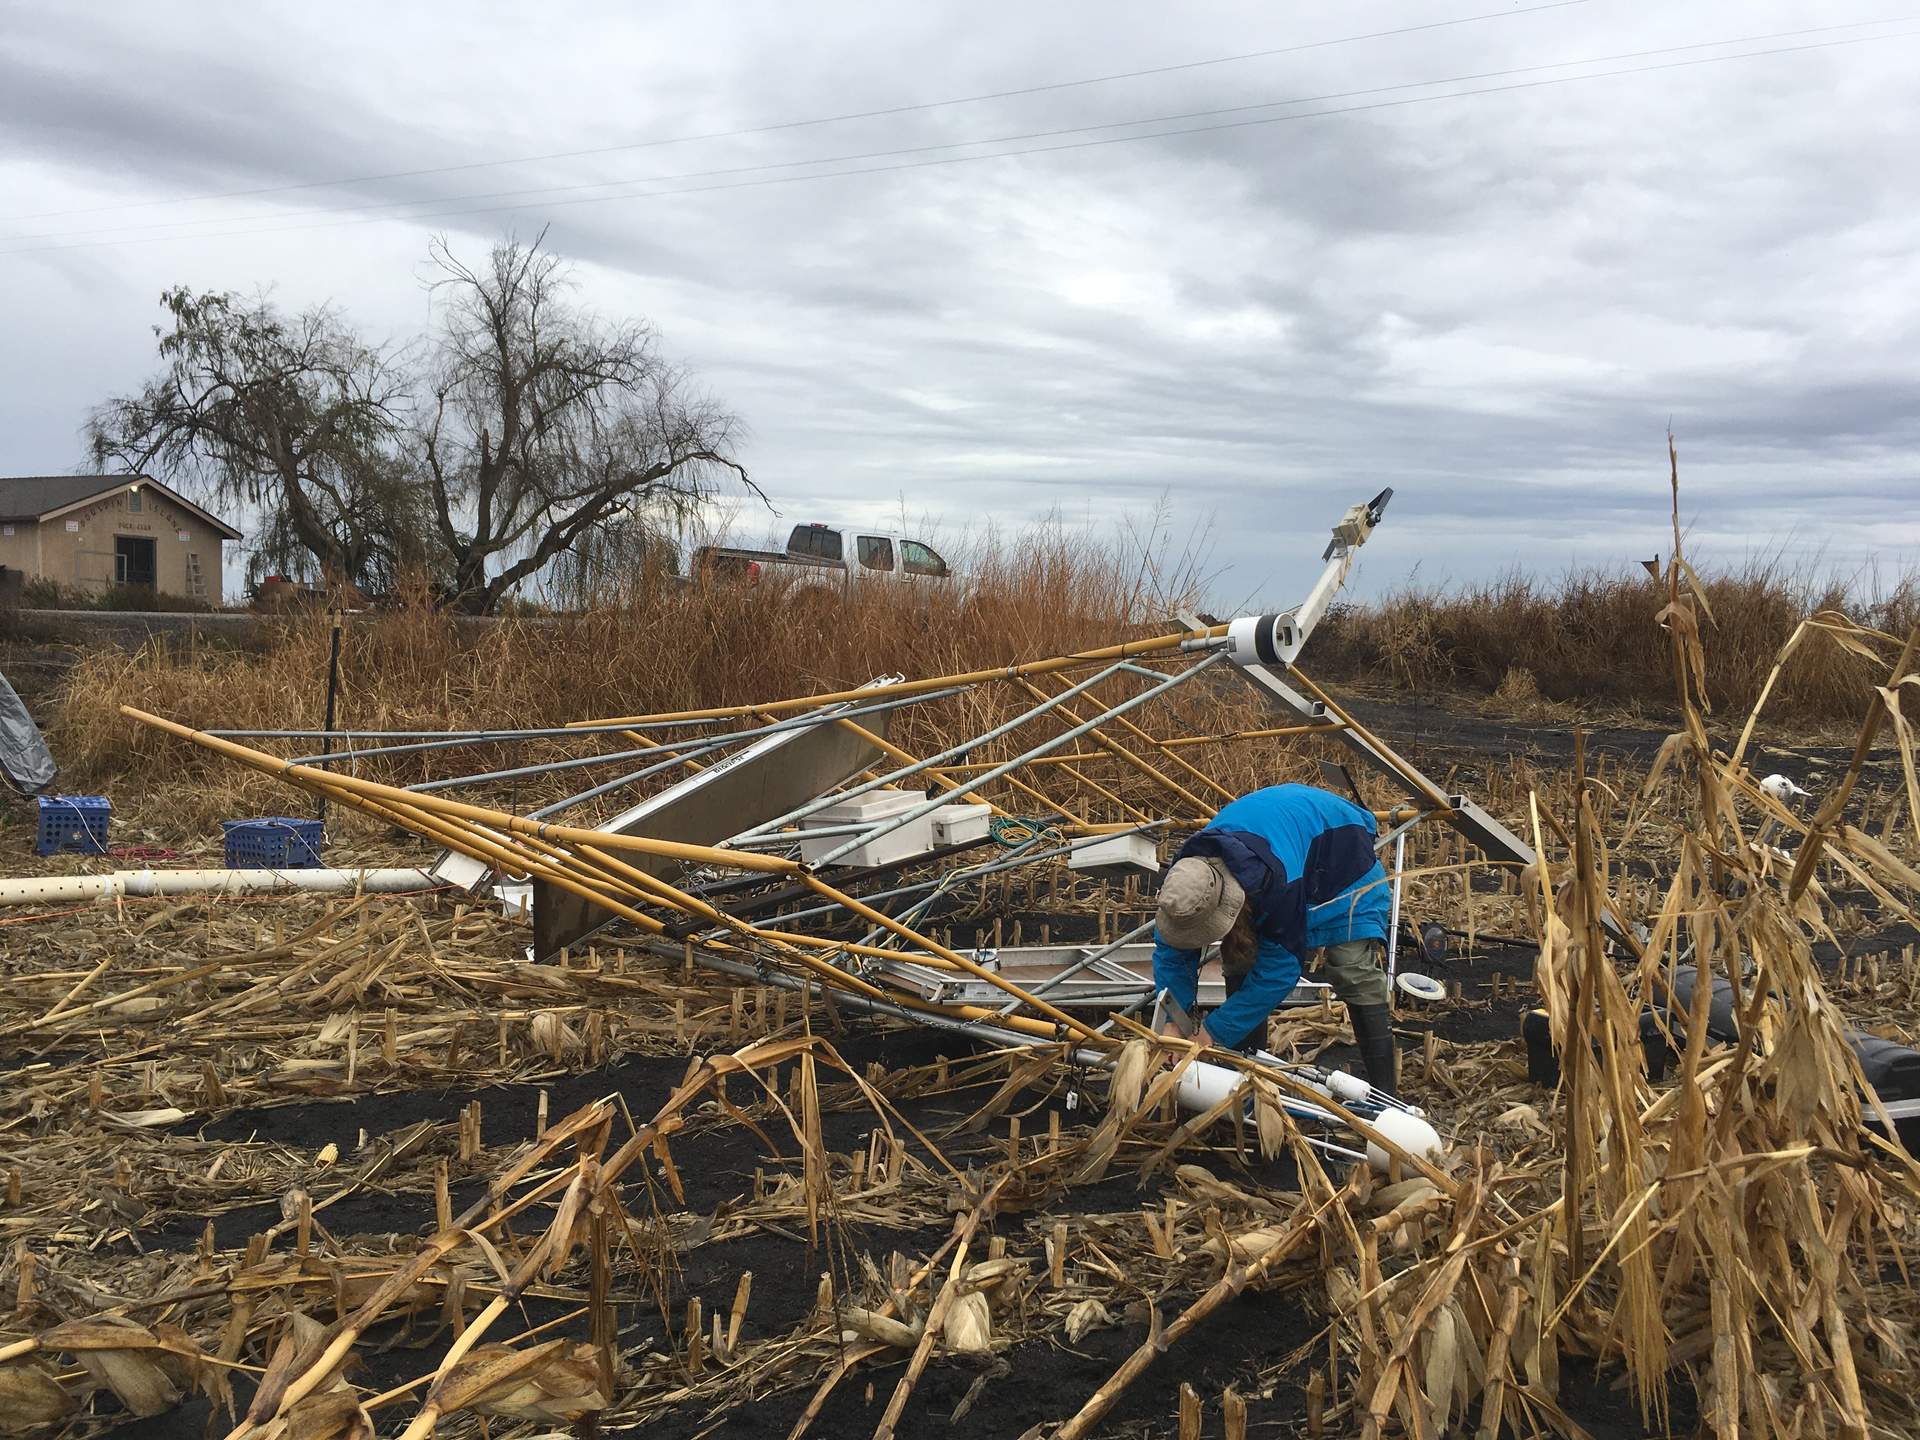
20191202BC_FallenTowerJoe.JPG ( 2019-12-02 12:41:56 ) Full size: 1920x1440
Joe taking off sensors from Bouldin Corn tower that fell down on during a wind/rain storm on 2019-11-26.
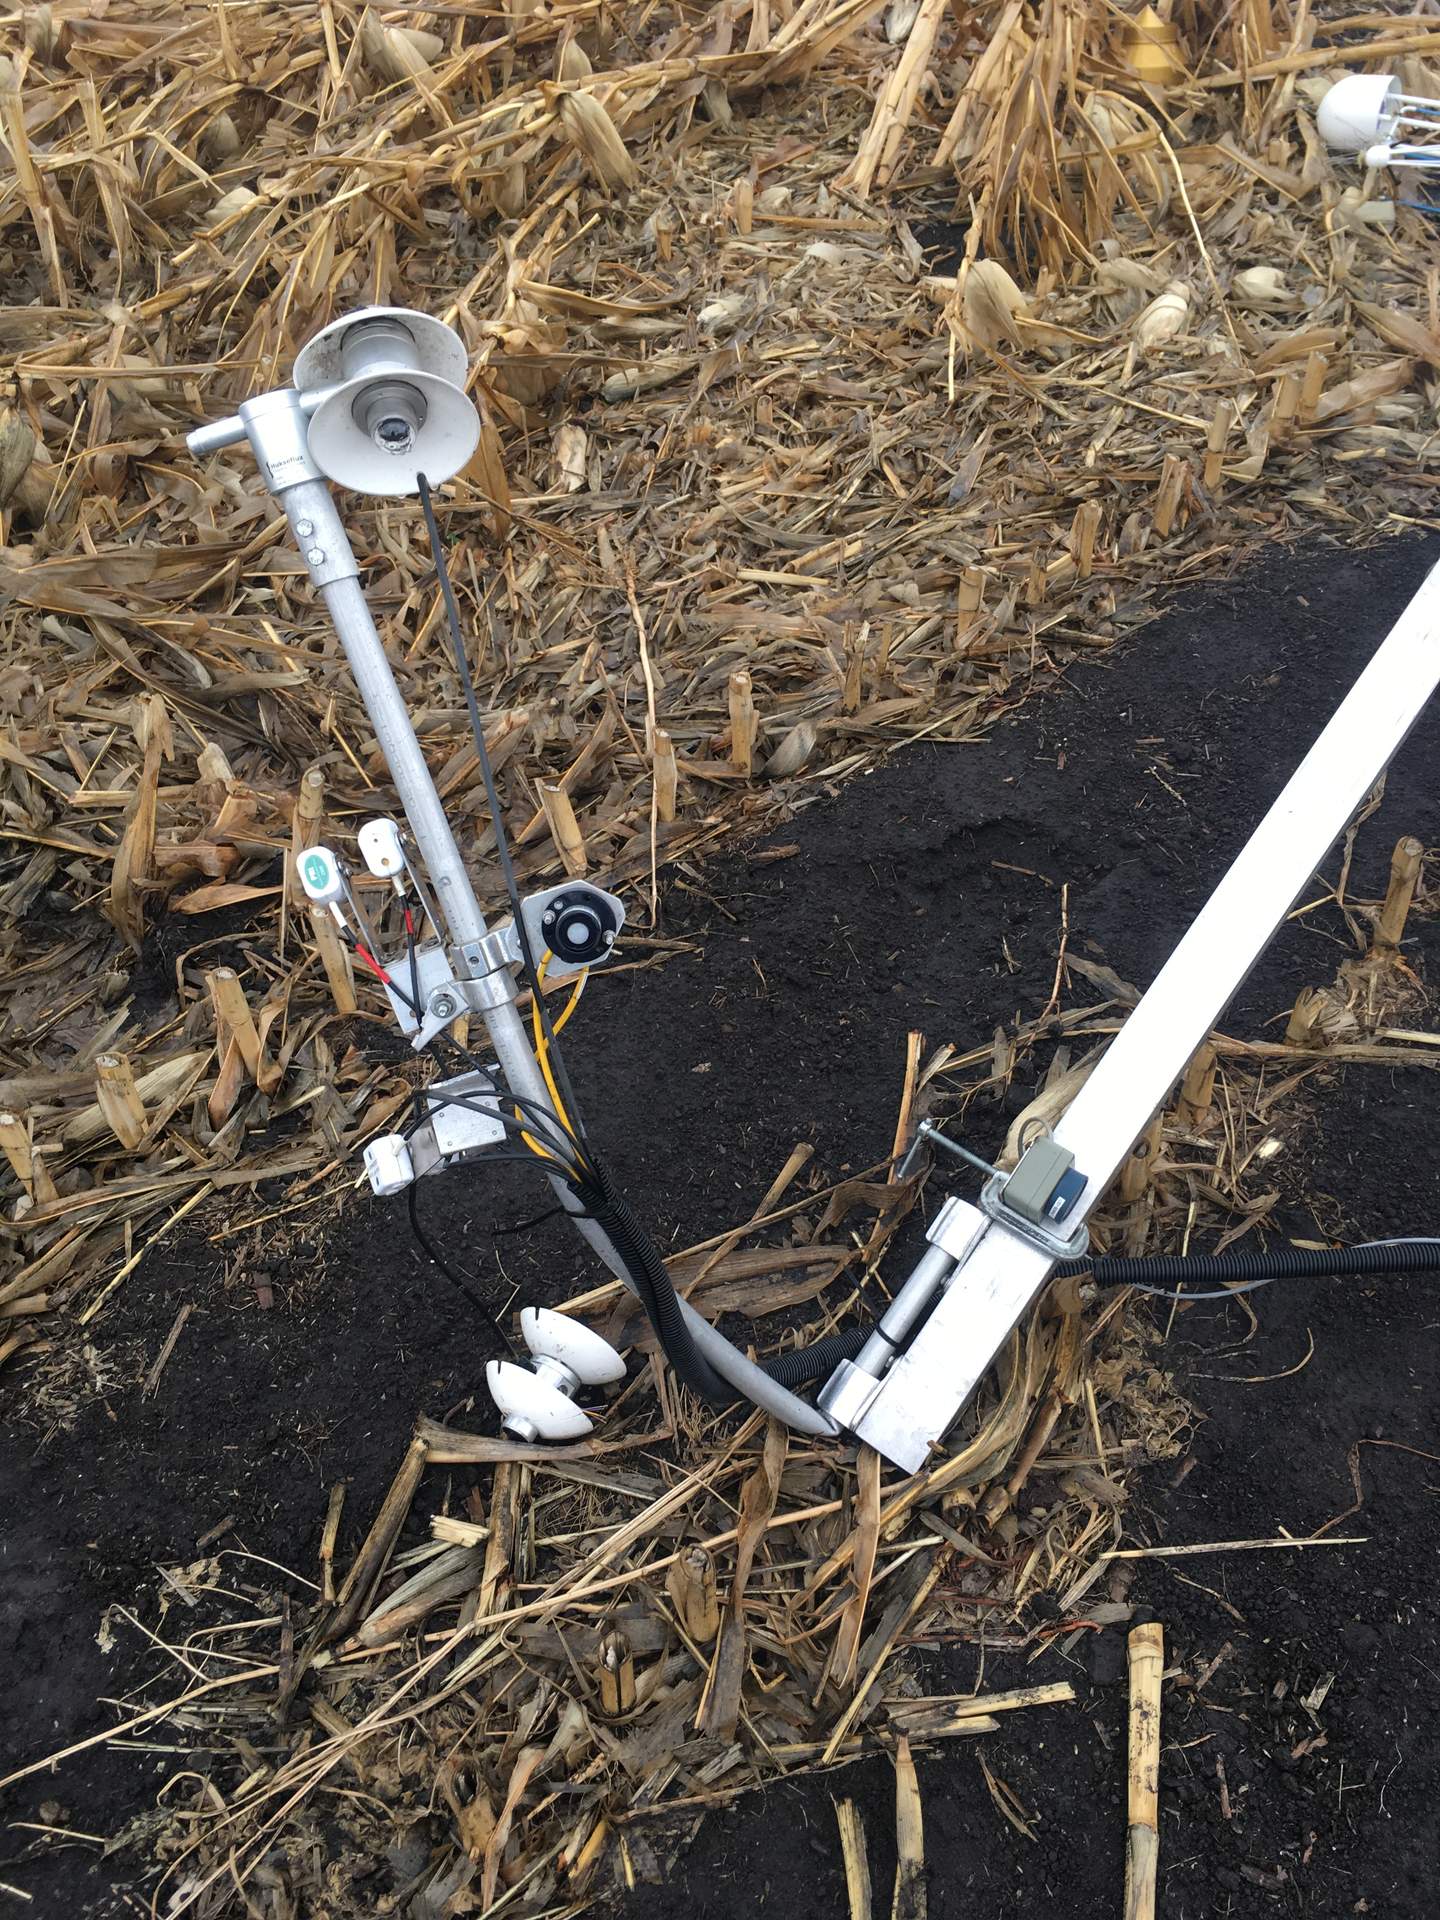
20191202BC_Radiometers.jpg ( 2019-12-02 00:00:00 ) Full size: 1440x1920
Radiometer boom bent and NR01 broken
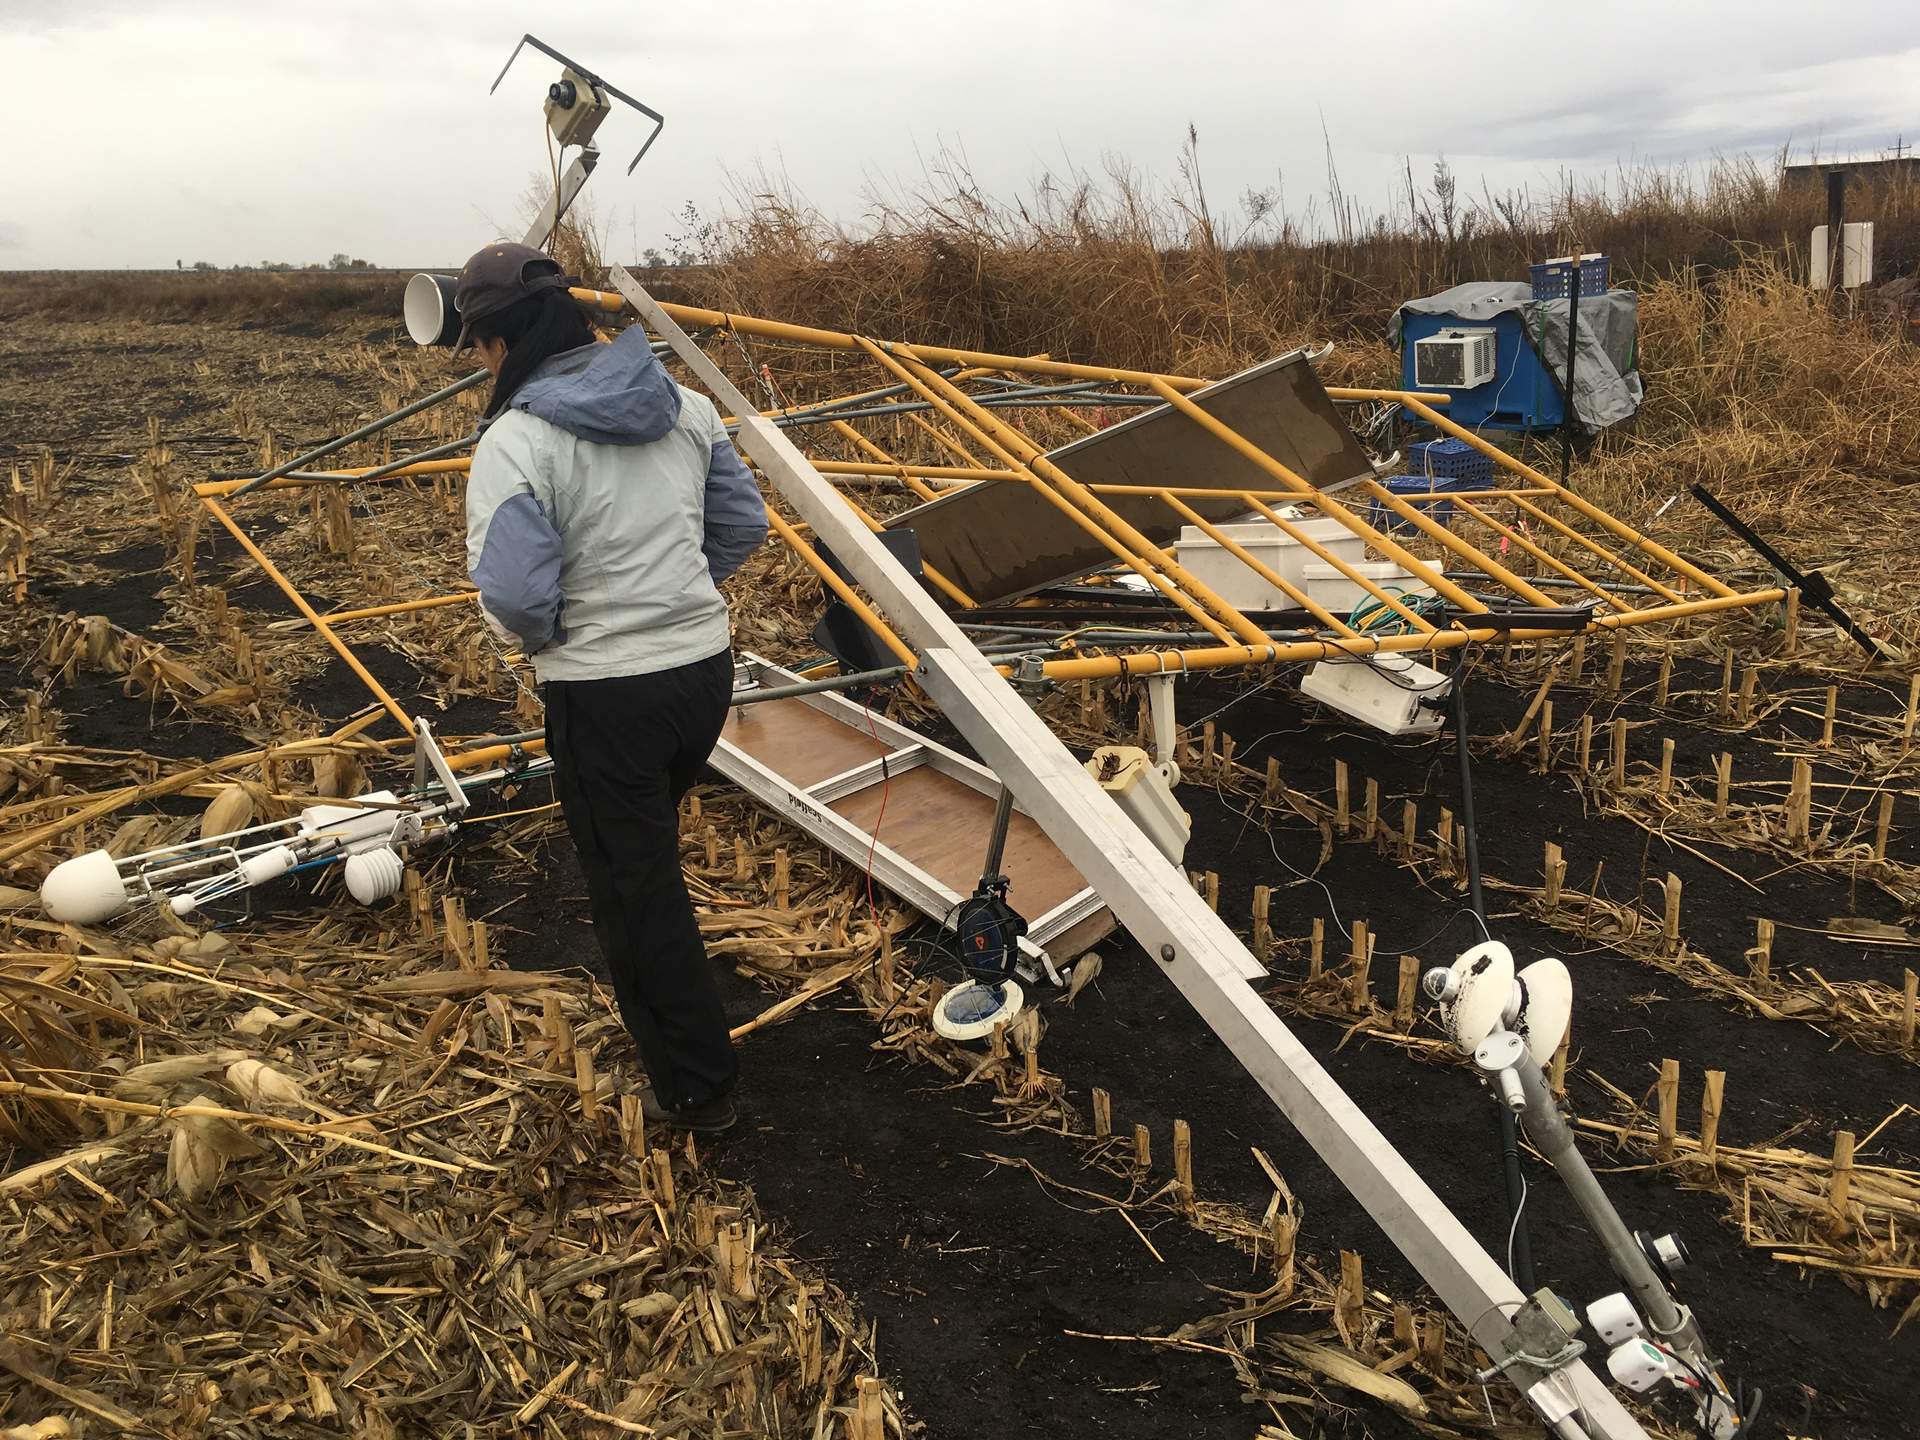
20191202BC_TowerDown.jpg ( 2019-12-02 00:00:00 ) Full size: 1920x1440
Tower fell in the storm November 26th
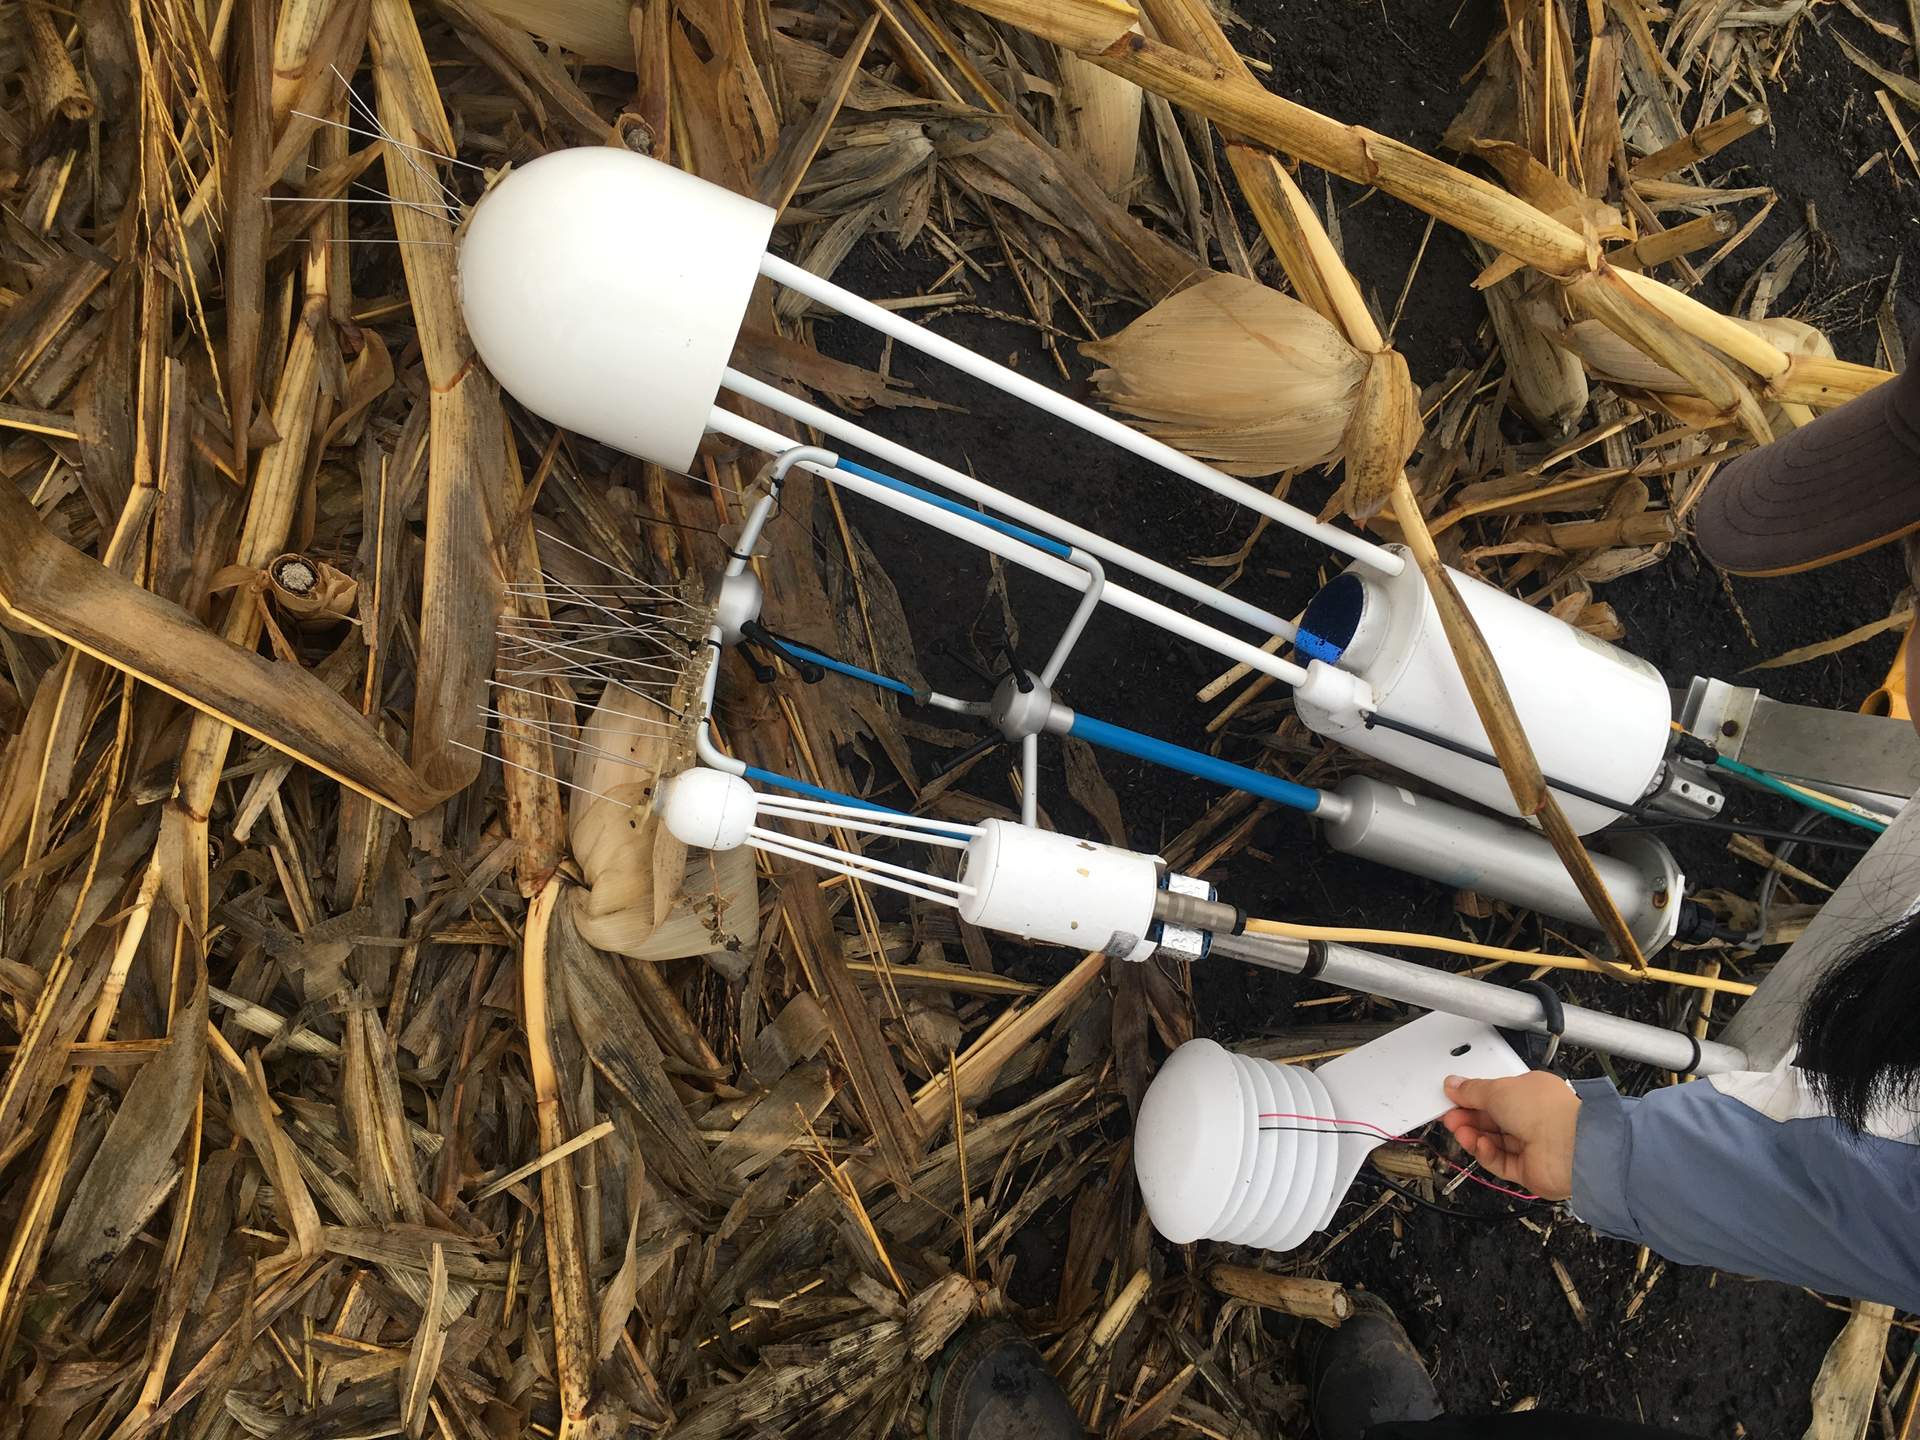
20191202BC_EddySensors.jpg ( 2019-12-02 00:00:00 ) Full size: 1920x1440
Eddy sensors. Sonic lost a transducer.
6 sets found
17 BC_met graphs found
5 BC_flux graphs found
Can't check TATWBABCSB_cam
Can't check MBSWEEWPBCBA
2 BC_pa graphs found
1 BC_arable graphs found