Field Notes

<--2019-03-14 13:25:00 | 2019-04-11 12:35:00-->
Other sites visited today: Mayberry | Sherman Barn | Sherman Wetland | West Pond | East Pond | Bouldin Alfalfa | Bouldin Corn

East End: 2019-04-03 12:30:00 (DOY 93)
Author: Daphne Szutu
Others: Kyle, Camilo

Summary: Regular data collection/cleaning

2019-04-03
East End

Kyle, Camilo, and I arrived at 12:30. It was an overcast and cool day with big, fluffy cumulus clouds. The water level was 34 cm.

Kyle cleaned flux and rad sensors; there were a lot of cattail fluff and spiderwebs in the 7700. The wash reservoir was empty; we refilled it. I downloaded met, camera, USB GHG, and miniDOT data. The Nikon camera was out of batteries so we did not take a reference GCC photo.

LI-7500 readings:
CO2 425ppm
H2O 560ppm
T 16.7C
P 101.7kPa
SS 102--> 106 after cleaning
LI7700 readings:
CH4 1.97ppm
RSSI 20--> 80 after cleaning


Camilo walked around in the wetland trying to collect enough methane in a funnel (precipitation bucket funnel) to light on fire, but there wasn’t as much as he hoped.

We left at 12:55.

2 photos found

Camilo disturbing the wetland soil with a hoe and collecting methane in the funnel (precipitation bucket funnel), trying to collect enough to make an appreciable flame.
20190403EE_CamiloMethaneFunnel.JPG ( 2019-04-03 12:53:21 ) Full size: 1080x1440
Camilo disturbing the wetland soil with a hoe and collecting methane in the funnel (precipitation bucket funnel), trying to collect enough to make an appreciable flame.

Frog blending in with mosquito fern (azolla).
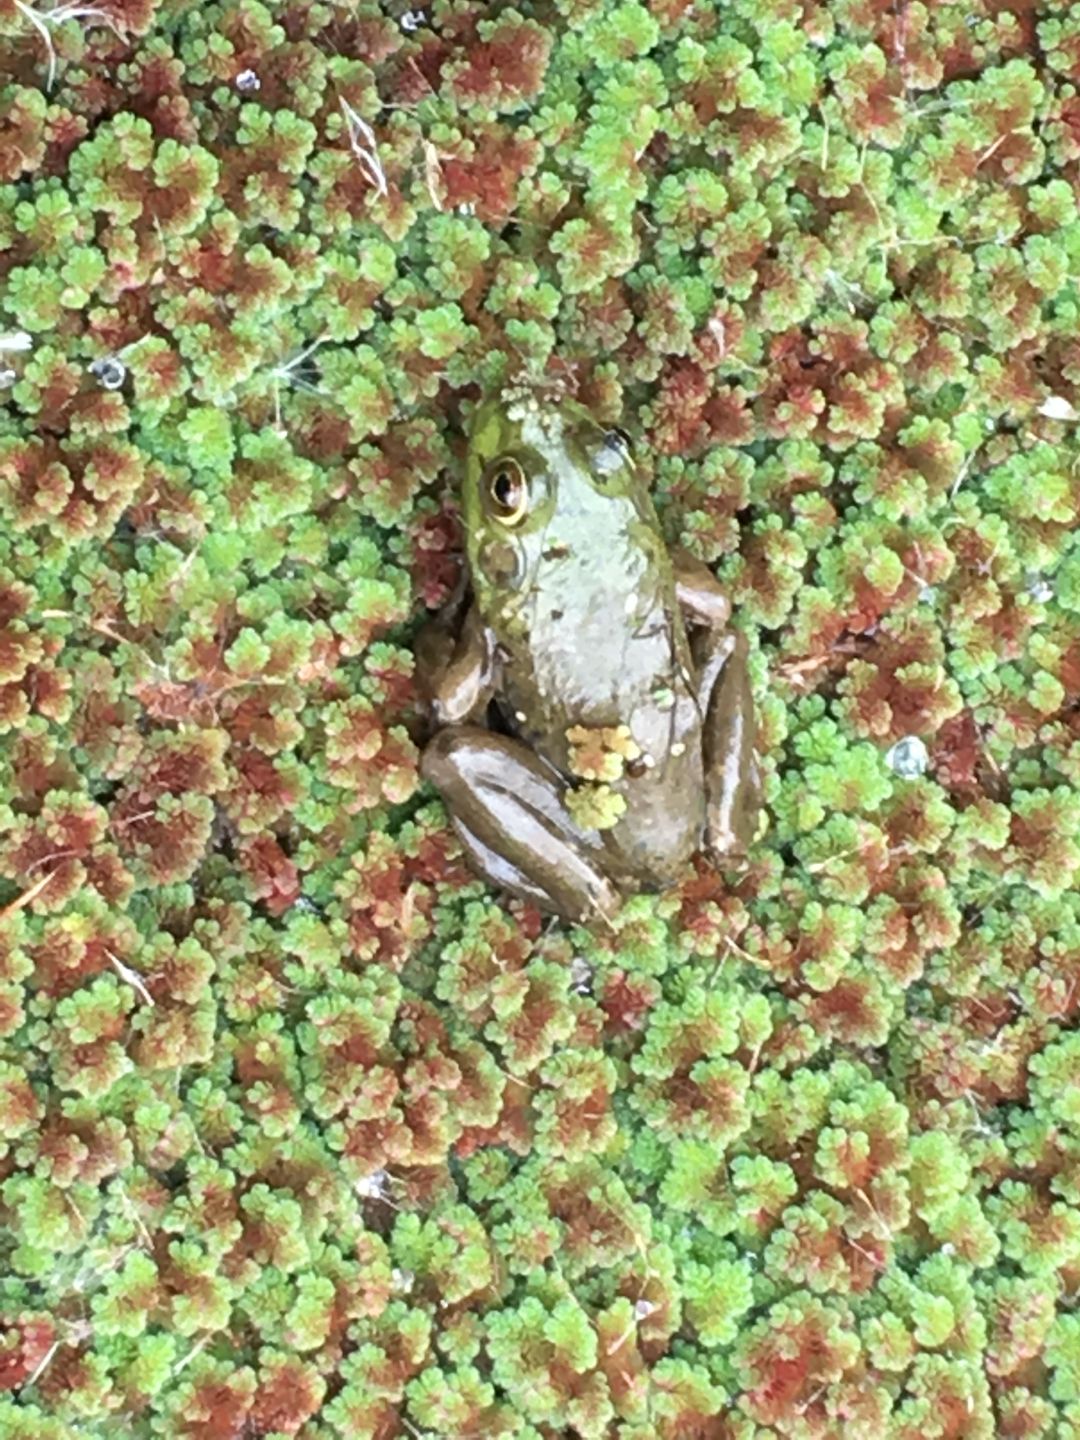
20190403EE_FrogAzolla.JPG ( 2019-04-03 12:53:02 ) Full size: 1080x1440
Frog blending in with mosquito fern (azolla).

Graphs display:
11 sets found

14 EE_met graphs found

Explore the graph:Temperature and Batt V in a new window

Explore the graph:Soil Moisture and Well Pressure in a new window

Explore the graph:Solar Radiation in a new window

Explore the graph:PAR in a new window

Explore the graph:Soil Heat Flux in a new window

Explore the graph:Water Level and Rain in a new window

Explore the graph:Soil/Water Temperature Set 1 in a new window

Explore the graph:Soil/Water Temperature Set 2 in a new window

Explore the graph:Soil/Water Temperature Set 3 in a new window

Explore the graph:Dissolved Oxygen and Wind Speed in a new window

Explore the graph:SRS NDVI Channels in a new window

Explore the graph:Apogee NDVI in a new window

Explore the graph:NDVI in a new window

Explore the graph:Undercanopy PAR in a new window

Can't check EE_mixed
1 EE_mixed graphs found

Explore the graph:Air Pressure and RH in a new window

8 EE_flux graphs found

Explore the graph:Wind Speeds in a new window

Explore the graph:LI7500 CO2 and H2O in a new window

Explore the graph:LI7700 CH4 and RSSI in a new window

Explore the graph:Flux Counts in a new window

Explore the graph:Instument Temperatures in a new window

Explore the graph:Temp Tower 3 (Mixed Veg) in a new window

Explore the graph:Temp Tower 3 (Mixed Veg) in a new window

Explore the graph:Temp Tower 3 (Mixed Veg) in a new window

Can't check MBWPEESWGT_mixed
1 EE_cam graphs found

Explore the graph:EE Autocam GCC in a new window

Can't check MBEEWPSWEPGT_cam
Can't check SIMBTWEE_met
Can't check EE_Temp
5 EE_Temp graphs found

Explore the graph:Sonic SOS in a new window

Explore the graph:LI7500 CO2 in a new window

Explore the graph:Water Level in a new window

Explore the graph:LI-7700 CH4 in a new window

Explore the graph:Wind Speed in a new window

Can't check EE_minidot
1 EE_minidot graphs found

Explore the graph:EE miniDOT Dissolved Oxygen in a new window

Can't check MBSWEEWPBCBA
1 EE_processed graphs found

Explore the graph:CO2 Fluxes in a new window