
Field Notes
<--2019-02-22 11:20:00 | 2019-03-14 13:25:00-->Other sites visited today: Bouldin Alfalfa | Bouldin Corn | East Pond | Sherman Wetland | West Pond | Mayberry | Sherman Barn
Phenocam link: Searching...
East End: 2019-02-28 12:25:00 (DOY 59)
Author: Daphne Szutu
Others: Camilo, Robert
Summary: Regular data collection/cleaning, reference GCC photo, attached miniDOT to plastic chain
| 2019-02-28 East End We arrived at 12:25. It was partly sunny and mild with puffy clouds. The wetland is still very brown. Robert took a reference GCC picture with the lab camera from the upper boardwalk. The water level was 53 cm. I downloaded met, camera, USB, and miniDOT data. I copied all camera contents to the laptop. Camilo swapped the minidot desiccant and moved it from a string to a yellow plastic chain. One end of the chain is cable-tied to the tower, and the other end is cable-tied to the sensor. To make it easier to adjust the height of the sensor when water level changes, we put in a stainless steel carabiner to attach two loops of the chain together. Robert cleaned the flux and rad sensors. We refilled the wash reservoir. LI-7500 readings: CO2 426ppm H2O 421ppm T 15.6C P 102kPa SS 105--> 106 LI7700 readings: CH4 1.3ppm RSSI 58 --> 82 We left at 13:10. We u-turned at the next intersection to exit south along the gravel road instead of the soft levee roads. |
1 photos found
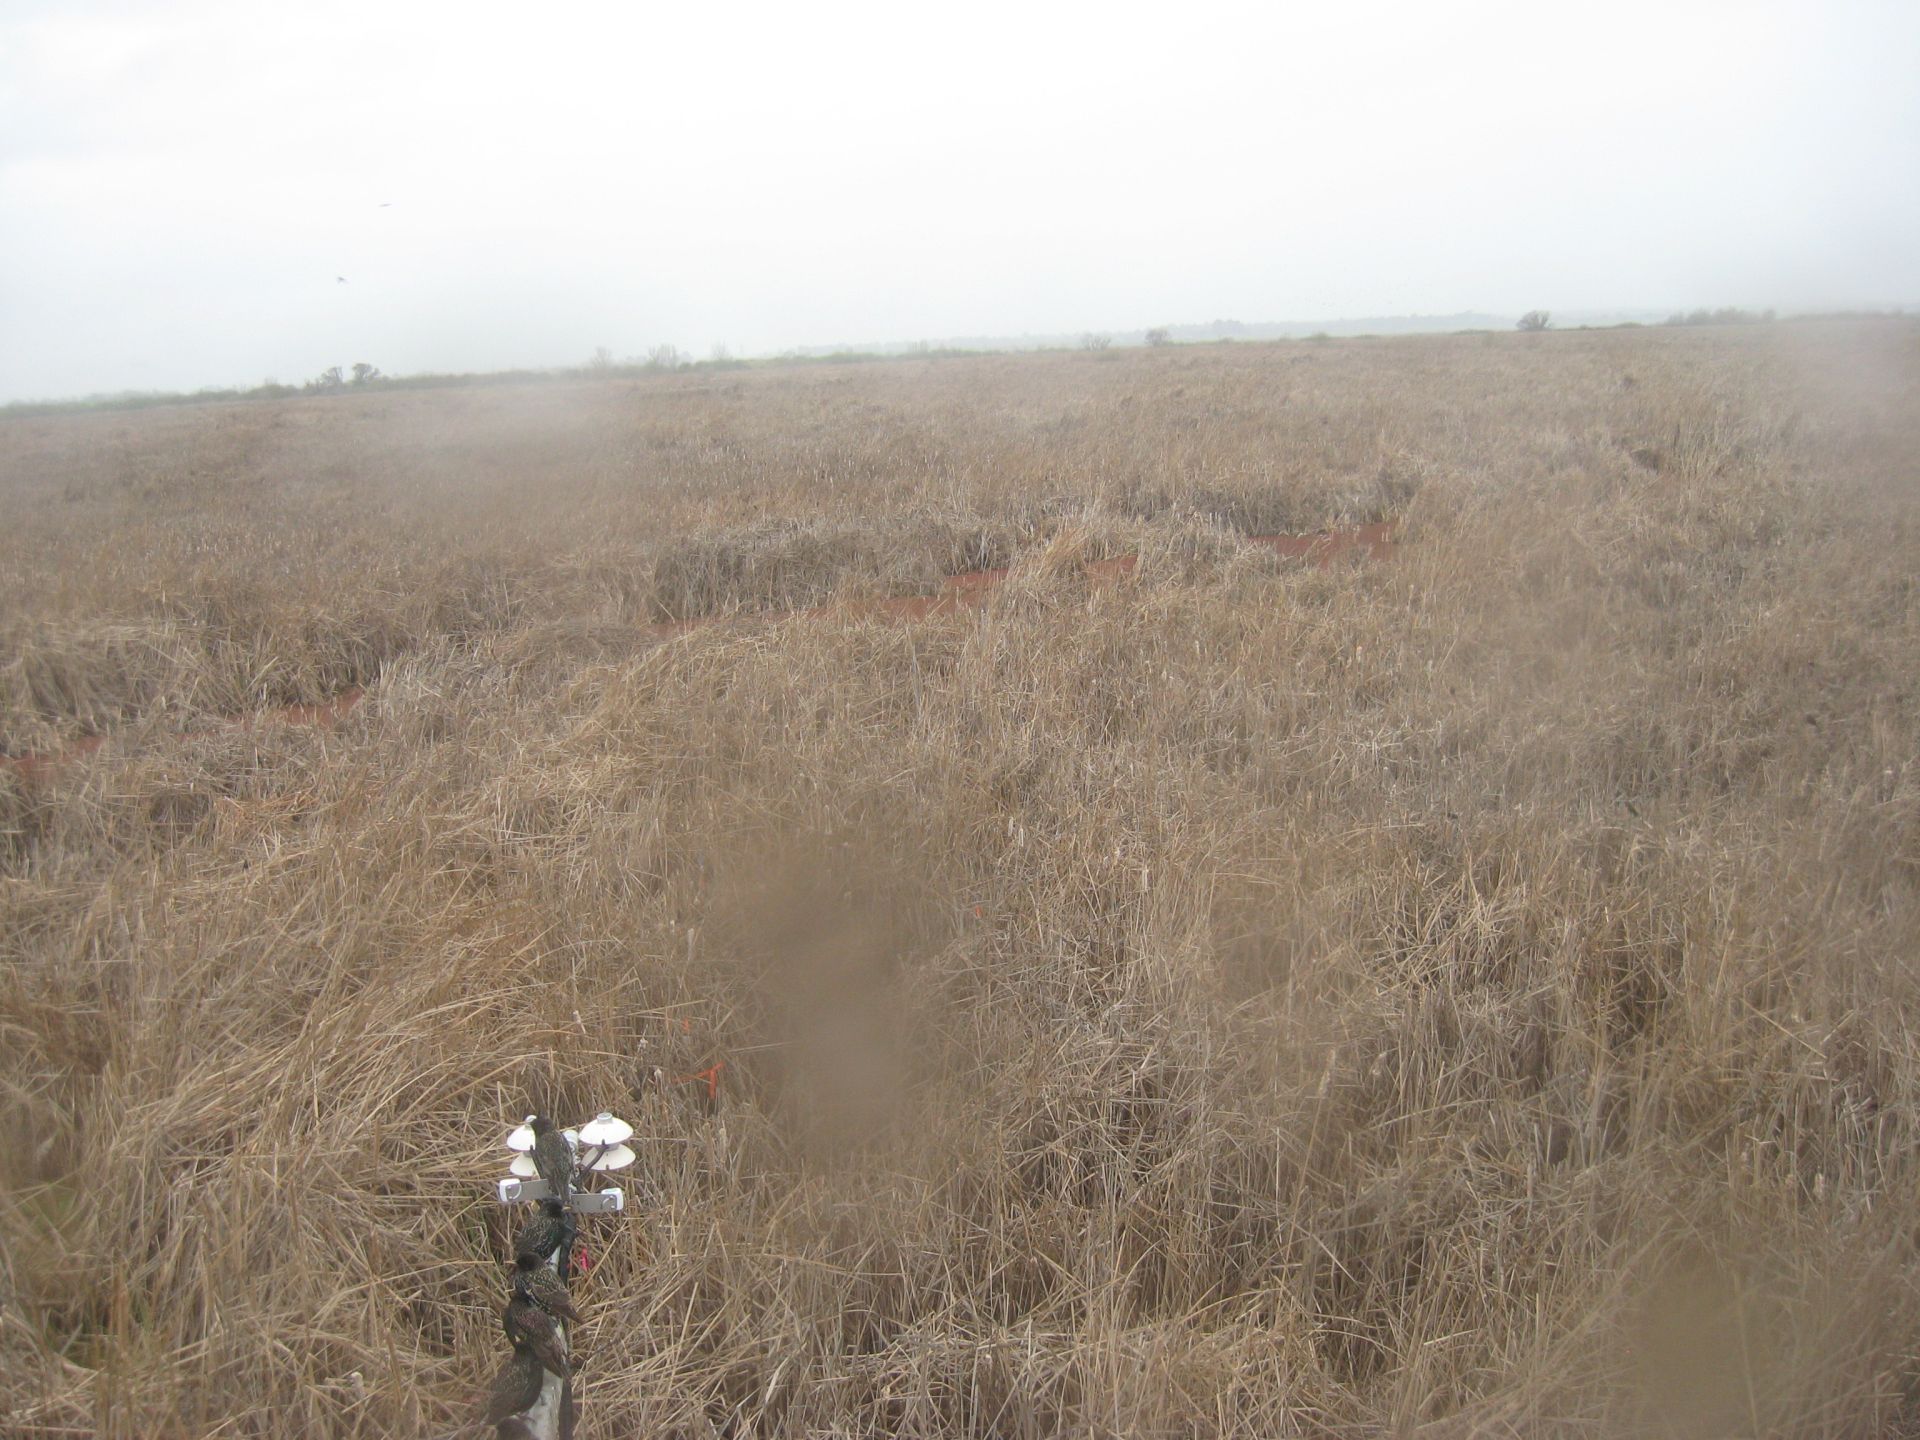
EE_autocam_20190227_1700.JPG ( 2019-02-27 17:00:00 ) Full size: 1920x1440
Starlings on radiation boom
11 sets found
14 EE_met graphs found
Can't check EE_mixed
1 EE_mixed graphs found
8 EE_flux graphs found
Can't check MBWPEESWGT_mixed
No data found for EE_cam.
Can't check MBEEWPSWEPGT_cam
Can't check SIMBTWEE_met
Can't check EE_Temp
5 EE_Temp graphs found
Can't check EE_minidot
1 EE_minidot graphs found
Can't check MBSWEEWPBCBA
1 EE_processed graphs found