
Field Notes
<--2018-11-01 09:35:00 | 2018-12-18 14:15:00-->Other sites visited today: Bouldin Alfalfa | East End | East Pond | Sherman Wetland | West Pond | Sherman Barn | Mayberry
Phenocam link: Searching...
Bouldin Corn: 2018-11-28 15:00:00 (DOY 332)
Author: Daphne Szutu
Others: Kyle, Kuno
Summary: Regular data collection/cleaning, field is flooded, first rains last week
| 2018-11-28 Bouldin Corn Kyle, Kuno, and I arrived at 15:00. There was some blue sky, with big clouds and light wind. The field is partly flooded, especially the southern end near the tower and the northern end near the highway. It has been raining in the past few days and a large storm is expected later that night. There were three white pickup trucks parked by the Duck Club and some bbq grills set up on the patio. I collected met, camera, and USB GHG data. The mux-datalogger wiring looked secure and there wasn’t any missing data in the past month, so I’m not sure what the problem was in October. Kuno cleaned flux and rad sensors. Wash reservoir was mostly empty, but we only filled the wash reservoir 2/3 full to save DI water for BA. LI-7500 readings: CO2 416ppm H2O 707ppm T 16.9C P 100.3kPa SS 101-->102 after cleaning LI7700 readings: CH4 2.18ppm RSSI 25 --> 89 after cleaning We left at 15:10. |
1 photos found
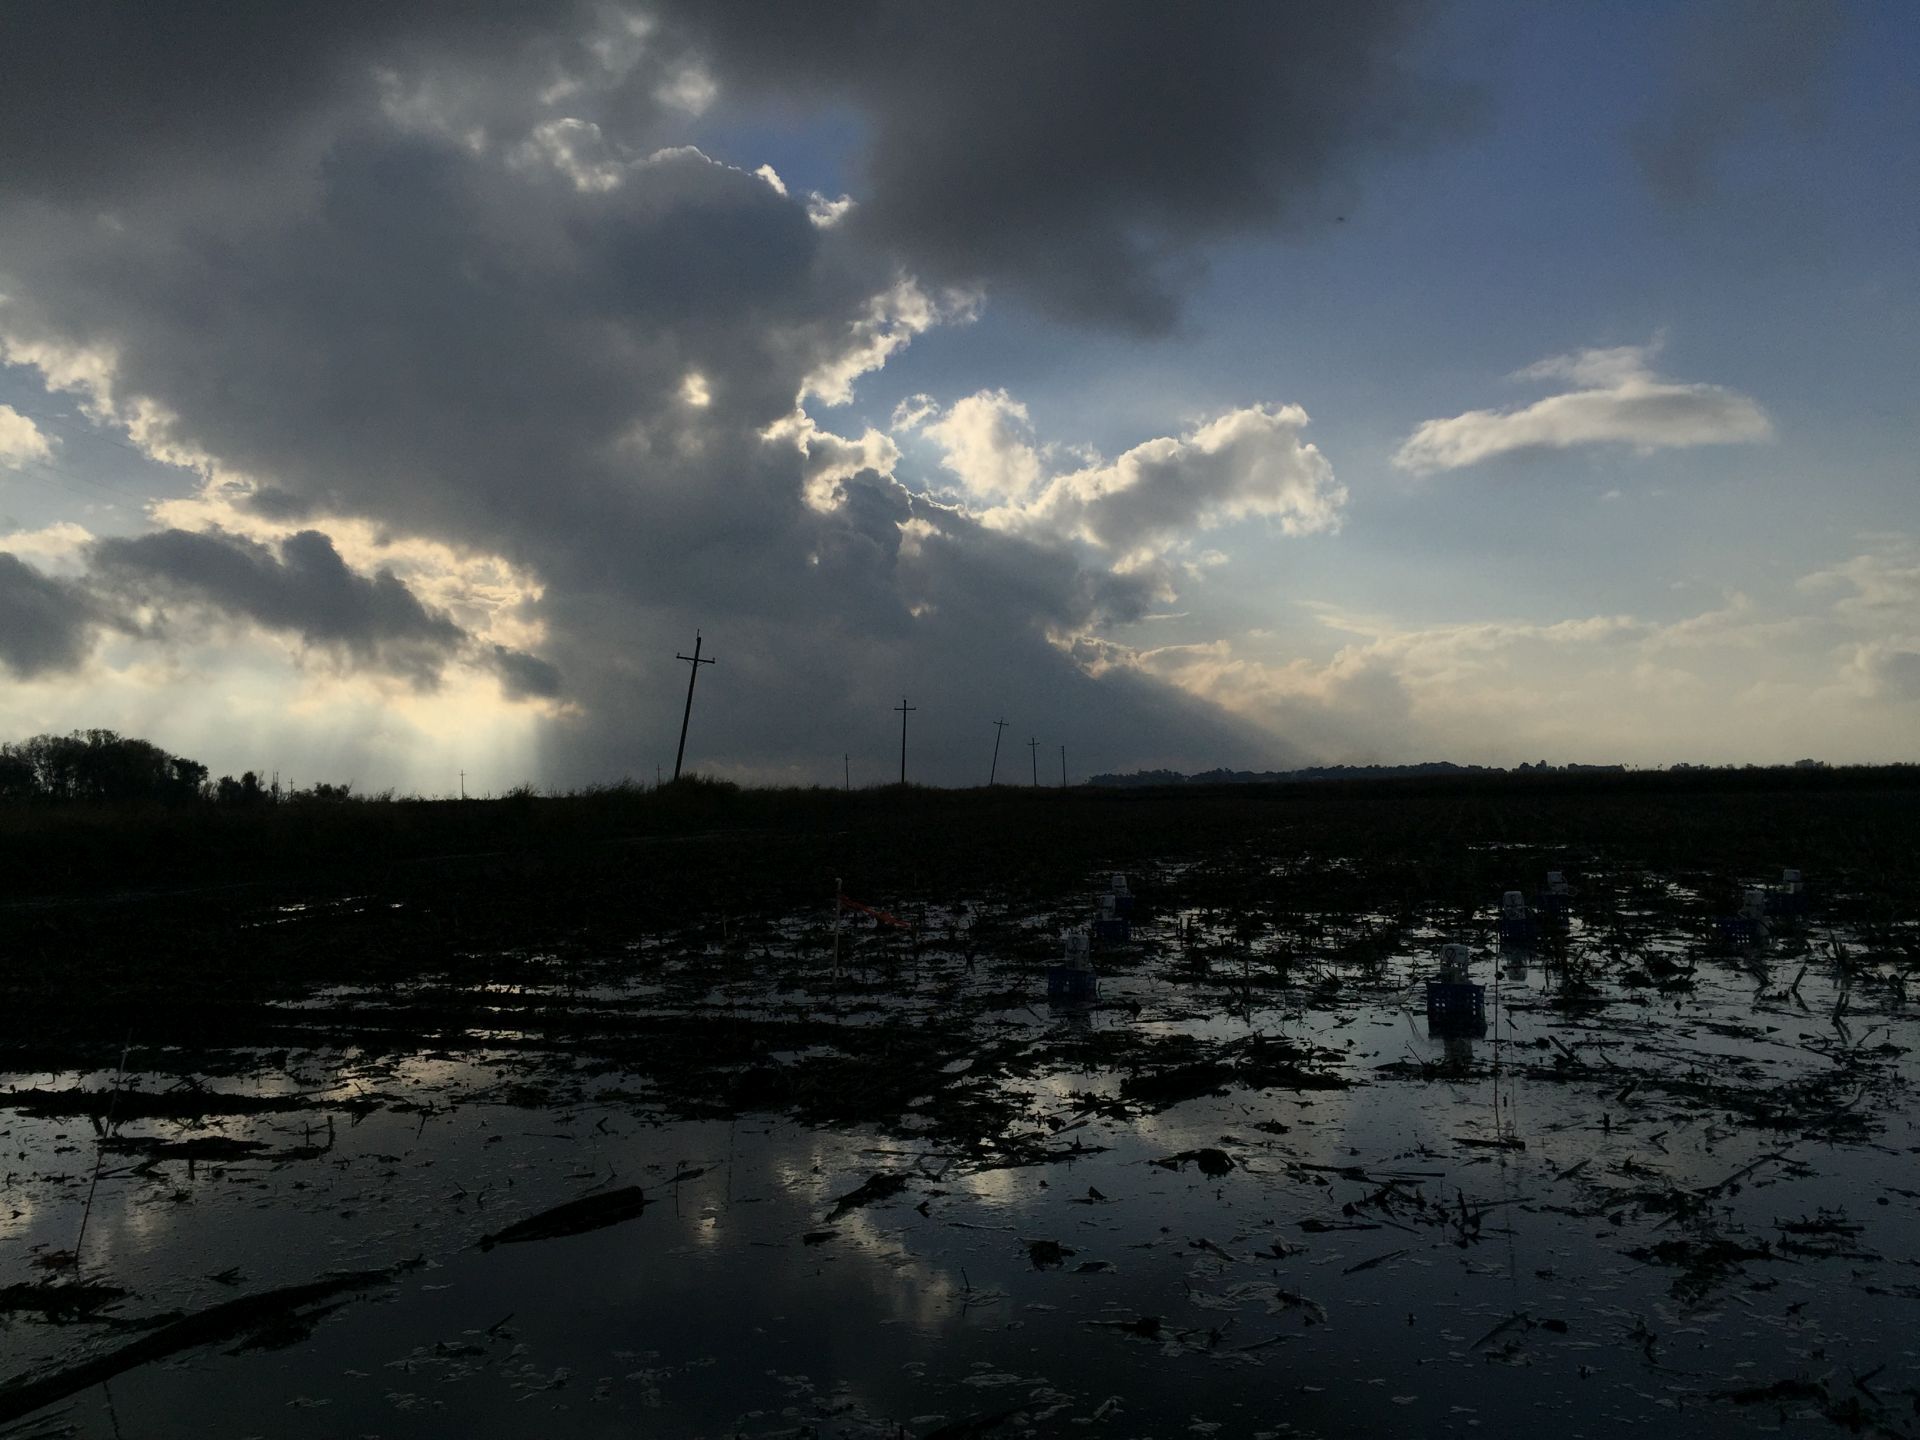
20181128BC_stormycloudsflooded.JPG ( 2018-11-28 15:02:59 ) Full size: 1920x1440
Dramatic stormy clouds and light beams over a flooded corn field.
6 sets found
17 BC_met graphs found
5 BC_flux graphs found
Can't check TATWBABCSB_cam
Can't check MBSWEEWPBCBA
2 BC_pa graphs found
1 BC_arable graphs found